
Key Insights
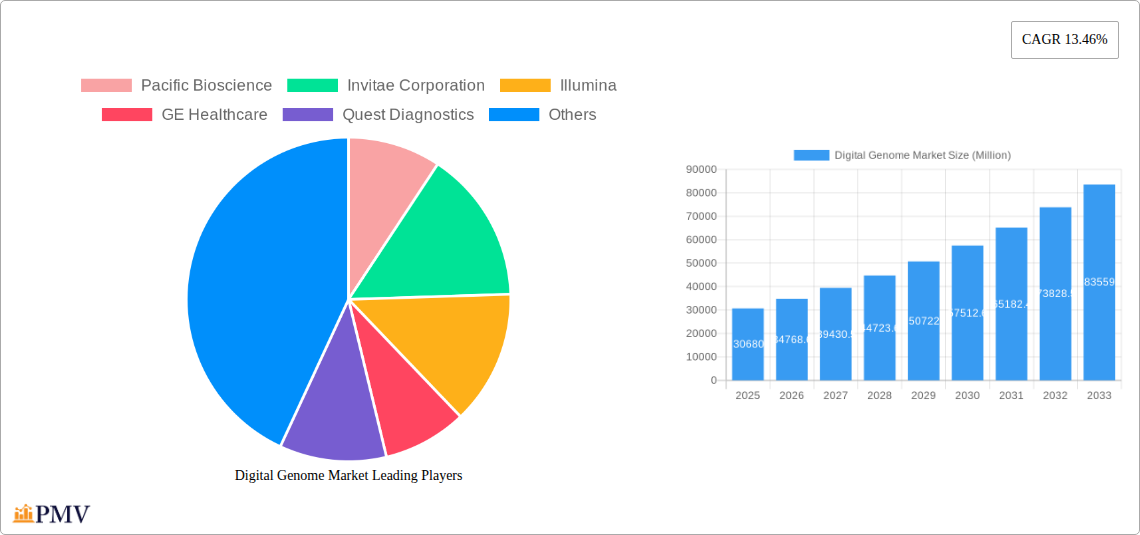
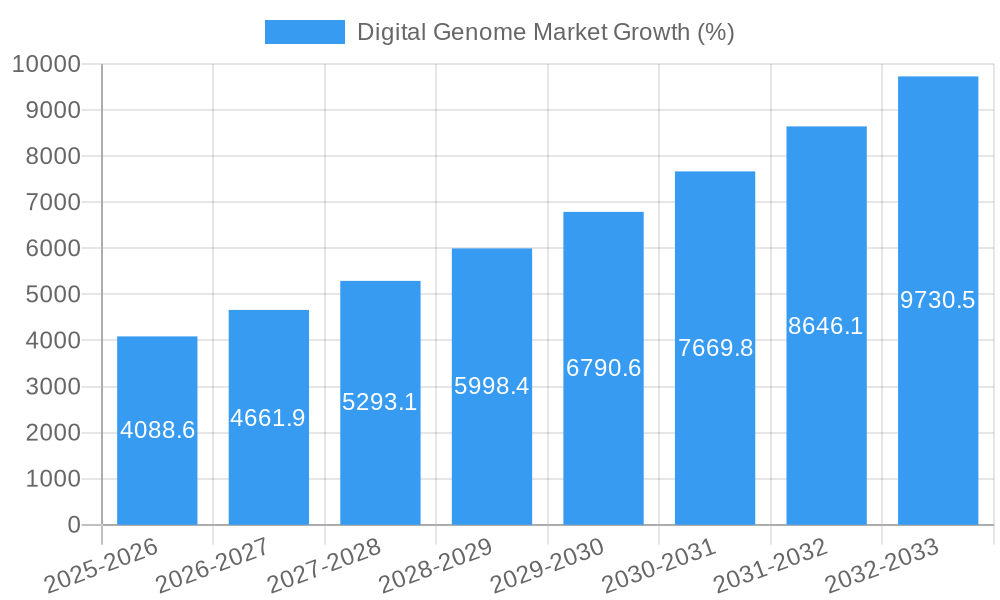
The global digital genome market, valued at $30.68 billion in 2025, is projected to experience robust growth, driven by several key factors. Advancements in next-generation sequencing (NGS) technologies are significantly reducing costs and increasing throughput, making genome sequencing more accessible for broader applications. The rising prevalence of chronic diseases like cancer and genetic disorders fuels demand for personalized medicine, which relies heavily on genomic data for diagnosis, prognosis, and treatment selection. Furthermore, increased government funding for genomics research and initiatives promoting precision medicine are bolstering market growth. The clinical application segment currently dominates the market, with hospitals and diagnostic centers leading end-user adoption. However, significant growth potential exists in the drug discovery and development sector, as pharmaceutical companies increasingly leverage genomic information for target identification and drug development. The Asia-Pacific region is anticipated to showcase substantial growth, driven by expanding healthcare infrastructure and increasing awareness of genomic technologies.
Despite this promising outlook, certain challenges remain. Data security and privacy concerns surrounding the handling of sensitive genomic information pose a significant hurdle. High initial investment costs associated with setting up advanced sequencing facilities can limit entry for smaller players. Furthermore, the need for skilled professionals to interpret complex genomic data creates a bottleneck. The market is highly competitive, with major players like Illumina, Thermo Fisher Scientific, and Qiagen leading the field. However, smaller companies specializing in niche technologies or specific applications are also emerging and contributing to innovation and market diversification. The forecast period (2025-2033) is expected to see continued expansion, fuelled by technological advancements, expanding applications, and growing market penetration in emerging economies. The compound annual growth rate (CAGR) of 13.46% indicates a consistently expanding market, promising significant investment and innovation opportunities.
Digital Genome Market: A Comprehensive Market Report (2019-2033)
This comprehensive report provides a detailed analysis of the Digital Genome Market, offering invaluable insights into market structure, competitive dynamics, industry trends, and future growth prospects. With a study period spanning from 2019 to 2033, a base year of 2025, and a forecast period from 2025 to 2033, this report is an essential resource for industry stakeholders, investors, and researchers seeking to understand this rapidly evolving market. The report analyzes a market valued at xx Million in 2025, projected to reach xx Million by 2033, exhibiting a CAGR of xx% during the forecast period.
Digital Genome Market Market Structure & Competitive Dynamics
The Digital Genome Market is characterized by a moderately concentrated structure, with key players holding significant market share. The market is witnessing increased innovation, driven by advancements in sequencing technologies and data analysis capabilities. Regulatory frameworks, particularly concerning data privacy and ethical considerations, play a crucial role in shaping market dynamics. Product substitutes, such as traditional diagnostic methods, pose a competitive challenge, although the advantages of digital genome analysis are increasingly recognized. End-user trends, particularly the growing adoption of personalized medicine and precision diagnostics, are driving market growth. The market is also witnessing significant M&A activity, with strategic acquisitions aimed at expanding product portfolios and market reach. For example, the acquisition of Veritas Genetics by LetsGetChecked in March 2022 exemplifies this trend. The deal value for this acquisition was xx Million. Some key metrics include:
- Market Concentration: Moderately concentrated, with top 5 players holding approximately xx% market share.
- M&A Activity: Significant activity observed in recent years, with deal values exceeding xx Million in total during the historical period (2019-2024).
- Innovation Ecosystem: Active collaboration between research institutions, technology providers, and healthcare providers is driving innovation.
Digital Genome Market Industry Trends & Insights
The Digital Genome Market is experiencing robust growth, fueled by several key factors. The increasing prevalence of chronic diseases, the rising demand for personalized medicine, and advancements in sequencing technologies are all contributing to market expansion. Technological disruptions, such as the development of next-generation sequencing (NGS) and improved bioinformatics tools, are revolutionizing the field. Consumer preferences are shifting towards faster, more accurate, and cost-effective diagnostic solutions, driving the adoption of digital genome technologies. The competitive landscape is highly dynamic, with companies investing heavily in R&D and strategic partnerships to gain a competitive edge. The market penetration of digital genome technologies is steadily increasing across various healthcare segments, particularly in developed economies. Specific metrics include:
- Market Growth Drivers: Rising prevalence of chronic diseases, increasing demand for personalized medicine, advancements in sequencing technologies, and decreasing sequencing costs.
- Technological Disruptions: NGS, improved bioinformatics tools, and AI-powered diagnostic solutions.
- Competitive Dynamics: Intense competition among established players and emerging companies, leading to product innovation and strategic partnerships.
Dominant Markets & Segments in Digital Genome Market
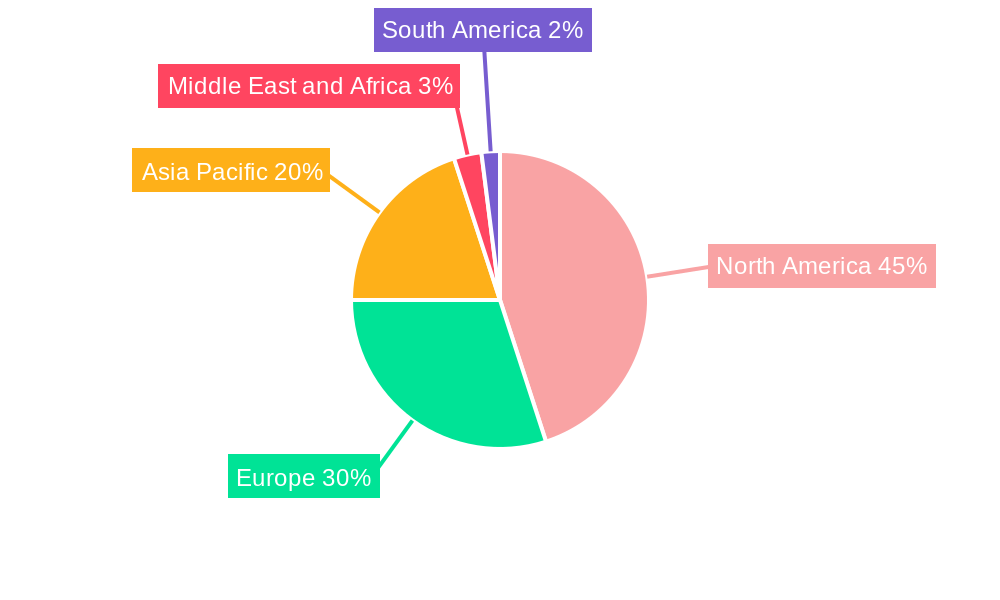
The North American region currently dominates the Digital Genome Market, driven by factors such as strong healthcare infrastructure, high adoption rates of advanced technologies, and favorable regulatory environments. Within the market segments, the clinical applications segment exhibits the highest growth potential, followed by drug discovery and development. Key drivers include:
- Sequencing and Analyzer Instruments: High demand for advanced and high-throughput sequencing systems is driving market growth.
- DNA/RNA Analysis Kits: Increased adoption of these kits in clinical diagnostics and research applications.
- Sequencing Chips: Technological advancements driving higher throughput and accuracy.
- Sequencing and Analysis Software: Demand for sophisticated software for data analysis and interpretation.
- Sample Preparation Instruments: Automation in sample preparation streamlining workflows.
- Clinical Applications: Growing adoption of genomics for diagnostics and personalized medicine.
- Forensics: Rising demand for high-throughput genomic analysis in forensic investigations.
- Drug Discovery and Development: Genomics is integral in identifying drug targets and developing personalized therapies.
- Hospitals, Diagnostic Centers and Forensic Labs: These end users account for the largest market share due to high volume testing requirements.
- Research Institutes: High R&D spending fuels demand for advanced sequencing and analysis technologies.
The dominance of North America is primarily attributed to factors such as significant investments in healthcare infrastructure and a higher per capita expenditure on healthcare compared to other regions.
Digital Genome Market Product Innovations
Recent innovations in digital genome technologies have focused on improving throughput, accuracy, cost-effectiveness, and ease of use. These innovations encompass advancements in sequencing platforms, data analysis software, and sample preparation techniques. This leads to faster turnaround times and improved diagnostic capabilities. These innovations are enabling broader access to digital genome testing, increasing the market's potential.
Report Segmentation & Scope
This report segments the Digital Genome Market based on product type (Sequencing and Analyzer Instruments, DNA/RNA Analysis Kits, Sequencing Chips, Sequencing and Analysis Software, Sample Preparation Instruments), application (Clinical, Forensics, Drug Discovery and Development, Other Applications), and end-user (Hospitals, Diagnostic Centers and Forensic Labs, Research Institutes, Other End Users). Each segment is analyzed in detail, providing market size, growth projections, and competitive dynamics for the forecast period.
Key Drivers of Digital Genome Market Growth
The Digital Genome Market's growth is propelled by advancements in sequencing technologies, decreasing sequencing costs, and increasing adoption of personalized medicine. Government initiatives promoting genomic research and the rising prevalence of chronic diseases further fuel this growth. The development of user-friendly software and the accessibility of big data analytics are also crucial drivers.
Challenges in the Digital Genome Market Sector
Challenges include stringent regulatory approvals, data privacy and security concerns, and the high cost of sequencing and analysis for certain applications. These factors can create barriers to entry for some companies and limit market expansion. Supply chain disruptions also pose a challenge.
Leading Players in the Digital Genome Market Market
- Pacific Biosciences
- Invitae Corporation
- Illumina
- GE Healthcare
- Quest Diagnostics
- Qiagen
- Thermo Fisher Scientific
- Inscripta Inc
- PerkinElmer Inc
- Agilent Technologies
- NanoString Technologies Inc
- GenMark Diagnostics Inc
- bioMérieux
Key Developments in Digital Genome Market Sector
- May 2022: Gencove and NEOGEN Corporation launched InfiniSEEK, a cost-effective whole genome sequencing solution.
- March 2022: LetsGetChecked acquired Veritas Genetics, enhancing its genomics capabilities.
Strategic Digital Genome Market Market Outlook
The Digital Genome Market is poised for significant growth over the coming years, driven by continuous technological advancements, increasing adoption across diverse applications, and supportive regulatory frameworks. Strategic opportunities exist for companies to invest in innovative technologies, expand into emerging markets, and establish strategic partnerships to capitalize on the market's potential. Focus on personalized medicine and improved data analytics will be key to success.
Digital Genome Market Segmentation
-
1. Product
- 1.1. Sequencing and Analyzer Instruments
- 1.2. DNA/RNA Analysis Kits
- 1.3. Sequencing Chips
- 1.4. Sequencing and Analysis Software
- 1.5. Sample Preparation Instruments
-
2. Application
-
2.1. Clinical
- 2.1.1. Reproductive Health
- 2.1.2. Oncology
- 2.1.3. Others
- 2.2. Forensics
- 2.3. Drug Discovery and Development
- 2.4. Other Applications
-
2.1. Clinical
-
3. End User
- 3.1. Hospitals
- 3.2. Diagnostic Centers and Forensic Labs
- 3.3. Research Institutes
- 3.4. Other End Users
Digital Genome Market Segmentation By Geography
-
1. North America
- 1.1. United States
- 1.2. Canada
- 1.3. Mexico
-
2. Europe
- 2.1. Germany
- 2.2. United Kingdom
- 2.3. France
- 2.4. Italy
- 2.5. Spain
- 2.6. Rest of Europe
-
3. Asia Pacific
- 3.1. China
- 3.2. Japan
- 3.3. India
- 3.4. Australia
- 3.5. South Korea
- 3.6. Rest of Asia Pacific
-
4. Middle East and Africa
- 4.1. GCC
- 4.2. South Africa
- 4.3. Rest of Middle East and Africa
-
5. South America
- 5.1. Brazil
- 5.2. Argentina
- 5.3. Rest of South America
Digital Genome Market REPORT HIGHLIGHTS
| Aspects | Details |
|---|---|
| Study Period | 2019-2033 |
| Base Year | 2024 |
| Estimated Year | 2025 |
| Forecast Period | 2025-2033 |
| Historical Period | 2019-2024 |
| Growth Rate | CAGR of 13.46% from 2019-2033 |
| Segmentation |
|
Table of Contents
- 1. Introduction
- 1.1. Research Scope
- 1.2. Market Segmentation
- 1.3. Research Methodology
- 1.4. Definitions and Assumptions
- 2. Executive Summary
- 2.1. Introduction
- 3. Market Dynamics
- 3.1. Introduction
- 3.2. Market Drivers
- 3.2.1 Increasing Technological Advancements
- 3.2.2 and Research and Development Pertaining to Digital Genome; Growing Adoption of Personalized Medicine; Constantly Evolving Disease Patterns
- 3.3. Market Restrains
- 3.3.1. High Capital Expenditure; Lack of Skilled Workforce
- 3.4. Market Trends
- 3.4.1. Sequencing and Analysis Software Segment is Expected to Hold a Major Market Share in the Digital Genome Market Over the Forecast Period
- 4. Market Factor Analysis
- 4.1. Porters Five Forces
- 4.2. Supply/Value Chain
- 4.3. PESTEL analysis
- 4.4. Market Entropy
- 4.5. Patent/Trademark Analysis
- 5. Global Digital Genome Market Analysis, Insights and Forecast, 2019-2031
- 5.1. Market Analysis, Insights and Forecast - by Product
- 5.1.1. Sequencing and Analyzer Instruments
- 5.1.2. DNA/RNA Analysis Kits
- 5.1.3. Sequencing Chips
- 5.1.4. Sequencing and Analysis Software
- 5.1.5. Sample Preparation Instruments
- 5.2. Market Analysis, Insights and Forecast - by Application
- 5.2.1. Clinical
- 5.2.1.1. Reproductive Health
- 5.2.1.2. Oncology
- 5.2.1.3. Others
- 5.2.2. Forensics
- 5.2.3. Drug Discovery and Development
- 5.2.4. Other Applications
- 5.2.1. Clinical
- 5.3. Market Analysis, Insights and Forecast - by End User
- 5.3.1. Hospitals
- 5.3.2. Diagnostic Centers and Forensic Labs
- 5.3.3. Research Institutes
- 5.3.4. Other End Users
- 5.4. Market Analysis, Insights and Forecast - by Region
- 5.4.1. North America
- 5.4.2. Europe
- 5.4.3. Asia Pacific
- 5.4.4. Middle East and Africa
- 5.4.5. South America
- 5.1. Market Analysis, Insights and Forecast - by Product
- 6. North America Digital Genome Market Analysis, Insights and Forecast, 2019-2031
- 6.1. Market Analysis, Insights and Forecast - by Product
- 6.1.1. Sequencing and Analyzer Instruments
- 6.1.2. DNA/RNA Analysis Kits
- 6.1.3. Sequencing Chips
- 6.1.4. Sequencing and Analysis Software
- 6.1.5. Sample Preparation Instruments
- 6.2. Market Analysis, Insights and Forecast - by Application
- 6.2.1. Clinical
- 6.2.1.1. Reproductive Health
- 6.2.1.2. Oncology
- 6.2.1.3. Others
- 6.2.2. Forensics
- 6.2.3. Drug Discovery and Development
- 6.2.4. Other Applications
- 6.2.1. Clinical
- 6.3. Market Analysis, Insights and Forecast - by End User
- 6.3.1. Hospitals
- 6.3.2. Diagnostic Centers and Forensic Labs
- 6.3.3. Research Institutes
- 6.3.4. Other End Users
- 6.1. Market Analysis, Insights and Forecast - by Product
- 7. Europe Digital Genome Market Analysis, Insights and Forecast, 2019-2031
- 7.1. Market Analysis, Insights and Forecast - by Product
- 7.1.1. Sequencing and Analyzer Instruments
- 7.1.2. DNA/RNA Analysis Kits
- 7.1.3. Sequencing Chips
- 7.1.4. Sequencing and Analysis Software
- 7.1.5. Sample Preparation Instruments
- 7.2. Market Analysis, Insights and Forecast - by Application
- 7.2.1. Clinical
- 7.2.1.1. Reproductive Health
- 7.2.1.2. Oncology
- 7.2.1.3. Others
- 7.2.2. Forensics
- 7.2.3. Drug Discovery and Development
- 7.2.4. Other Applications
- 7.2.1. Clinical
- 7.3. Market Analysis, Insights and Forecast - by End User
- 7.3.1. Hospitals
- 7.3.2. Diagnostic Centers and Forensic Labs
- 7.3.3. Research Institutes
- 7.3.4. Other End Users
- 7.1. Market Analysis, Insights and Forecast - by Product
- 8. Asia Pacific Digital Genome Market Analysis, Insights and Forecast, 2019-2031
- 8.1. Market Analysis, Insights and Forecast - by Product
- 8.1.1. Sequencing and Analyzer Instruments
- 8.1.2. DNA/RNA Analysis Kits
- 8.1.3. Sequencing Chips
- 8.1.4. Sequencing and Analysis Software
- 8.1.5. Sample Preparation Instruments
- 8.2. Market Analysis, Insights and Forecast - by Application
- 8.2.1. Clinical
- 8.2.1.1. Reproductive Health
- 8.2.1.2. Oncology
- 8.2.1.3. Others
- 8.2.2. Forensics
- 8.2.3. Drug Discovery and Development
- 8.2.4. Other Applications
- 8.2.1. Clinical
- 8.3. Market Analysis, Insights and Forecast - by End User
- 8.3.1. Hospitals
- 8.3.2. Diagnostic Centers and Forensic Labs
- 8.3.3. Research Institutes
- 8.3.4. Other End Users
- 8.1. Market Analysis, Insights and Forecast - by Product
- 9. Middle East and Africa Digital Genome Market Analysis, Insights and Forecast, 2019-2031
- 9.1. Market Analysis, Insights and Forecast - by Product
- 9.1.1. Sequencing and Analyzer Instruments
- 9.1.2. DNA/RNA Analysis Kits
- 9.1.3. Sequencing Chips
- 9.1.4. Sequencing and Analysis Software
- 9.1.5. Sample Preparation Instruments
- 9.2. Market Analysis, Insights and Forecast - by Application
- 9.2.1. Clinical
- 9.2.1.1. Reproductive Health
- 9.2.1.2. Oncology
- 9.2.1.3. Others
- 9.2.2. Forensics
- 9.2.3. Drug Discovery and Development
- 9.2.4. Other Applications
- 9.2.1. Clinical
- 9.3. Market Analysis, Insights and Forecast - by End User
- 9.3.1. Hospitals
- 9.3.2. Diagnostic Centers and Forensic Labs
- 9.3.3. Research Institutes
- 9.3.4. Other End Users
- 9.1. Market Analysis, Insights and Forecast - by Product
- 10. South America Digital Genome Market Analysis, Insights and Forecast, 2019-2031
- 10.1. Market Analysis, Insights and Forecast - by Product
- 10.1.1. Sequencing and Analyzer Instruments
- 10.1.2. DNA/RNA Analysis Kits
- 10.1.3. Sequencing Chips
- 10.1.4. Sequencing and Analysis Software
- 10.1.5. Sample Preparation Instruments
- 10.2. Market Analysis, Insights and Forecast - by Application
- 10.2.1. Clinical
- 10.2.1.1. Reproductive Health
- 10.2.1.2. Oncology
- 10.2.1.3. Others
- 10.2.2. Forensics
- 10.2.3. Drug Discovery and Development
- 10.2.4. Other Applications
- 10.2.1. Clinical
- 10.3. Market Analysis, Insights and Forecast - by End User
- 10.3.1. Hospitals
- 10.3.2. Diagnostic Centers and Forensic Labs
- 10.3.3. Research Institutes
- 10.3.4. Other End Users
- 10.1. Market Analysis, Insights and Forecast - by Product
- 11. North America Digital Genome Market Analysis, Insights and Forecast, 2019-2031
- 11.1. Market Analysis, Insights and Forecast - By Country/Sub-region
- 11.1.1 United States
- 11.1.2 Canada
- 11.1.3 Mexico
- 12. Europe Digital Genome Market Analysis, Insights and Forecast, 2019-2031
- 12.1. Market Analysis, Insights and Forecast - By Country/Sub-region
- 12.1.1 Germany
- 12.1.2 United Kingdom
- 12.1.3 France
- 12.1.4 Italy
- 12.1.5 Spain
- 12.1.6 Rest of Europe
- 13. Asia Pacific Digital Genome Market Analysis, Insights and Forecast, 2019-2031
- 13.1. Market Analysis, Insights and Forecast - By Country/Sub-region
- 13.1.1 China
- 13.1.2 Japan
- 13.1.3 India
- 13.1.4 Australia
- 13.1.5 South Korea
- 13.1.6 Rest of Asia Pacific
- 14. Middle East and Africa Digital Genome Market Analysis, Insights and Forecast, 2019-2031
- 14.1. Market Analysis, Insights and Forecast - By Country/Sub-region
- 14.1.1 GCC
- 14.1.2 South Africa
- 14.1.3 Rest of Middle East and Africa
- 15. South America Digital Genome Market Analysis, Insights and Forecast, 2019-2031
- 15.1. Market Analysis, Insights and Forecast - By Country/Sub-region
- 15.1.1 Brazil
- 15.1.2 Argentina
- 15.1.3 Rest of South America
- 16. Competitive Analysis
- 16.1. Global Market Share Analysis 2024
- 16.2. Company Profiles
- 16.2.1 Pacific Bioscience
- 16.2.1.1. Overview
- 16.2.1.2. Products
- 16.2.1.3. SWOT Analysis
- 16.2.1.4. Recent Developments
- 16.2.1.5. Financials (Based on Availability)
- 16.2.2 Invitae Corporation
- 16.2.2.1. Overview
- 16.2.2.2. Products
- 16.2.2.3. SWOT Analysis
- 16.2.2.4. Recent Developments
- 16.2.2.5. Financials (Based on Availability)
- 16.2.3 Illumina
- 16.2.3.1. Overview
- 16.2.3.2. Products
- 16.2.3.3. SWOT Analysis
- 16.2.3.4. Recent Developments
- 16.2.3.5. Financials (Based on Availability)
- 16.2.4 GE Healthcare
- 16.2.4.1. Overview
- 16.2.4.2. Products
- 16.2.4.3. SWOT Analysis
- 16.2.4.4. Recent Developments
- 16.2.4.5. Financials (Based on Availability)
- 16.2.5 Quest Diagnostics
- 16.2.5.1. Overview
- 16.2.5.2. Products
- 16.2.5.3. SWOT Analysis
- 16.2.5.4. Recent Developments
- 16.2.5.5. Financials (Based on Availability)
- 16.2.6 Qiagen
- 16.2.6.1. Overview
- 16.2.6.2. Products
- 16.2.6.3. SWOT Analysis
- 16.2.6.4. Recent Developments
- 16.2.6.5. Financials (Based on Availability)
- 16.2.7 Thermo Fisher Scientific
- 16.2.7.1. Overview
- 16.2.7.2. Products
- 16.2.7.3. SWOT Analysis
- 16.2.7.4. Recent Developments
- 16.2.7.5. Financials (Based on Availability)
- 16.2.8 Inscripta Inc
- 16.2.8.1. Overview
- 16.2.8.2. Products
- 16.2.8.3. SWOT Analysis
- 16.2.8.4. Recent Developments
- 16.2.8.5. Financials (Based on Availability)
- 16.2.9 PerkinElmer Inc
- 16.2.9.1. Overview
- 16.2.9.2. Products
- 16.2.9.3. SWOT Analysis
- 16.2.9.4. Recent Developments
- 16.2.9.5. Financials (Based on Availability)
- 16.2.10 Agilent Technologies
- 16.2.10.1. Overview
- 16.2.10.2. Products
- 16.2.10.3. SWOT Analysis
- 16.2.10.4. Recent Developments
- 16.2.10.5. Financials (Based on Availability)
- 16.2.11 NanoString Technologies Inc
- 16.2.11.1. Overview
- 16.2.11.2. Products
- 16.2.11.3. SWOT Analysis
- 16.2.11.4. Recent Developments
- 16.2.11.5. Financials (Based on Availability)
- 16.2.12 GenMark Diagnostics Inc
- 16.2.12.1. Overview
- 16.2.12.2. Products
- 16.2.12.3. SWOT Analysis
- 16.2.12.4. Recent Developments
- 16.2.12.5. Financials (Based on Availability)
- 16.2.13 bioMérieux
- 16.2.13.1. Overview
- 16.2.13.2. Products
- 16.2.13.3. SWOT Analysis
- 16.2.13.4. Recent Developments
- 16.2.13.5. Financials (Based on Availability)
- 16.2.1 Pacific Bioscience
List of Figures
- Figure 1: Global Digital Genome Market Revenue Breakdown (Million, %) by Region 2024 & 2032
- Figure 2: Global Digital Genome Market Volume Breakdown (K Unit, %) by Region 2024 & 2032
- Figure 3: North America Digital Genome Market Revenue (Million), by Country 2024 & 2032
- Figure 4: North America Digital Genome Market Volume (K Unit), by Country 2024 & 2032
- Figure 5: North America Digital Genome Market Revenue Share (%), by Country 2024 & 2032
- Figure 6: North America Digital Genome Market Volume Share (%), by Country 2024 & 2032
- Figure 7: Europe Digital Genome Market Revenue (Million), by Country 2024 & 2032
- Figure 8: Europe Digital Genome Market Volume (K Unit), by Country 2024 & 2032
- Figure 9: Europe Digital Genome Market Revenue Share (%), by Country 2024 & 2032
- Figure 10: Europe Digital Genome Market Volume Share (%), by Country 2024 & 2032
- Figure 11: Asia Pacific Digital Genome Market Revenue (Million), by Country 2024 & 2032
- Figure 12: Asia Pacific Digital Genome Market Volume (K Unit), by Country 2024 & 2032
- Figure 13: Asia Pacific Digital Genome Market Revenue Share (%), by Country 2024 & 2032
- Figure 14: Asia Pacific Digital Genome Market Volume Share (%), by Country 2024 & 2032
- Figure 15: Middle East and Africa Digital Genome Market Revenue (Million), by Country 2024 & 2032
- Figure 16: Middle East and Africa Digital Genome Market Volume (K Unit), by Country 2024 & 2032
- Figure 17: Middle East and Africa Digital Genome Market Revenue Share (%), by Country 2024 & 2032
- Figure 18: Middle East and Africa Digital Genome Market Volume Share (%), by Country 2024 & 2032
- Figure 19: South America Digital Genome Market Revenue (Million), by Country 2024 & 2032
- Figure 20: South America Digital Genome Market Volume (K Unit), by Country 2024 & 2032
- Figure 21: South America Digital Genome Market Revenue Share (%), by Country 2024 & 2032
- Figure 22: South America Digital Genome Market Volume Share (%), by Country 2024 & 2032
- Figure 23: North America Digital Genome Market Revenue (Million), by Product 2024 & 2032
- Figure 24: North America Digital Genome Market Volume (K Unit), by Product 2024 & 2032
- Figure 25: North America Digital Genome Market Revenue Share (%), by Product 2024 & 2032
- Figure 26: North America Digital Genome Market Volume Share (%), by Product 2024 & 2032
- Figure 27: North America Digital Genome Market Revenue (Million), by Application 2024 & 2032
- Figure 28: North America Digital Genome Market Volume (K Unit), by Application 2024 & 2032
- Figure 29: North America Digital Genome Market Revenue Share (%), by Application 2024 & 2032
- Figure 30: North America Digital Genome Market Volume Share (%), by Application 2024 & 2032
- Figure 31: North America Digital Genome Market Revenue (Million), by End User 2024 & 2032
- Figure 32: North America Digital Genome Market Volume (K Unit), by End User 2024 & 2032
- Figure 33: North America Digital Genome Market Revenue Share (%), by End User 2024 & 2032
- Figure 34: North America Digital Genome Market Volume Share (%), by End User 2024 & 2032
- Figure 35: North America Digital Genome Market Revenue (Million), by Country 2024 & 2032
- Figure 36: North America Digital Genome Market Volume (K Unit), by Country 2024 & 2032
- Figure 37: North America Digital Genome Market Revenue Share (%), by Country 2024 & 2032
- Figure 38: North America Digital Genome Market Volume Share (%), by Country 2024 & 2032
- Figure 39: Europe Digital Genome Market Revenue (Million), by Product 2024 & 2032
- Figure 40: Europe Digital Genome Market Volume (K Unit), by Product 2024 & 2032
- Figure 41: Europe Digital Genome Market Revenue Share (%), by Product 2024 & 2032
- Figure 42: Europe Digital Genome Market Volume Share (%), by Product 2024 & 2032
- Figure 43: Europe Digital Genome Market Revenue (Million), by Application 2024 & 2032
- Figure 44: Europe Digital Genome Market Volume (K Unit), by Application 2024 & 2032
- Figure 45: Europe Digital Genome Market Revenue Share (%), by Application 2024 & 2032
- Figure 46: Europe Digital Genome Market Volume Share (%), by Application 2024 & 2032
- Figure 47: Europe Digital Genome Market Revenue (Million), by End User 2024 & 2032
- Figure 48: Europe Digital Genome Market Volume (K Unit), by End User 2024 & 2032
- Figure 49: Europe Digital Genome Market Revenue Share (%), by End User 2024 & 2032
- Figure 50: Europe Digital Genome Market Volume Share (%), by End User 2024 & 2032
- Figure 51: Europe Digital Genome Market Revenue (Million), by Country 2024 & 2032
- Figure 52: Europe Digital Genome Market Volume (K Unit), by Country 2024 & 2032
- Figure 53: Europe Digital Genome Market Revenue Share (%), by Country 2024 & 2032
- Figure 54: Europe Digital Genome Market Volume Share (%), by Country 2024 & 2032
- Figure 55: Asia Pacific Digital Genome Market Revenue (Million), by Product 2024 & 2032
- Figure 56: Asia Pacific Digital Genome Market Volume (K Unit), by Product 2024 & 2032
- Figure 57: Asia Pacific Digital Genome Market Revenue Share (%), by Product 2024 & 2032
- Figure 58: Asia Pacific Digital Genome Market Volume Share (%), by Product 2024 & 2032
- Figure 59: Asia Pacific Digital Genome Market Revenue (Million), by Application 2024 & 2032
- Figure 60: Asia Pacific Digital Genome Market Volume (K Unit), by Application 2024 & 2032
- Figure 61: Asia Pacific Digital Genome Market Revenue Share (%), by Application 2024 & 2032
- Figure 62: Asia Pacific Digital Genome Market Volume Share (%), by Application 2024 & 2032
- Figure 63: Asia Pacific Digital Genome Market Revenue (Million), by End User 2024 & 2032
- Figure 64: Asia Pacific Digital Genome Market Volume (K Unit), by End User 2024 & 2032
- Figure 65: Asia Pacific Digital Genome Market Revenue Share (%), by End User 2024 & 2032
- Figure 66: Asia Pacific Digital Genome Market Volume Share (%), by End User 2024 & 2032
- Figure 67: Asia Pacific Digital Genome Market Revenue (Million), by Country 2024 & 2032
- Figure 68: Asia Pacific Digital Genome Market Volume (K Unit), by Country 2024 & 2032
- Figure 69: Asia Pacific Digital Genome Market Revenue Share (%), by Country 2024 & 2032
- Figure 70: Asia Pacific Digital Genome Market Volume Share (%), by Country 2024 & 2032
- Figure 71: Middle East and Africa Digital Genome Market Revenue (Million), by Product 2024 & 2032
- Figure 72: Middle East and Africa Digital Genome Market Volume (K Unit), by Product 2024 & 2032
- Figure 73: Middle East and Africa Digital Genome Market Revenue Share (%), by Product 2024 & 2032
- Figure 74: Middle East and Africa Digital Genome Market Volume Share (%), by Product 2024 & 2032
- Figure 75: Middle East and Africa Digital Genome Market Revenue (Million), by Application 2024 & 2032
- Figure 76: Middle East and Africa Digital Genome Market Volume (K Unit), by Application 2024 & 2032
- Figure 77: Middle East and Africa Digital Genome Market Revenue Share (%), by Application 2024 & 2032
- Figure 78: Middle East and Africa Digital Genome Market Volume Share (%), by Application 2024 & 2032
- Figure 79: Middle East and Africa Digital Genome Market Revenue (Million), by End User 2024 & 2032
- Figure 80: Middle East and Africa Digital Genome Market Volume (K Unit), by End User 2024 & 2032
- Figure 81: Middle East and Africa Digital Genome Market Revenue Share (%), by End User 2024 & 2032
- Figure 82: Middle East and Africa Digital Genome Market Volume Share (%), by End User 2024 & 2032
- Figure 83: Middle East and Africa Digital Genome Market Revenue (Million), by Country 2024 & 2032
- Figure 84: Middle East and Africa Digital Genome Market Volume (K Unit), by Country 2024 & 2032
- Figure 85: Middle East and Africa Digital Genome Market Revenue Share (%), by Country 2024 & 2032
- Figure 86: Middle East and Africa Digital Genome Market Volume Share (%), by Country 2024 & 2032
- Figure 87: South America Digital Genome Market Revenue (Million), by Product 2024 & 2032
- Figure 88: South America Digital Genome Market Volume (K Unit), by Product 2024 & 2032
- Figure 89: South America Digital Genome Market Revenue Share (%), by Product 2024 & 2032
- Figure 90: South America Digital Genome Market Volume Share (%), by Product 2024 & 2032
- Figure 91: South America Digital Genome Market Revenue (Million), by Application 2024 & 2032
- Figure 92: South America Digital Genome Market Volume (K Unit), by Application 2024 & 2032
- Figure 93: South America Digital Genome Market Revenue Share (%), by Application 2024 & 2032
- Figure 94: South America Digital Genome Market Volume Share (%), by Application 2024 & 2032
- Figure 95: South America Digital Genome Market Revenue (Million), by End User 2024 & 2032
- Figure 96: South America Digital Genome Market Volume (K Unit), by End User 2024 & 2032
- Figure 97: South America Digital Genome Market Revenue Share (%), by End User 2024 & 2032
- Figure 98: South America Digital Genome Market Volume Share (%), by End User 2024 & 2032
- Figure 99: South America Digital Genome Market Revenue (Million), by Country 2024 & 2032
- Figure 100: South America Digital Genome Market Volume (K Unit), by Country 2024 & 2032
- Figure 101: South America Digital Genome Market Revenue Share (%), by Country 2024 & 2032
- Figure 102: South America Digital Genome Market Volume Share (%), by Country 2024 & 2032
List of Tables
- Table 1: Global Digital Genome Market Revenue Million Forecast, by Region 2019 & 2032
- Table 2: Global Digital Genome Market Volume K Unit Forecast, by Region 2019 & 2032
- Table 3: Global Digital Genome Market Revenue Million Forecast, by Product 2019 & 2032
- Table 4: Global Digital Genome Market Volume K Unit Forecast, by Product 2019 & 2032
- Table 5: Global Digital Genome Market Revenue Million Forecast, by Application 2019 & 2032
- Table 6: Global Digital Genome Market Volume K Unit Forecast, by Application 2019 & 2032
- Table 7: Global Digital Genome Market Revenue Million Forecast, by End User 2019 & 2032
- Table 8: Global Digital Genome Market Volume K Unit Forecast, by End User 2019 & 2032
- Table 9: Global Digital Genome Market Revenue Million Forecast, by Region 2019 & 2032
- Table 10: Global Digital Genome Market Volume K Unit Forecast, by Region 2019 & 2032
- Table 11: Global Digital Genome Market Revenue Million Forecast, by Country 2019 & 2032
- Table 12: Global Digital Genome Market Volume K Unit Forecast, by Country 2019 & 2032
- Table 13: United States Digital Genome Market Revenue (Million) Forecast, by Application 2019 & 2032
- Table 14: United States Digital Genome Market Volume (K Unit) Forecast, by Application 2019 & 2032
- Table 15: Canada Digital Genome Market Revenue (Million) Forecast, by Application 2019 & 2032
- Table 16: Canada Digital Genome Market Volume (K Unit) Forecast, by Application 2019 & 2032
- Table 17: Mexico Digital Genome Market Revenue (Million) Forecast, by Application 2019 & 2032
- Table 18: Mexico Digital Genome Market Volume (K Unit) Forecast, by Application 2019 & 2032
- Table 19: Global Digital Genome Market Revenue Million Forecast, by Country 2019 & 2032
- Table 20: Global Digital Genome Market Volume K Unit Forecast, by Country 2019 & 2032
- Table 21: Germany Digital Genome Market Revenue (Million) Forecast, by Application 2019 & 2032
- Table 22: Germany Digital Genome Market Volume (K Unit) Forecast, by Application 2019 & 2032
- Table 23: United Kingdom Digital Genome Market Revenue (Million) Forecast, by Application 2019 & 2032
- Table 24: United Kingdom Digital Genome Market Volume (K Unit) Forecast, by Application 2019 & 2032
- Table 25: France Digital Genome Market Revenue (Million) Forecast, by Application 2019 & 2032
- Table 26: France Digital Genome Market Volume (K Unit) Forecast, by Application 2019 & 2032
- Table 27: Italy Digital Genome Market Revenue (Million) Forecast, by Application 2019 & 2032
- Table 28: Italy Digital Genome Market Volume (K Unit) Forecast, by Application 2019 & 2032
- Table 29: Spain Digital Genome Market Revenue (Million) Forecast, by Application 2019 & 2032
- Table 30: Spain Digital Genome Market Volume (K Unit) Forecast, by Application 2019 & 2032
- Table 31: Rest of Europe Digital Genome Market Revenue (Million) Forecast, by Application 2019 & 2032
- Table 32: Rest of Europe Digital Genome Market Volume (K Unit) Forecast, by Application 2019 & 2032
- Table 33: Global Digital Genome Market Revenue Million Forecast, by Country 2019 & 2032
- Table 34: Global Digital Genome Market Volume K Unit Forecast, by Country 2019 & 2032
- Table 35: China Digital Genome Market Revenue (Million) Forecast, by Application 2019 & 2032
- Table 36: China Digital Genome Market Volume (K Unit) Forecast, by Application 2019 & 2032
- Table 37: Japan Digital Genome Market Revenue (Million) Forecast, by Application 2019 & 2032
- Table 38: Japan Digital Genome Market Volume (K Unit) Forecast, by Application 2019 & 2032
- Table 39: India Digital Genome Market Revenue (Million) Forecast, by Application 2019 & 2032
- Table 40: India Digital Genome Market Volume (K Unit) Forecast, by Application 2019 & 2032
- Table 41: Australia Digital Genome Market Revenue (Million) Forecast, by Application 2019 & 2032
- Table 42: Australia Digital Genome Market Volume (K Unit) Forecast, by Application 2019 & 2032
- Table 43: South Korea Digital Genome Market Revenue (Million) Forecast, by Application 2019 & 2032
- Table 44: South Korea Digital Genome Market Volume (K Unit) Forecast, by Application 2019 & 2032
- Table 45: Rest of Asia Pacific Digital Genome Market Revenue (Million) Forecast, by Application 2019 & 2032
- Table 46: Rest of Asia Pacific Digital Genome Market Volume (K Unit) Forecast, by Application 2019 & 2032
- Table 47: Global Digital Genome Market Revenue Million Forecast, by Country 2019 & 2032
- Table 48: Global Digital Genome Market Volume K Unit Forecast, by Country 2019 & 2032
- Table 49: GCC Digital Genome Market Revenue (Million) Forecast, by Application 2019 & 2032
- Table 50: GCC Digital Genome Market Volume (K Unit) Forecast, by Application 2019 & 2032
- Table 51: South Africa Digital Genome Market Revenue (Million) Forecast, by Application 2019 & 2032
- Table 52: South Africa Digital Genome Market Volume (K Unit) Forecast, by Application 2019 & 2032
- Table 53: Rest of Middle East and Africa Digital Genome Market Revenue (Million) Forecast, by Application 2019 & 2032
- Table 54: Rest of Middle East and Africa Digital Genome Market Volume (K Unit) Forecast, by Application 2019 & 2032
- Table 55: Global Digital Genome Market Revenue Million Forecast, by Country 2019 & 2032
- Table 56: Global Digital Genome Market Volume K Unit Forecast, by Country 2019 & 2032
- Table 57: Brazil Digital Genome Market Revenue (Million) Forecast, by Application 2019 & 2032
- Table 58: Brazil Digital Genome Market Volume (K Unit) Forecast, by Application 2019 & 2032
- Table 59: Argentina Digital Genome Market Revenue (Million) Forecast, by Application 2019 & 2032
- Table 60: Argentina Digital Genome Market Volume (K Unit) Forecast, by Application 2019 & 2032
- Table 61: Rest of South America Digital Genome Market Revenue (Million) Forecast, by Application 2019 & 2032
- Table 62: Rest of South America Digital Genome Market Volume (K Unit) Forecast, by Application 2019 & 2032
- Table 63: Global Digital Genome Market Revenue Million Forecast, by Product 2019 & 2032
- Table 64: Global Digital Genome Market Volume K Unit Forecast, by Product 2019 & 2032
- Table 65: Global Digital Genome Market Revenue Million Forecast, by Application 2019 & 2032
- Table 66: Global Digital Genome Market Volume K Unit Forecast, by Application 2019 & 2032
- Table 67: Global Digital Genome Market Revenue Million Forecast, by End User 2019 & 2032
- Table 68: Global Digital Genome Market Volume K Unit Forecast, by End User 2019 & 2032
- Table 69: Global Digital Genome Market Revenue Million Forecast, by Country 2019 & 2032
- Table 70: Global Digital Genome Market Volume K Unit Forecast, by Country 2019 & 2032
- Table 71: United States Digital Genome Market Revenue (Million) Forecast, by Application 2019 & 2032
- Table 72: United States Digital Genome Market Volume (K Unit) Forecast, by Application 2019 & 2032
- Table 73: Canada Digital Genome Market Revenue (Million) Forecast, by Application 2019 & 2032
- Table 74: Canada Digital Genome Market Volume (K Unit) Forecast, by Application 2019 & 2032
- Table 75: Mexico Digital Genome Market Revenue (Million) Forecast, by Application 2019 & 2032
- Table 76: Mexico Digital Genome Market Volume (K Unit) Forecast, by Application 2019 & 2032
- Table 77: Global Digital Genome Market Revenue Million Forecast, by Product 2019 & 2032
- Table 78: Global Digital Genome Market Volume K Unit Forecast, by Product 2019 & 2032
- Table 79: Global Digital Genome Market Revenue Million Forecast, by Application 2019 & 2032
- Table 80: Global Digital Genome Market Volume K Unit Forecast, by Application 2019 & 2032
- Table 81: Global Digital Genome Market Revenue Million Forecast, by End User 2019 & 2032
- Table 82: Global Digital Genome Market Volume K Unit Forecast, by End User 2019 & 2032
- Table 83: Global Digital Genome Market Revenue Million Forecast, by Country 2019 & 2032
- Table 84: Global Digital Genome Market Volume K Unit Forecast, by Country 2019 & 2032
- Table 85: Germany Digital Genome Market Revenue (Million) Forecast, by Application 2019 & 2032
- Table 86: Germany Digital Genome Market Volume (K Unit) Forecast, by Application 2019 & 2032
- Table 87: United Kingdom Digital Genome Market Revenue (Million) Forecast, by Application 2019 & 2032
- Table 88: United Kingdom Digital Genome Market Volume (K Unit) Forecast, by Application 2019 & 2032
- Table 89: France Digital Genome Market Revenue (Million) Forecast, by Application 2019 & 2032
- Table 90: France Digital Genome Market Volume (K Unit) Forecast, by Application 2019 & 2032
- Table 91: Italy Digital Genome Market Revenue (Million) Forecast, by Application 2019 & 2032
- Table 92: Italy Digital Genome Market Volume (K Unit) Forecast, by Application 2019 & 2032
- Table 93: Spain Digital Genome Market Revenue (Million) Forecast, by Application 2019 & 2032
- Table 94: Spain Digital Genome Market Volume (K Unit) Forecast, by Application 2019 & 2032
- Table 95: Rest of Europe Digital Genome Market Revenue (Million) Forecast, by Application 2019 & 2032
- Table 96: Rest of Europe Digital Genome Market Volume (K Unit) Forecast, by Application 2019 & 2032
- Table 97: Global Digital Genome Market Revenue Million Forecast, by Product 2019 & 2032
- Table 98: Global Digital Genome Market Volume K Unit Forecast, by Product 2019 & 2032
- Table 99: Global Digital Genome Market Revenue Million Forecast, by Application 2019 & 2032
- Table 100: Global Digital Genome Market Volume K Unit Forecast, by Application 2019 & 2032
- Table 101: Global Digital Genome Market Revenue Million Forecast, by End User 2019 & 2032
- Table 102: Global Digital Genome Market Volume K Unit Forecast, by End User 2019 & 2032
- Table 103: Global Digital Genome Market Revenue Million Forecast, by Country 2019 & 2032
- Table 104: Global Digital Genome Market Volume K Unit Forecast, by Country 2019 & 2032
- Table 105: China Digital Genome Market Revenue (Million) Forecast, by Application 2019 & 2032
- Table 106: China Digital Genome Market Volume (K Unit) Forecast, by Application 2019 & 2032
- Table 107: Japan Digital Genome Market Revenue (Million) Forecast, by Application 2019 & 2032
- Table 108: Japan Digital Genome Market Volume (K Unit) Forecast, by Application 2019 & 2032
- Table 109: India Digital Genome Market Revenue (Million) Forecast, by Application 2019 & 2032
- Table 110: India Digital Genome Market Volume (K Unit) Forecast, by Application 2019 & 2032
- Table 111: Australia Digital Genome Market Revenue (Million) Forecast, by Application 2019 & 2032
- Table 112: Australia Digital Genome Market Volume (K Unit) Forecast, by Application 2019 & 2032
- Table 113: South Korea Digital Genome Market Revenue (Million) Forecast, by Application 2019 & 2032
- Table 114: South Korea Digital Genome Market Volume (K Unit) Forecast, by Application 2019 & 2032
- Table 115: Rest of Asia Pacific Digital Genome Market Revenue (Million) Forecast, by Application 2019 & 2032
- Table 116: Rest of Asia Pacific Digital Genome Market Volume (K Unit) Forecast, by Application 2019 & 2032
- Table 117: Global Digital Genome Market Revenue Million Forecast, by Product 2019 & 2032
- Table 118: Global Digital Genome Market Volume K Unit Forecast, by Product 2019 & 2032
- Table 119: Global Digital Genome Market Revenue Million Forecast, by Application 2019 & 2032
- Table 120: Global Digital Genome Market Volume K Unit Forecast, by Application 2019 & 2032
- Table 121: Global Digital Genome Market Revenue Million Forecast, by End User 2019 & 2032
- Table 122: Global Digital Genome Market Volume K Unit Forecast, by End User 2019 & 2032
- Table 123: Global Digital Genome Market Revenue Million Forecast, by Country 2019 & 2032
- Table 124: Global Digital Genome Market Volume K Unit Forecast, by Country 2019 & 2032
- Table 125: GCC Digital Genome Market Revenue (Million) Forecast, by Application 2019 & 2032
- Table 126: GCC Digital Genome Market Volume (K Unit) Forecast, by Application 2019 & 2032
- Table 127: South Africa Digital Genome Market Revenue (Million) Forecast, by Application 2019 & 2032
- Table 128: South Africa Digital Genome Market Volume (K Unit) Forecast, by Application 2019 & 2032
- Table 129: Rest of Middle East and Africa Digital Genome Market Revenue (Million) Forecast, by Application 2019 & 2032
- Table 130: Rest of Middle East and Africa Digital Genome Market Volume (K Unit) Forecast, by Application 2019 & 2032
- Table 131: Global Digital Genome Market Revenue Million Forecast, by Product 2019 & 2032
- Table 132: Global Digital Genome Market Volume K Unit Forecast, by Product 2019 & 2032
- Table 133: Global Digital Genome Market Revenue Million Forecast, by Application 2019 & 2032
- Table 134: Global Digital Genome Market Volume K Unit Forecast, by Application 2019 & 2032
- Table 135: Global Digital Genome Market Revenue Million Forecast, by End User 2019 & 2032
- Table 136: Global Digital Genome Market Volume K Unit Forecast, by End User 2019 & 2032
- Table 137: Global Digital Genome Market Revenue Million Forecast, by Country 2019 & 2032
- Table 138: Global Digital Genome Market Volume K Unit Forecast, by Country 2019 & 2032
- Table 139: Brazil Digital Genome Market Revenue (Million) Forecast, by Application 2019 & 2032
- Table 140: Brazil Digital Genome Market Volume (K Unit) Forecast, by Application 2019 & 2032
- Table 141: Argentina Digital Genome Market Revenue (Million) Forecast, by Application 2019 & 2032
- Table 142: Argentina Digital Genome Market Volume (K Unit) Forecast, by Application 2019 & 2032
- Table 143: Rest of South America Digital Genome Market Revenue (Million) Forecast, by Application 2019 & 2032
- Table 144: Rest of South America Digital Genome Market Volume (K Unit) Forecast, by Application 2019 & 2032
Frequently Asked Questions
1. What is the projected Compound Annual Growth Rate (CAGR) of the Digital Genome Market?
The projected CAGR is approximately 13.46%.
2. Which companies are prominent players in the Digital Genome Market?
Key companies in the market include Pacific Bioscience, Invitae Corporation, Illumina, GE Healthcare, Quest Diagnostics, Qiagen, Thermo Fisher Scientific, Inscripta Inc, PerkinElmer Inc, Agilent Technologies, NanoString Technologies Inc, GenMark Diagnostics Inc, bioMérieux.
3. What are the main segments of the Digital Genome Market?
The market segments include Product, Application, End User.
4. Can you provide details about the market size?
The market size is estimated to be USD 30.68 Million as of 2022.
5. What are some drivers contributing to market growth?
Increasing Technological Advancements. and Research and Development Pertaining to Digital Genome; Growing Adoption of Personalized Medicine; Constantly Evolving Disease Patterns.
6. What are the notable trends driving market growth?
Sequencing and Analysis Software Segment is Expected to Hold a Major Market Share in the Digital Genome Market Over the Forecast Period.
7. Are there any restraints impacting market growth?
High Capital Expenditure; Lack of Skilled Workforce.
8. Can you provide examples of recent developments in the market?
In May 2022, Gencove, one of the leading low-pass whole genome sequencing and analysis software companies, along with NEOGEN Corporation, launched the InfiniSEEK, a revolutionary, cost-effective solution for whole genome sequencing and targeted SNP analysis from two trusted leaders in genomics.
9. What pricing options are available for accessing the report?
Pricing options include single-user, multi-user, and enterprise licenses priced at USD 4750, USD 5250, and USD 8750 respectively.
10. Is the market size provided in terms of value or volume?
The market size is provided in terms of value, measured in Million and volume, measured in K Unit.
11. Are there any specific market keywords associated with the report?
Yes, the market keyword associated with the report is "Digital Genome Market," which aids in identifying and referencing the specific market segment covered.
12. How do I determine which pricing option suits my needs best?
The pricing options vary based on user requirements and access needs. Individual users may opt for single-user licenses, while businesses requiring broader access may choose multi-user or enterprise licenses for cost-effective access to the report.
13. Are there any additional resources or data provided in the Digital Genome Market report?
While the report offers comprehensive insights, it's advisable to review the specific contents or supplementary materials provided to ascertain if additional resources or data are available.
14. How can I stay updated on further developments or reports in the Digital Genome Market?
To stay informed about further developments, trends, and reports in the Digital Genome Market, consider subscribing to industry newsletters, following relevant companies and organizations, or regularly checking reputable industry news sources and publications.
Methodology
Step 1 - Identification of Relevant Samples Size from Population Database


Step 2 - Approaches for Defining Global Market Size (Value, Volume* & Price*)

Note*: In applicable scenarios
Step 3 - Data Sources
Primary Research
- Web Analytics
- Survey Reports
- Research Institute
- Latest Research Reports
- Opinion Leaders
Secondary Research
- Annual Reports
- White Paper
- Latest Press Release
- Industry Association
- Paid Database
- Investor Presentations

Step 4 - Data Triangulation
Involves using different sources of information in order to increase the validity of a study
These sources are likely to be stakeholders in a program - participants, other researchers, program staff, other community members, and so on.
Then we put all data in single framework & apply various statistical tools to find out the dynamic on the market.
During the analysis stage, feedback from the stakeholder groups would be compared to determine areas of agreement as well as areas of divergence


