
Key Insights
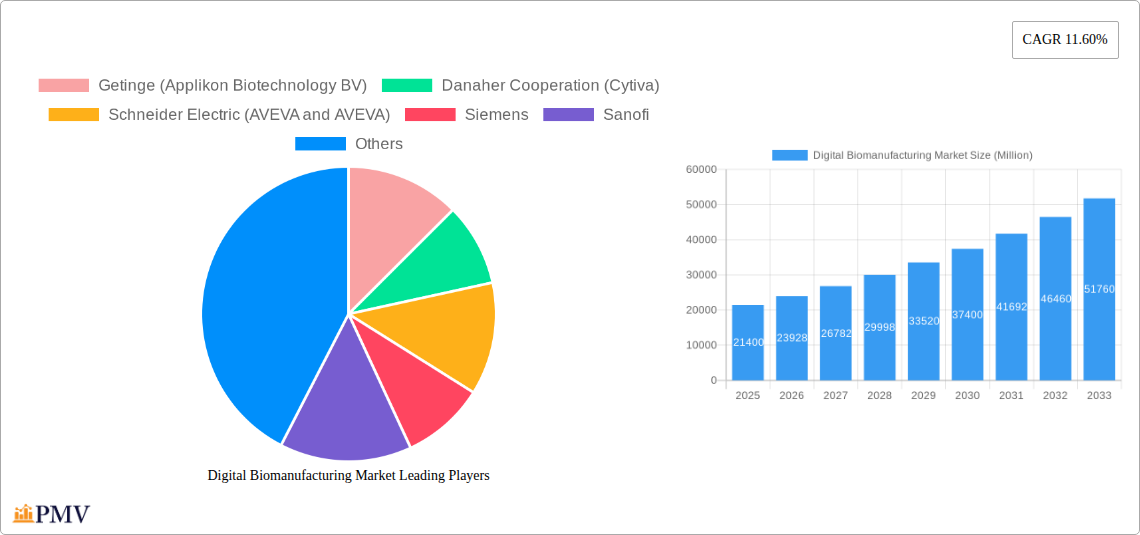
The digital biomanufacturing market, valued at $21.40 billion in 2025, is projected to experience robust growth, driven by the increasing adoption of advanced technologies such as artificial intelligence (AI), machine learning (ML), and automation in biopharmaceutical production. This surge is fueled by the need for enhanced efficiency, reduced production costs, improved product quality, and accelerated drug development timelines. Key drivers include the rising demand for biologics, personalized medicine, and cell and gene therapies, all of which rely heavily on efficient and precise biomanufacturing processes. Furthermore, regulatory pressures pushing for greater transparency and data traceability within manufacturing processes are significantly contributing to the market's expansion. Companies are actively investing in digital solutions to optimize their operations, resulting in a competitive landscape characterized by strategic partnerships and technological advancements. The market's segmentation likely includes software, hardware, and services, each experiencing unique growth trajectories based on their specific applications within the biomanufacturing process.
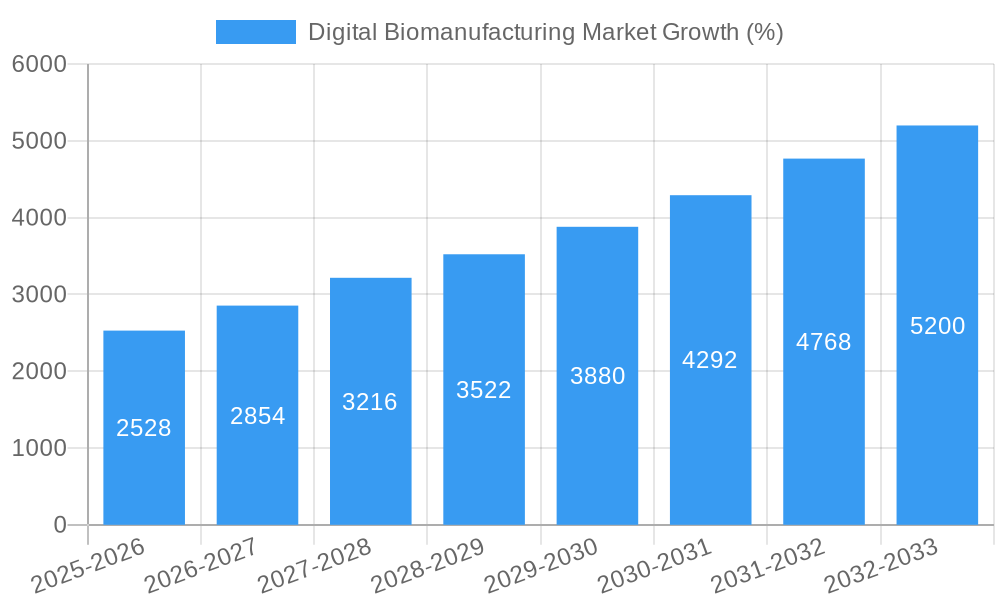
The market's compound annual growth rate (CAGR) of 11.60% from 2025 to 2033 indicates a substantial expansion over the forecast period. This growth is anticipated to be influenced by ongoing technological innovations, particularly in areas like process analytical technology (PAT), which provides real-time data for process optimization. The increasing adoption of cloud-based solutions for data management and analysis is another significant factor, enhancing collaboration and streamlining data accessibility across geographically dispersed teams. While challenges remain, such as the high initial investment costs associated with implementing digital solutions and the need for skilled workforce training, the long-term benefits of improved efficiency and reduced risks are expected to outweigh these hurdles, ensuring continued market expansion throughout the forecast period. Major players like Getinge, Danaher, and Siemens are actively shaping the market through their advanced offerings and strategic acquisitions.
Digital Biomanufacturing Market: A Comprehensive Report (2019-2033)
This in-depth report provides a comprehensive analysis of the Digital Biomanufacturing Market, encompassing market structure, competitive dynamics, industry trends, and future outlook. The study period covers 2019-2033, with 2025 as the base and estimated year, and a forecast period of 2025-2033. This report is crucial for stakeholders seeking to understand the current market landscape and strategize for future growth in this rapidly evolving sector. The market is projected to reach xx Million by 2033, exhibiting a CAGR of xx% during the forecast period.
Digital Biomanufacturing Market Market Structure & Competitive Dynamics
The Digital Biomanufacturing market is characterized by a moderately concentrated structure with several key players dominating the landscape. Market share analysis reveals that Danaher Corporation (Cytiva) and GE Healthcare hold significant positions, followed by Getinge (Applikon Biotechnology BV), Siemens, and Mettler Toledo. The market displays a dynamic competitive landscape marked by continuous innovation, strategic partnerships, and mergers & acquisitions (M&A). The total value of M&A deals in the last five years is estimated at xx Million. Regulatory frameworks, particularly those related to data security and compliance, significantly influence market dynamics. Product substitutes, such as traditional biomanufacturing methods, pose a competitive challenge, though the increasing adoption of digital technologies is mitigating this. End-user trends indicate a strong preference for integrated, automated solutions that enhance efficiency and reduce costs.
- Market Concentration: Moderate, with a few major players dominating.
- Innovation Ecosystems: Robust, with significant R&D investments and collaborations.
- Regulatory Frameworks: Stringent, impacting data security and compliance.
- Product Substitutes: Traditional biomanufacturing methods, but digital adoption is growing.
- End-User Trends: Preference for integrated, automated, and efficient solutions.
- M&A Activity: Significant activity in recent years, valued at xx Million.
Digital Biomanufacturing Market Industry Trends & Insights
The Digital Biomanufacturing market is experiencing robust growth, driven by several key factors. Technological advancements, such as the increasing adoption of artificial intelligence (AI), machine learning (ML), and advanced analytics, are significantly impacting the industry. This leads to improved process optimization, enhanced quality control, and reduced production costs. Consumer preferences are shifting towards personalized medicine and cell and gene therapies, which are heavily reliant on digital biomanufacturing technologies. The market penetration of digital solutions is steadily increasing, with a projected penetration rate of xx% by 2033. The overall market growth is primarily driven by rising demand for biologics, increased automation and digitalization needs, and advancements in data analytics capabilities.
- CAGR: xx% during the forecast period.
- Market Penetration: Projected to reach xx% by 2033.
- Growth Drivers: Technological advancements, demand for biologics, personalized medicine, automation needs.
- Competitive Dynamics: Intense competition, focused on innovation and strategic partnerships.
Dominant Markets & Segments in Digital Biomanufacturing Market
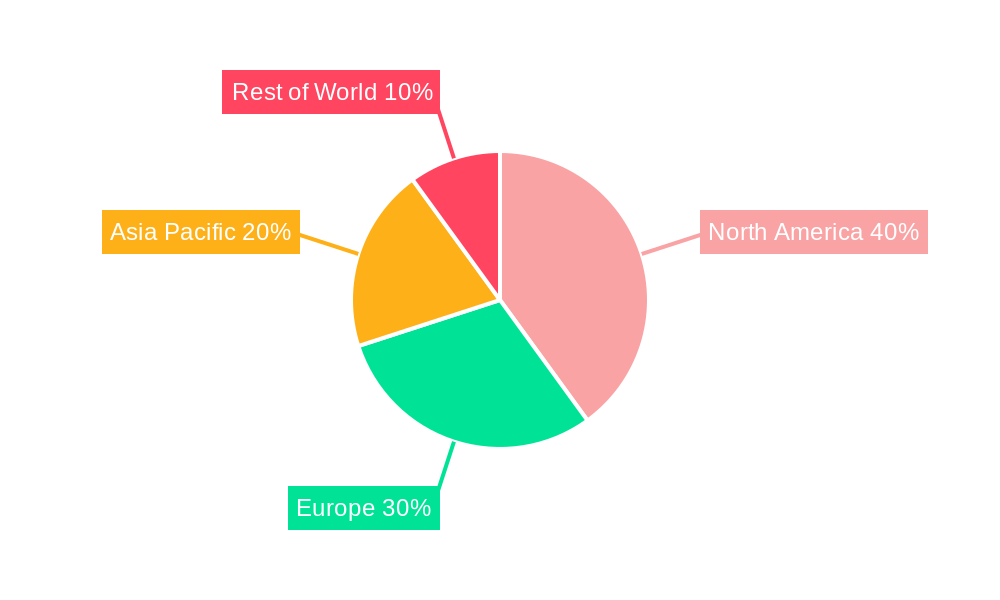
North America currently dominates the Digital Biomanufacturing market, driven by substantial investments in R&D, a well-established biopharmaceutical industry, and supportive regulatory environments. Europe follows closely, with significant growth potential in emerging economies like Asia-Pacific. Within segments, the process analytics segment holds a considerable market share owing to its importance in optimizing manufacturing processes.
- Leading Region: North America.
- Key Drivers (North America): Strong R&D investment, established biopharma industry, supportive regulatory frameworks.
- Dominant Segment: Process analytics.
- Growth Potential: Significant in Asia-Pacific.
Digital Biomanufacturing Market Product Innovations
Recent product developments emphasize modularity, integration, and automation to address the challenges in biopharmaceutical production. New platforms offer enhanced flexibility and scalability, enabling customized solutions for diverse applications. These innovations are designed to improve efficiency, reduce costs, and enhance data management capabilities, ultimately improving the quality and speed of biopharmaceutical production. The market shows a clear trend towards integrated, cloud-based solutions.
Report Segmentation & Scope
The Digital Biomanufacturing market is segmented by technology (sensors, software, automation), application (upstream, downstream processing), and end-user (pharmaceuticals, biotechnology). Each segment shows distinct growth trajectories. The software segment holds a significant market share, owing to its critical role in process control and data analysis. Upstream processing is expected to experience robust growth, driven by advancements in cell culture and fermentation technologies.
- By Technology: Sensors, software, automation.
- By Application: Upstream, downstream processing.
- By End-User: Pharmaceuticals, biotechnology.
Key Drivers of Digital Biomanufacturing Market Growth
Several factors propel the growth of the Digital Biomanufacturing market. Firstly, advancements in digital technologies, such as AI, ML, and IoT, are enhancing efficiency and data analytics in biomanufacturing processes. Secondly, the rising demand for biologics and personalized medicines fuels the need for advanced, scalable manufacturing solutions. Lastly, favorable regulatory environments supporting technological adoption contribute to market expansion.
Challenges in the Digital Biomanufacturing Market Sector
The Digital Biomanufacturing market faces challenges, including regulatory hurdles related to data security and compliance. Supply chain complexities, particularly securing specialized components, can impact production. Furthermore, high implementation costs and the need for skilled workforce can pose barriers to adoption.
Leading Players in the Digital Biomanufacturing Market Market
- Getinge (Applikon Biotechnology BV)
- Danaher Cooperation (Cytiva)
- Schneider Electric (AVEVA and AVEVA)
- Siemens
- Sanofi
- Mettler Toledo
- IDBS
- Aspen Technology Inc
- GE Healthcare
- List Not Exhaustive
Key Developments in Digital Biomanufacturing Market Sector
- June 2024: Syntegon's Pharmatec launched a new modular bioprocessing platform (MBP), enhancing flexibility and automation in biopharmaceutical production.
- March 2024: Novel Bio partnered with Culture Biosciences to accelerate the development of scalable fermentation processes for plasmid DNA production.
Strategic Digital Biomanufacturing Market Market Outlook
The Digital Biomanufacturing market exhibits significant future potential, driven by continued technological innovation, rising demand for biologics, and the expanding adoption of personalized medicine. Strategic opportunities lie in developing integrated solutions, enhancing data analytics capabilities, and expanding into emerging markets. The market is poised for robust growth, creating lucrative opportunities for both established players and new entrants.
Digital Biomanufacturing Market Segmentation
-
1. Type
- 1.1. Manufacturing Technologies
- 1.2. Analytical and Process Control Technologies
- 1.3. Other Types
-
2. Application
- 2.1. Bioprocess Optimization
- 2.2. Biomanufacturing Process Automation and Control
- 2.3. Other Applications
-
3. End User
- 3.1. Biopharmaceutical Companies
- 3.2. Contract Manufacturing Organizations
- 3.3. Research Institutes
Digital Biomanufacturing Market Segmentation By Geography
-
1. North America
- 1.1. United States
- 1.2. Canada
- 1.3. Mexico
-
2. Europe
- 2.1. Germany
- 2.2. United Kingdom
- 2.3. France
- 2.4. Italy
- 2.5. Spain
- 2.6. Rest of Europe
-
3. Asia Pacific
- 3.1. China
- 3.2. Japan
- 3.3. India
- 3.4. Australia
- 3.5. South Korea
- 3.6. Rest of Asia Pacific
-
4. Middle East and Africa
- 4.1. GCC
- 4.2. South Africa
- 4.3. Rest of Middle East and Africa
-
5. South America
- 5.1. Brazil
- 5.2. Argentina
- 5.3. Rest of South America
Digital Biomanufacturing Market REPORT HIGHLIGHTS
| Aspects | Details |
|---|---|
| Study Period | 2019-2033 |
| Base Year | 2024 |
| Estimated Year | 2025 |
| Forecast Period | 2025-2033 |
| Historical Period | 2019-2024 |
| Growth Rate | CAGR of 11.60% from 2019-2033 |
| Segmentation |
|
Table of Contents
- 1. Introduction
- 1.1. Research Scope
- 1.2. Market Segmentation
- 1.3. Research Methodology
- 1.4. Definitions and Assumptions
- 2. Executive Summary
- 2.1. Introduction
- 3. Market Dynamics
- 3.1. Introduction
- 3.2. Market Drivers
- 3.2.1. Growing Adoption of Digital Biomanufacturing; Increasing Biologics and Biosimilars Approvals
- 3.3. Market Restrains
- 3.3.1. Growing Adoption of Digital Biomanufacturing; Increasing Biologics and Biosimilars Approvals
- 3.4. Market Trends
- 3.4.1. The Process Analytical Technologies Segment is Expected to Show Significant Growth During the Forecast Period
- 4. Market Factor Analysis
- 4.1. Porters Five Forces
- 4.2. Supply/Value Chain
- 4.3. PESTEL analysis
- 4.4. Market Entropy
- 4.5. Patent/Trademark Analysis
- 5. Global Digital Biomanufacturing Market Analysis, Insights and Forecast, 2019-2031
- 5.1. Market Analysis, Insights and Forecast - by Type
- 5.1.1. Manufacturing Technologies
- 5.1.2. Analytical and Process Control Technologies
- 5.1.3. Other Types
- 5.2. Market Analysis, Insights and Forecast - by Application
- 5.2.1. Bioprocess Optimization
- 5.2.2. Biomanufacturing Process Automation and Control
- 5.2.3. Other Applications
- 5.3. Market Analysis, Insights and Forecast - by End User
- 5.3.1. Biopharmaceutical Companies
- 5.3.2. Contract Manufacturing Organizations
- 5.3.3. Research Institutes
- 5.4. Market Analysis, Insights and Forecast - by Region
- 5.4.1. North America
- 5.4.2. Europe
- 5.4.3. Asia Pacific
- 5.4.4. Middle East and Africa
- 5.4.5. South America
- 5.1. Market Analysis, Insights and Forecast - by Type
- 6. North America Digital Biomanufacturing Market Analysis, Insights and Forecast, 2019-2031
- 6.1. Market Analysis, Insights and Forecast - by Type
- 6.1.1. Manufacturing Technologies
- 6.1.2. Analytical and Process Control Technologies
- 6.1.3. Other Types
- 6.2. Market Analysis, Insights and Forecast - by Application
- 6.2.1. Bioprocess Optimization
- 6.2.2. Biomanufacturing Process Automation and Control
- 6.2.3. Other Applications
- 6.3. Market Analysis, Insights and Forecast - by End User
- 6.3.1. Biopharmaceutical Companies
- 6.3.2. Contract Manufacturing Organizations
- 6.3.3. Research Institutes
- 6.1. Market Analysis, Insights and Forecast - by Type
- 7. Europe Digital Biomanufacturing Market Analysis, Insights and Forecast, 2019-2031
- 7.1. Market Analysis, Insights and Forecast - by Type
- 7.1.1. Manufacturing Technologies
- 7.1.2. Analytical and Process Control Technologies
- 7.1.3. Other Types
- 7.2. Market Analysis, Insights and Forecast - by Application
- 7.2.1. Bioprocess Optimization
- 7.2.2. Biomanufacturing Process Automation and Control
- 7.2.3. Other Applications
- 7.3. Market Analysis, Insights and Forecast - by End User
- 7.3.1. Biopharmaceutical Companies
- 7.3.2. Contract Manufacturing Organizations
- 7.3.3. Research Institutes
- 7.1. Market Analysis, Insights and Forecast - by Type
- 8. Asia Pacific Digital Biomanufacturing Market Analysis, Insights and Forecast, 2019-2031
- 8.1. Market Analysis, Insights and Forecast - by Type
- 8.1.1. Manufacturing Technologies
- 8.1.2. Analytical and Process Control Technologies
- 8.1.3. Other Types
- 8.2. Market Analysis, Insights and Forecast - by Application
- 8.2.1. Bioprocess Optimization
- 8.2.2. Biomanufacturing Process Automation and Control
- 8.2.3. Other Applications
- 8.3. Market Analysis, Insights and Forecast - by End User
- 8.3.1. Biopharmaceutical Companies
- 8.3.2. Contract Manufacturing Organizations
- 8.3.3. Research Institutes
- 8.1. Market Analysis, Insights and Forecast - by Type
- 9. Middle East and Africa Digital Biomanufacturing Market Analysis, Insights and Forecast, 2019-2031
- 9.1. Market Analysis, Insights and Forecast - by Type
- 9.1.1. Manufacturing Technologies
- 9.1.2. Analytical and Process Control Technologies
- 9.1.3. Other Types
- 9.2. Market Analysis, Insights and Forecast - by Application
- 9.2.1. Bioprocess Optimization
- 9.2.2. Biomanufacturing Process Automation and Control
- 9.2.3. Other Applications
- 9.3. Market Analysis, Insights and Forecast - by End User
- 9.3.1. Biopharmaceutical Companies
- 9.3.2. Contract Manufacturing Organizations
- 9.3.3. Research Institutes
- 9.1. Market Analysis, Insights and Forecast - by Type
- 10. South America Digital Biomanufacturing Market Analysis, Insights and Forecast, 2019-2031
- 10.1. Market Analysis, Insights and Forecast - by Type
- 10.1.1. Manufacturing Technologies
- 10.1.2. Analytical and Process Control Technologies
- 10.1.3. Other Types
- 10.2. Market Analysis, Insights and Forecast - by Application
- 10.2.1. Bioprocess Optimization
- 10.2.2. Biomanufacturing Process Automation and Control
- 10.2.3. Other Applications
- 10.3. Market Analysis, Insights and Forecast - by End User
- 10.3.1. Biopharmaceutical Companies
- 10.3.2. Contract Manufacturing Organizations
- 10.3.3. Research Institutes
- 10.1. Market Analysis, Insights and Forecast - by Type
- 11. Competitive Analysis
- 11.1. Global Market Share Analysis 2024
- 11.2. Company Profiles
- 11.2.1 Getinge (Applikon Biotechnology BV)
- 11.2.1.1. Overview
- 11.2.1.2. Products
- 11.2.1.3. SWOT Analysis
- 11.2.1.4. Recent Developments
- 11.2.1.5. Financials (Based on Availability)
- 11.2.2 Danaher Cooperation (Cytiva)
- 11.2.2.1. Overview
- 11.2.2.2. Products
- 11.2.2.3. SWOT Analysis
- 11.2.2.4. Recent Developments
- 11.2.2.5. Financials (Based on Availability)
- 11.2.3 Schneider Electric (AVEVA and AVEVA)
- 11.2.3.1. Overview
- 11.2.3.2. Products
- 11.2.3.3. SWOT Analysis
- 11.2.3.4. Recent Developments
- 11.2.3.5. Financials (Based on Availability)
- 11.2.4 Siemens
- 11.2.4.1. Overview
- 11.2.4.2. Products
- 11.2.4.3. SWOT Analysis
- 11.2.4.4. Recent Developments
- 11.2.4.5. Financials (Based on Availability)
- 11.2.5 Sanofi
- 11.2.5.1. Overview
- 11.2.5.2. Products
- 11.2.5.3. SWOT Analysis
- 11.2.5.4. Recent Developments
- 11.2.5.5. Financials (Based on Availability)
- 11.2.6 Mettler Toledo
- 11.2.6.1. Overview
- 11.2.6.2. Products
- 11.2.6.3. SWOT Analysis
- 11.2.6.4. Recent Developments
- 11.2.6.5. Financials (Based on Availability)
- 11.2.7 IDBS
- 11.2.7.1. Overview
- 11.2.7.2. Products
- 11.2.7.3. SWOT Analysis
- 11.2.7.4. Recent Developments
- 11.2.7.5. Financials (Based on Availability)
- 11.2.8 Aspen Technology Inc
- 11.2.8.1. Overview
- 11.2.8.2. Products
- 11.2.8.3. SWOT Analysis
- 11.2.8.4. Recent Developments
- 11.2.8.5. Financials (Based on Availability)
- 11.2.9 GE Healthcare*List Not Exhaustive
- 11.2.9.1. Overview
- 11.2.9.2. Products
- 11.2.9.3. SWOT Analysis
- 11.2.9.4. Recent Developments
- 11.2.9.5. Financials (Based on Availability)
- 11.2.1 Getinge (Applikon Biotechnology BV)
List of Figures
- Figure 1: Global Digital Biomanufacturing Market Revenue Breakdown (Million, %) by Region 2024 & 2032
- Figure 2: Global Digital Biomanufacturing Market Volume Breakdown (Billion, %) by Region 2024 & 2032
- Figure 3: North America Digital Biomanufacturing Market Revenue (Million), by Type 2024 & 2032
- Figure 4: North America Digital Biomanufacturing Market Volume (Billion), by Type 2024 & 2032
- Figure 5: North America Digital Biomanufacturing Market Revenue Share (%), by Type 2024 & 2032
- Figure 6: North America Digital Biomanufacturing Market Volume Share (%), by Type 2024 & 2032
- Figure 7: North America Digital Biomanufacturing Market Revenue (Million), by Application 2024 & 2032
- Figure 8: North America Digital Biomanufacturing Market Volume (Billion), by Application 2024 & 2032
- Figure 9: North America Digital Biomanufacturing Market Revenue Share (%), by Application 2024 & 2032
- Figure 10: North America Digital Biomanufacturing Market Volume Share (%), by Application 2024 & 2032
- Figure 11: North America Digital Biomanufacturing Market Revenue (Million), by End User 2024 & 2032
- Figure 12: North America Digital Biomanufacturing Market Volume (Billion), by End User 2024 & 2032
- Figure 13: North America Digital Biomanufacturing Market Revenue Share (%), by End User 2024 & 2032
- Figure 14: North America Digital Biomanufacturing Market Volume Share (%), by End User 2024 & 2032
- Figure 15: North America Digital Biomanufacturing Market Revenue (Million), by Country 2024 & 2032
- Figure 16: North America Digital Biomanufacturing Market Volume (Billion), by Country 2024 & 2032
- Figure 17: North America Digital Biomanufacturing Market Revenue Share (%), by Country 2024 & 2032
- Figure 18: North America Digital Biomanufacturing Market Volume Share (%), by Country 2024 & 2032
- Figure 19: Europe Digital Biomanufacturing Market Revenue (Million), by Type 2024 & 2032
- Figure 20: Europe Digital Biomanufacturing Market Volume (Billion), by Type 2024 & 2032
- Figure 21: Europe Digital Biomanufacturing Market Revenue Share (%), by Type 2024 & 2032
- Figure 22: Europe Digital Biomanufacturing Market Volume Share (%), by Type 2024 & 2032
- Figure 23: Europe Digital Biomanufacturing Market Revenue (Million), by Application 2024 & 2032
- Figure 24: Europe Digital Biomanufacturing Market Volume (Billion), by Application 2024 & 2032
- Figure 25: Europe Digital Biomanufacturing Market Revenue Share (%), by Application 2024 & 2032
- Figure 26: Europe Digital Biomanufacturing Market Volume Share (%), by Application 2024 & 2032
- Figure 27: Europe Digital Biomanufacturing Market Revenue (Million), by End User 2024 & 2032
- Figure 28: Europe Digital Biomanufacturing Market Volume (Billion), by End User 2024 & 2032
- Figure 29: Europe Digital Biomanufacturing Market Revenue Share (%), by End User 2024 & 2032
- Figure 30: Europe Digital Biomanufacturing Market Volume Share (%), by End User 2024 & 2032
- Figure 31: Europe Digital Biomanufacturing Market Revenue (Million), by Country 2024 & 2032
- Figure 32: Europe Digital Biomanufacturing Market Volume (Billion), by Country 2024 & 2032
- Figure 33: Europe Digital Biomanufacturing Market Revenue Share (%), by Country 2024 & 2032
- Figure 34: Europe Digital Biomanufacturing Market Volume Share (%), by Country 2024 & 2032
- Figure 35: Asia Pacific Digital Biomanufacturing Market Revenue (Million), by Type 2024 & 2032
- Figure 36: Asia Pacific Digital Biomanufacturing Market Volume (Billion), by Type 2024 & 2032
- Figure 37: Asia Pacific Digital Biomanufacturing Market Revenue Share (%), by Type 2024 & 2032
- Figure 38: Asia Pacific Digital Biomanufacturing Market Volume Share (%), by Type 2024 & 2032
- Figure 39: Asia Pacific Digital Biomanufacturing Market Revenue (Million), by Application 2024 & 2032
- Figure 40: Asia Pacific Digital Biomanufacturing Market Volume (Billion), by Application 2024 & 2032
- Figure 41: Asia Pacific Digital Biomanufacturing Market Revenue Share (%), by Application 2024 & 2032
- Figure 42: Asia Pacific Digital Biomanufacturing Market Volume Share (%), by Application 2024 & 2032
- Figure 43: Asia Pacific Digital Biomanufacturing Market Revenue (Million), by End User 2024 & 2032
- Figure 44: Asia Pacific Digital Biomanufacturing Market Volume (Billion), by End User 2024 & 2032
- Figure 45: Asia Pacific Digital Biomanufacturing Market Revenue Share (%), by End User 2024 & 2032
- Figure 46: Asia Pacific Digital Biomanufacturing Market Volume Share (%), by End User 2024 & 2032
- Figure 47: Asia Pacific Digital Biomanufacturing Market Revenue (Million), by Country 2024 & 2032
- Figure 48: Asia Pacific Digital Biomanufacturing Market Volume (Billion), by Country 2024 & 2032
- Figure 49: Asia Pacific Digital Biomanufacturing Market Revenue Share (%), by Country 2024 & 2032
- Figure 50: Asia Pacific Digital Biomanufacturing Market Volume Share (%), by Country 2024 & 2032
- Figure 51: Middle East and Africa Digital Biomanufacturing Market Revenue (Million), by Type 2024 & 2032
- Figure 52: Middle East and Africa Digital Biomanufacturing Market Volume (Billion), by Type 2024 & 2032
- Figure 53: Middle East and Africa Digital Biomanufacturing Market Revenue Share (%), by Type 2024 & 2032
- Figure 54: Middle East and Africa Digital Biomanufacturing Market Volume Share (%), by Type 2024 & 2032
- Figure 55: Middle East and Africa Digital Biomanufacturing Market Revenue (Million), by Application 2024 & 2032
- Figure 56: Middle East and Africa Digital Biomanufacturing Market Volume (Billion), by Application 2024 & 2032
- Figure 57: Middle East and Africa Digital Biomanufacturing Market Revenue Share (%), by Application 2024 & 2032
- Figure 58: Middle East and Africa Digital Biomanufacturing Market Volume Share (%), by Application 2024 & 2032
- Figure 59: Middle East and Africa Digital Biomanufacturing Market Revenue (Million), by End User 2024 & 2032
- Figure 60: Middle East and Africa Digital Biomanufacturing Market Volume (Billion), by End User 2024 & 2032
- Figure 61: Middle East and Africa Digital Biomanufacturing Market Revenue Share (%), by End User 2024 & 2032
- Figure 62: Middle East and Africa Digital Biomanufacturing Market Volume Share (%), by End User 2024 & 2032
- Figure 63: Middle East and Africa Digital Biomanufacturing Market Revenue (Million), by Country 2024 & 2032
- Figure 64: Middle East and Africa Digital Biomanufacturing Market Volume (Billion), by Country 2024 & 2032
- Figure 65: Middle East and Africa Digital Biomanufacturing Market Revenue Share (%), by Country 2024 & 2032
- Figure 66: Middle East and Africa Digital Biomanufacturing Market Volume Share (%), by Country 2024 & 2032
- Figure 67: South America Digital Biomanufacturing Market Revenue (Million), by Type 2024 & 2032
- Figure 68: South America Digital Biomanufacturing Market Volume (Billion), by Type 2024 & 2032
- Figure 69: South America Digital Biomanufacturing Market Revenue Share (%), by Type 2024 & 2032
- Figure 70: South America Digital Biomanufacturing Market Volume Share (%), by Type 2024 & 2032
- Figure 71: South America Digital Biomanufacturing Market Revenue (Million), by Application 2024 & 2032
- Figure 72: South America Digital Biomanufacturing Market Volume (Billion), by Application 2024 & 2032
- Figure 73: South America Digital Biomanufacturing Market Revenue Share (%), by Application 2024 & 2032
- Figure 74: South America Digital Biomanufacturing Market Volume Share (%), by Application 2024 & 2032
- Figure 75: South America Digital Biomanufacturing Market Revenue (Million), by End User 2024 & 2032
- Figure 76: South America Digital Biomanufacturing Market Volume (Billion), by End User 2024 & 2032
- Figure 77: South America Digital Biomanufacturing Market Revenue Share (%), by End User 2024 & 2032
- Figure 78: South America Digital Biomanufacturing Market Volume Share (%), by End User 2024 & 2032
- Figure 79: South America Digital Biomanufacturing Market Revenue (Million), by Country 2024 & 2032
- Figure 80: South America Digital Biomanufacturing Market Volume (Billion), by Country 2024 & 2032
- Figure 81: South America Digital Biomanufacturing Market Revenue Share (%), by Country 2024 & 2032
- Figure 82: South America Digital Biomanufacturing Market Volume Share (%), by Country 2024 & 2032
List of Tables
- Table 1: Global Digital Biomanufacturing Market Revenue Million Forecast, by Region 2019 & 2032
- Table 2: Global Digital Biomanufacturing Market Volume Billion Forecast, by Region 2019 & 2032
- Table 3: Global Digital Biomanufacturing Market Revenue Million Forecast, by Type 2019 & 2032
- Table 4: Global Digital Biomanufacturing Market Volume Billion Forecast, by Type 2019 & 2032
- Table 5: Global Digital Biomanufacturing Market Revenue Million Forecast, by Application 2019 & 2032
- Table 6: Global Digital Biomanufacturing Market Volume Billion Forecast, by Application 2019 & 2032
- Table 7: Global Digital Biomanufacturing Market Revenue Million Forecast, by End User 2019 & 2032
- Table 8: Global Digital Biomanufacturing Market Volume Billion Forecast, by End User 2019 & 2032
- Table 9: Global Digital Biomanufacturing Market Revenue Million Forecast, by Region 2019 & 2032
- Table 10: Global Digital Biomanufacturing Market Volume Billion Forecast, by Region 2019 & 2032
- Table 11: Global Digital Biomanufacturing Market Revenue Million Forecast, by Type 2019 & 2032
- Table 12: Global Digital Biomanufacturing Market Volume Billion Forecast, by Type 2019 & 2032
- Table 13: Global Digital Biomanufacturing Market Revenue Million Forecast, by Application 2019 & 2032
- Table 14: Global Digital Biomanufacturing Market Volume Billion Forecast, by Application 2019 & 2032
- Table 15: Global Digital Biomanufacturing Market Revenue Million Forecast, by End User 2019 & 2032
- Table 16: Global Digital Biomanufacturing Market Volume Billion Forecast, by End User 2019 & 2032
- Table 17: Global Digital Biomanufacturing Market Revenue Million Forecast, by Country 2019 & 2032
- Table 18: Global Digital Biomanufacturing Market Volume Billion Forecast, by Country 2019 & 2032
- Table 19: United States Digital Biomanufacturing Market Revenue (Million) Forecast, by Application 2019 & 2032
- Table 20: United States Digital Biomanufacturing Market Volume (Billion) Forecast, by Application 2019 & 2032
- Table 21: Canada Digital Biomanufacturing Market Revenue (Million) Forecast, by Application 2019 & 2032
- Table 22: Canada Digital Biomanufacturing Market Volume (Billion) Forecast, by Application 2019 & 2032
- Table 23: Mexico Digital Biomanufacturing Market Revenue (Million) Forecast, by Application 2019 & 2032
- Table 24: Mexico Digital Biomanufacturing Market Volume (Billion) Forecast, by Application 2019 & 2032
- Table 25: Global Digital Biomanufacturing Market Revenue Million Forecast, by Type 2019 & 2032
- Table 26: Global Digital Biomanufacturing Market Volume Billion Forecast, by Type 2019 & 2032
- Table 27: Global Digital Biomanufacturing Market Revenue Million Forecast, by Application 2019 & 2032
- Table 28: Global Digital Biomanufacturing Market Volume Billion Forecast, by Application 2019 & 2032
- Table 29: Global Digital Biomanufacturing Market Revenue Million Forecast, by End User 2019 & 2032
- Table 30: Global Digital Biomanufacturing Market Volume Billion Forecast, by End User 2019 & 2032
- Table 31: Global Digital Biomanufacturing Market Revenue Million Forecast, by Country 2019 & 2032
- Table 32: Global Digital Biomanufacturing Market Volume Billion Forecast, by Country 2019 & 2032
- Table 33: Germany Digital Biomanufacturing Market Revenue (Million) Forecast, by Application 2019 & 2032
- Table 34: Germany Digital Biomanufacturing Market Volume (Billion) Forecast, by Application 2019 & 2032
- Table 35: United Kingdom Digital Biomanufacturing Market Revenue (Million) Forecast, by Application 2019 & 2032
- Table 36: United Kingdom Digital Biomanufacturing Market Volume (Billion) Forecast, by Application 2019 & 2032
- Table 37: France Digital Biomanufacturing Market Revenue (Million) Forecast, by Application 2019 & 2032
- Table 38: France Digital Biomanufacturing Market Volume (Billion) Forecast, by Application 2019 & 2032
- Table 39: Italy Digital Biomanufacturing Market Revenue (Million) Forecast, by Application 2019 & 2032
- Table 40: Italy Digital Biomanufacturing Market Volume (Billion) Forecast, by Application 2019 & 2032
- Table 41: Spain Digital Biomanufacturing Market Revenue (Million) Forecast, by Application 2019 & 2032
- Table 42: Spain Digital Biomanufacturing Market Volume (Billion) Forecast, by Application 2019 & 2032
- Table 43: Rest of Europe Digital Biomanufacturing Market Revenue (Million) Forecast, by Application 2019 & 2032
- Table 44: Rest of Europe Digital Biomanufacturing Market Volume (Billion) Forecast, by Application 2019 & 2032
- Table 45: Global Digital Biomanufacturing Market Revenue Million Forecast, by Type 2019 & 2032
- Table 46: Global Digital Biomanufacturing Market Volume Billion Forecast, by Type 2019 & 2032
- Table 47: Global Digital Biomanufacturing Market Revenue Million Forecast, by Application 2019 & 2032
- Table 48: Global Digital Biomanufacturing Market Volume Billion Forecast, by Application 2019 & 2032
- Table 49: Global Digital Biomanufacturing Market Revenue Million Forecast, by End User 2019 & 2032
- Table 50: Global Digital Biomanufacturing Market Volume Billion Forecast, by End User 2019 & 2032
- Table 51: Global Digital Biomanufacturing Market Revenue Million Forecast, by Country 2019 & 2032
- Table 52: Global Digital Biomanufacturing Market Volume Billion Forecast, by Country 2019 & 2032
- Table 53: China Digital Biomanufacturing Market Revenue (Million) Forecast, by Application 2019 & 2032
- Table 54: China Digital Biomanufacturing Market Volume (Billion) Forecast, by Application 2019 & 2032
- Table 55: Japan Digital Biomanufacturing Market Revenue (Million) Forecast, by Application 2019 & 2032
- Table 56: Japan Digital Biomanufacturing Market Volume (Billion) Forecast, by Application 2019 & 2032
- Table 57: India Digital Biomanufacturing Market Revenue (Million) Forecast, by Application 2019 & 2032
- Table 58: India Digital Biomanufacturing Market Volume (Billion) Forecast, by Application 2019 & 2032
- Table 59: Australia Digital Biomanufacturing Market Revenue (Million) Forecast, by Application 2019 & 2032
- Table 60: Australia Digital Biomanufacturing Market Volume (Billion) Forecast, by Application 2019 & 2032
- Table 61: South Korea Digital Biomanufacturing Market Revenue (Million) Forecast, by Application 2019 & 2032
- Table 62: South Korea Digital Biomanufacturing Market Volume (Billion) Forecast, by Application 2019 & 2032
- Table 63: Rest of Asia Pacific Digital Biomanufacturing Market Revenue (Million) Forecast, by Application 2019 & 2032
- Table 64: Rest of Asia Pacific Digital Biomanufacturing Market Volume (Billion) Forecast, by Application 2019 & 2032
- Table 65: Global Digital Biomanufacturing Market Revenue Million Forecast, by Type 2019 & 2032
- Table 66: Global Digital Biomanufacturing Market Volume Billion Forecast, by Type 2019 & 2032
- Table 67: Global Digital Biomanufacturing Market Revenue Million Forecast, by Application 2019 & 2032
- Table 68: Global Digital Biomanufacturing Market Volume Billion Forecast, by Application 2019 & 2032
- Table 69: Global Digital Biomanufacturing Market Revenue Million Forecast, by End User 2019 & 2032
- Table 70: Global Digital Biomanufacturing Market Volume Billion Forecast, by End User 2019 & 2032
- Table 71: Global Digital Biomanufacturing Market Revenue Million Forecast, by Country 2019 & 2032
- Table 72: Global Digital Biomanufacturing Market Volume Billion Forecast, by Country 2019 & 2032
- Table 73: GCC Digital Biomanufacturing Market Revenue (Million) Forecast, by Application 2019 & 2032
- Table 74: GCC Digital Biomanufacturing Market Volume (Billion) Forecast, by Application 2019 & 2032
- Table 75: South Africa Digital Biomanufacturing Market Revenue (Million) Forecast, by Application 2019 & 2032
- Table 76: South Africa Digital Biomanufacturing Market Volume (Billion) Forecast, by Application 2019 & 2032
- Table 77: Rest of Middle East and Africa Digital Biomanufacturing Market Revenue (Million) Forecast, by Application 2019 & 2032
- Table 78: Rest of Middle East and Africa Digital Biomanufacturing Market Volume (Billion) Forecast, by Application 2019 & 2032
- Table 79: Global Digital Biomanufacturing Market Revenue Million Forecast, by Type 2019 & 2032
- Table 80: Global Digital Biomanufacturing Market Volume Billion Forecast, by Type 2019 & 2032
- Table 81: Global Digital Biomanufacturing Market Revenue Million Forecast, by Application 2019 & 2032
- Table 82: Global Digital Biomanufacturing Market Volume Billion Forecast, by Application 2019 & 2032
- Table 83: Global Digital Biomanufacturing Market Revenue Million Forecast, by End User 2019 & 2032
- Table 84: Global Digital Biomanufacturing Market Volume Billion Forecast, by End User 2019 & 2032
- Table 85: Global Digital Biomanufacturing Market Revenue Million Forecast, by Country 2019 & 2032
- Table 86: Global Digital Biomanufacturing Market Volume Billion Forecast, by Country 2019 & 2032
- Table 87: Brazil Digital Biomanufacturing Market Revenue (Million) Forecast, by Application 2019 & 2032
- Table 88: Brazil Digital Biomanufacturing Market Volume (Billion) Forecast, by Application 2019 & 2032
- Table 89: Argentina Digital Biomanufacturing Market Revenue (Million) Forecast, by Application 2019 & 2032
- Table 90: Argentina Digital Biomanufacturing Market Volume (Billion) Forecast, by Application 2019 & 2032
- Table 91: Rest of South America Digital Biomanufacturing Market Revenue (Million) Forecast, by Application 2019 & 2032
- Table 92: Rest of South America Digital Biomanufacturing Market Volume (Billion) Forecast, by Application 2019 & 2032
Frequently Asked Questions
1. What is the projected Compound Annual Growth Rate (CAGR) of the Digital Biomanufacturing Market?
The projected CAGR is approximately 11.60%.
2. Which companies are prominent players in the Digital Biomanufacturing Market?
Key companies in the market include Getinge (Applikon Biotechnology BV), Danaher Cooperation (Cytiva), Schneider Electric (AVEVA and AVEVA), Siemens, Sanofi, Mettler Toledo, IDBS, Aspen Technology Inc, GE Healthcare*List Not Exhaustive.
3. What are the main segments of the Digital Biomanufacturing Market?
The market segments include Type, Application, End User.
4. Can you provide details about the market size?
The market size is estimated to be USD 21.40 Million as of 2022.
5. What are some drivers contributing to market growth?
Growing Adoption of Digital Biomanufacturing; Increasing Biologics and Biosimilars Approvals.
6. What are the notable trends driving market growth?
The Process Analytical Technologies Segment is Expected to Show Significant Growth During the Forecast Period.
7. Are there any restraints impacting market growth?
Growing Adoption of Digital Biomanufacturing; Increasing Biologics and Biosimilars Approvals.
8. Can you provide examples of recent developments in the market?
June 2024: The Syntegon subsidiary Pharmatec reported the launch of its new modular bioprocessing platform (MBP). Developed to address the current challenges in biopharmaceutical production, the MBP is a highly flexible, fully digitally integrated, and automated solution for biological drug substances.
9. What pricing options are available for accessing the report?
Pricing options include single-user, multi-user, and enterprise licenses priced at USD 4750, USD 5250, and USD 8750 respectively.
10. Is the market size provided in terms of value or volume?
The market size is provided in terms of value, measured in Million and volume, measured in Billion.
11. Are there any specific market keywords associated with the report?
Yes, the market keyword associated with the report is "Digital Biomanufacturing Market," which aids in identifying and referencing the specific market segment covered.
12. How do I determine which pricing option suits my needs best?
The pricing options vary based on user requirements and access needs. Individual users may opt for single-user licenses, while businesses requiring broader access may choose multi-user or enterprise licenses for cost-effective access to the report.
13. Are there any additional resources or data provided in the Digital Biomanufacturing Market report?
While the report offers comprehensive insights, it's advisable to review the specific contents or supplementary materials provided to ascertain if additional resources or data are available.
14. How can I stay updated on further developments or reports in the Digital Biomanufacturing Market?
To stay informed about further developments, trends, and reports in the Digital Biomanufacturing Market, consider subscribing to industry newsletters, following relevant companies and organizations, or regularly checking reputable industry news sources and publications.
Methodology
Step 1 - Identification of Relevant Samples Size from Population Database


Step 2 - Approaches for Defining Global Market Size (Value, Volume* & Price*)

Note*: In applicable scenarios
Step 3 - Data Sources
Primary Research
- Web Analytics
- Survey Reports
- Research Institute
- Latest Research Reports
- Opinion Leaders
Secondary Research
- Annual Reports
- White Paper
- Latest Press Release
- Industry Association
- Paid Database
- Investor Presentations

Step 4 - Data Triangulation
Involves using different sources of information in order to increase the validity of a study
These sources are likely to be stakeholders in a program - participants, other researchers, program staff, other community members, and so on.
Then we put all data in single framework & apply various statistical tools to find out the dynamic on the market.
During the analysis stage, feedback from the stakeholder groups would be compared to determine areas of agreement as well as areas of divergence


