
Key Insights
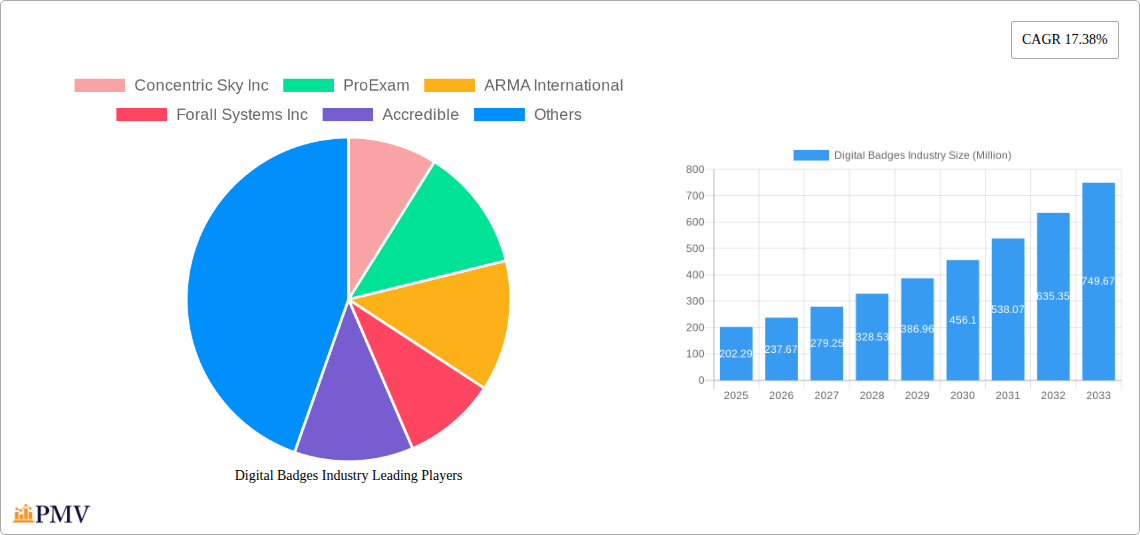
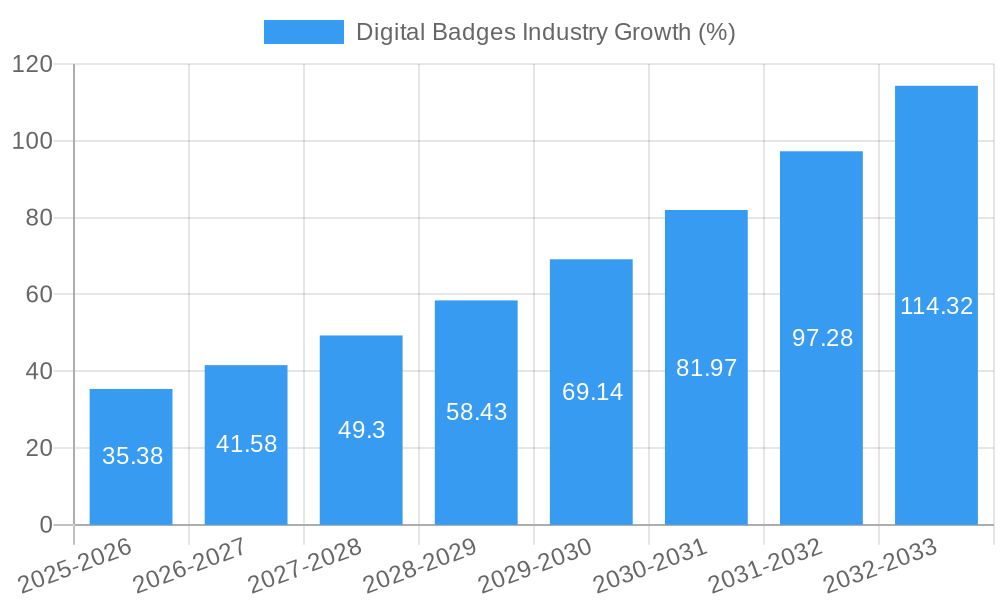
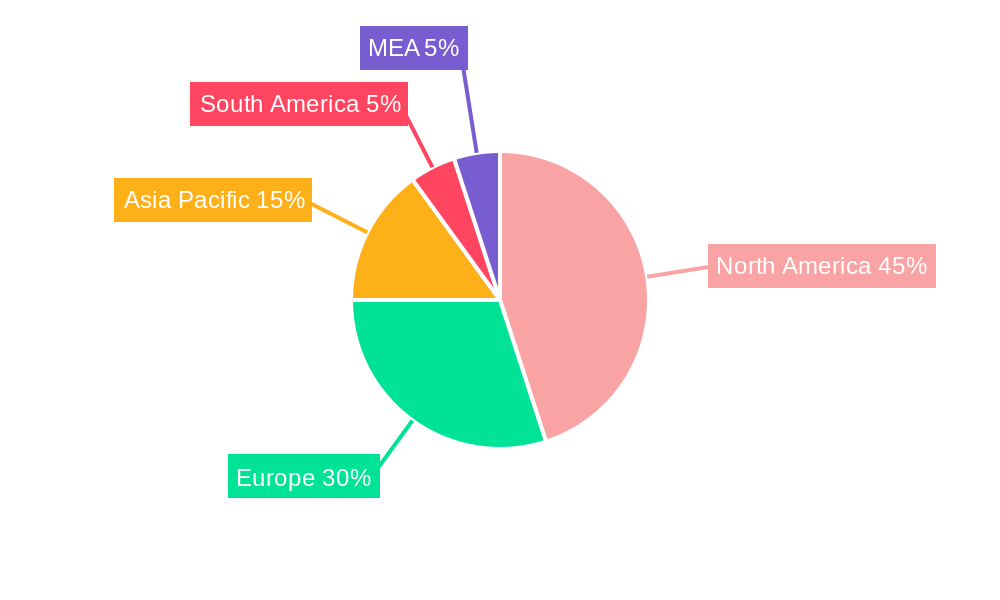
The digital badges market is experiencing robust growth, projected to reach \$202.29 million in 2025 and exhibiting a Compound Annual Growth Rate (CAGR) of 17.38%. This expansion is fueled by several key factors. The increasing adoption of online learning and the need for verifiable skills validation are primary drivers. Businesses are leveraging digital badges to enhance employee training programs, showcasing skills and achievements, and streamlining recruitment processes. Academic institutions are incorporating digital badges into their curricula, providing students with easily shareable credentials that highlight their competencies. Furthermore, the ongoing development of innovative badge platforms and the increasing integration with learning management systems (LMS) are contributing to market growth. The growing awareness of the benefits of micro-credentials and the increasing demand for lifelong learning further bolster market expansion. The market is segmented by end-user (academic and corporate) and geographically, with North America currently holding a significant market share due to early adoption and technological advancements. However, rapid growth is expected in Asia Pacific and other regions as digital literacy and awareness improve. While some challenges exist related to standardization and interoperability, the overall market outlook for digital badges remains extremely positive, driven by continuous technological innovation and a growing demand for flexible, verifiable credentials.
The competitive landscape is dynamic, featuring both established players and innovative startups. Companies like Concentric Sky Inc, ProExam, ARMA International, and Accredible are leading the way in providing digital badging solutions and platforms. The market is witnessing increased strategic partnerships and mergers and acquisitions, as companies seek to expand their market reach and enhance their product offerings. Further growth will likely be driven by the increasing integration of blockchain technology for enhanced security and transparency, and the rise of open badge standards to promote interoperability among different platforms. The continuing evolution of the digital badge market indicates a promising future for this technology as a key component in the future of learning, credentialing, and professional development.
This comprehensive report provides an in-depth analysis of the global Digital Badges Industry, offering valuable insights into market dynamics, competitive landscape, and future growth prospects. Covering the period 2019-2033, with a focus on 2025, this report is essential for businesses, investors, and stakeholders seeking to understand and navigate this rapidly evolving sector. The market is projected to reach xx Million by 2033.
Digital Badges Industry Market Structure & Competitive Dynamics
The Digital Badges Industry exhibits a moderately concentrated market structure, with several key players vying for market share. The industry is characterized by a dynamic innovation ecosystem, driven by advancements in technology, such as blockchain and AI, which enhance the security and verification of digital badges. Regulatory frameworks, while still evolving, are increasingly impacting the issuance and recognition of digital credentials. Product substitutes, such as traditional certificates and transcripts, continue to exist, but digital badges offer advantages in terms of accessibility, cost-effectiveness, and verifiable authenticity. End-user trends show a growing preference for digital credentials, particularly amongst younger generations and in sectors prioritizing skills-based hiring. M&A activity in the sector has been moderate, with deal values averaging xx Million in recent years. Key players are actively consolidating to expand their reach and capabilities. Market share data indicates that Concentric Sky Inc , ProExam, and ARMA International are among the leading companies, though exact market share percentages vary and are difficult to definitively determine due to the decentralized nature of the sector.
- Market Concentration: Moderately concentrated, with several dominant players.
- Innovation: Rapid advancements in blockchain and AI technology driving innovation.
- Regulatory Landscape: Evolving regulatory frameworks are influencing industry practices.
- M&A Activity: Moderate activity with deal values averaging xx Million. This trend is expected to continue to increase as the industry matures.
Digital Badges Industry Industry Trends & Insights
The Digital Badges Industry is experiencing significant growth, driven by the increasing demand for verifiable skills and credentials in the digital age. The Compound Annual Growth Rate (CAGR) during the forecast period (2025-2033) is projected to be xx%, reflecting a strong market expansion. The market penetration rate is expected to reach xx% by 2033, indicating substantial adoption across diverse sectors. Technological advancements, including blockchain-based verification and integration with learning management systems (LMS), are significantly improving the efficiency, security, and accessibility of digital badges. Consumer preferences are shifting towards convenient, portable, and verifiable credentials, further fueling market demand. The rise of skills-based hiring and the emphasis on lifelong learning are significant drivers of growth. Competitive dynamics are marked by product differentiation, innovation in badge design and functionality, and strategic partnerships.
Dominant Markets & Segments in Digital Badges Industry
The corporate segment currently dominates the Digital Badges Industry, driven by the increasing need for efficient and verifiable employee training and skills assessment. The academic segment is also experiencing significant growth, driven by increasing competition for higher education admission and growing needs for standardized skill verification in higher education.
Key Drivers for Corporate Dominance:
- Skills-based hiring: Growing emphasis on skills-based assessments and talent management.
- Employee training and development: Increased investment in corporate training programs.
- Enhanced employee engagement and motivation: Recognition of employees' achievements and professional development.
Key Drivers for Academic Growth:
- Standardization of credentials: Addressing concerns over the verification and portability of academic achievements.
- Lifelong learning: Growing focus on skills development and upskilling in higher education.
- Internationalization of education: Enhanced recognition and portability of international credentials.
The United States is currently the leading region, with a significant share of the market. This is primarily due to the high adoption rate in corporate and academic sectors, combined with robust technological infrastructure and favorable regulatory environment.
Digital Badges Industry Product Innovations
Recent product innovations focus on improving the user experience, enhancing security features, and integrating with existing learning management systems (LMS). The industry is seeing a move toward more dynamic and interactive badges, leveraging technologies like NFTs to improve authenticity and portability. These developments align with market trends toward more personalized and skill-based credentialing.
Report Segmentation & Scope
The report segments the market by end-user:
Academic: This segment encompasses the use of digital badges in higher education institutions, including universities, colleges, and vocational schools. Growth in this segment is driven by the need for standardized credentials and the increasing adoption of online learning platforms. Market size is projected to reach xx Million by 2033.
Corporate: This segment includes the use of digital badges in corporate training programs, talent management initiatives, and internal recognition schemes. Growth is driven by the rising demand for skills-based hiring and the focus on employee development. Market size is estimated to reach xx Million by 2033.
Competitive dynamics within each segment vary, with some players specializing in academic solutions and others focusing on corporate applications.
Key Drivers of Digital Badges Industry Growth
The rapid growth of the Digital Badges Industry is fueled by several key factors:
- Technological advancements: Blockchain technology ensures increased security and transparency.
- Rise of online learning: Increased adoption of online learning platforms necessitates the need for digital credentials.
- Skills-based hiring: Growing importance of skills-based hiring drives demand for verifiable credentials.
- Government initiatives: Government programs and initiatives encourage the use of digital badges for skills development.
Challenges in the Digital Badges Industry Sector
Despite significant growth, several challenges impede the widespread adoption of digital badges:
- Lack of standardization: Inconsistent standards across different issuing organizations and platforms.
- Interoperability issues: Difficulties in integrating digital badges with different systems.
- Security concerns: Concerns about data privacy and security of digital credentials. These issues affect roughly xx% of the market.
Leading Players in the Digital Badges Industry Market
- Concentric Sky Inc
- ProExam
- ARMA International
- Forall Systems Inc
- Accredible
- Badgecraft
- Skillsoft Corporation
- Portfolium Inc
- AXELOS
- Credly Inc
- International Institute of Business Analysis
Key Developments in Digital Badges Industry Sector
- June 2023: Skilljar's partnership with Accredible streamlines the integration of training content with credentialing programs, enhancing the learner experience and market value of credentials.
- January 2023: The launch of the 'MY5G Ericsson Malaysia Pioneers Programme' provides free online academic programs on 5G and digital technology, issuing digital badges to participants. This initiative boosts digital skills development and demonstrates the potential of digital badges in education.
Strategic Digital Badges Industry Market Outlook
The future of the Digital Badges Industry appears bright, with continued growth driven by technological advancements, increasing demand for skills-based hiring, and the growing acceptance of digital credentials. Strategic opportunities exist in developing innovative badge designs, improving interoperability across different platforms, and focusing on niche markets. Expanding into emerging economies and integrating digital badges with other emerging technologies, such as the metaverse, represent further growth potential. The market is expected to show sustained growth through 2033, driven by these factors.
Digital Badges Industry Segmentation
-
1. End-user
- 1.1. Academic
- 1.2. Corporate
Digital Badges Industry Segmentation By Geography
- 1. North America
- 2. Europe
- 3. Asia Pacific
- 4. Rest of the World
Digital Badges Industry REPORT HIGHLIGHTS
| Aspects | Details |
|---|---|
| Study Period | 2019-2033 |
| Base Year | 2024 |
| Estimated Year | 2025 |
| Forecast Period | 2025-2033 |
| Historical Period | 2019-2024 |
| Growth Rate | CAGR of 17.38% from 2019-2033 |
| Segmentation |
|
Table of Contents
- 1. Introduction
- 1.1. Research Scope
- 1.2. Market Segmentation
- 1.3. Research Methodology
- 1.4. Definitions and Assumptions
- 2. Executive Summary
- 2.1. Introduction
- 3. Market Dynamics
- 3.1. Introduction
- 3.2. Market Drivers
- 3.2.1. Increasing Focus on Online Learning
- 3.3. Market Restrains
- 3.3.1. Lack of IT Infrastructure in Developing Regions
- 3.4. Market Trends
- 3.4.1. Academic Segment to Occupy a Significant Market Share
- 4. Market Factor Analysis
- 4.1. Porters Five Forces
- 4.2. Supply/Value Chain
- 4.3. PESTEL analysis
- 4.4. Market Entropy
- 4.5. Patent/Trademark Analysis
- 5. Global Digital Badges Industry Analysis, Insights and Forecast, 2019-2031
- 5.1. Market Analysis, Insights and Forecast - by End-user
- 5.1.1. Academic
- 5.1.2. Corporate
- 5.2. Market Analysis, Insights and Forecast - by Region
- 5.2.1. North America
- 5.2.2. Europe
- 5.2.3. Asia Pacific
- 5.2.4. Rest of the World
- 5.1. Market Analysis, Insights and Forecast - by End-user
- 6. North America Digital Badges Industry Analysis, Insights and Forecast, 2019-2031
- 6.1. Market Analysis, Insights and Forecast - by End-user
- 6.1.1. Academic
- 6.1.2. Corporate
- 6.1. Market Analysis, Insights and Forecast - by End-user
- 7. Europe Digital Badges Industry Analysis, Insights and Forecast, 2019-2031
- 7.1. Market Analysis, Insights and Forecast - by End-user
- 7.1.1. Academic
- 7.1.2. Corporate
- 7.1. Market Analysis, Insights and Forecast - by End-user
- 8. Asia Pacific Digital Badges Industry Analysis, Insights and Forecast, 2019-2031
- 8.1. Market Analysis, Insights and Forecast - by End-user
- 8.1.1. Academic
- 8.1.2. Corporate
- 8.1. Market Analysis, Insights and Forecast - by End-user
- 9. Rest of the World Digital Badges Industry Analysis, Insights and Forecast, 2019-2031
- 9.1. Market Analysis, Insights and Forecast - by End-user
- 9.1.1. Academic
- 9.1.2. Corporate
- 9.1. Market Analysis, Insights and Forecast - by End-user
- 10. North America Digital Badges Industry Analysis, Insights and Forecast, 2019-2031
- 10.1. Market Analysis, Insights and Forecast - By Country/Sub-region
- 10.1.1 United States
- 10.1.2 Canada
- 10.1.3 Mexico
- 11. Europe Digital Badges Industry Analysis, Insights and Forecast, 2019-2031
- 11.1. Market Analysis, Insights and Forecast - By Country/Sub-region
- 11.1.1 Germany
- 11.1.2 United Kingdom
- 11.1.3 France
- 11.1.4 Spain
- 11.1.5 Italy
- 11.1.6 Spain
- 11.1.7 Belgium
- 11.1.8 Netherland
- 11.1.9 Nordics
- 11.1.10 Rest of Europe
- 12. Asia Pacific Digital Badges Industry Analysis, Insights and Forecast, 2019-2031
- 12.1. Market Analysis, Insights and Forecast - By Country/Sub-region
- 12.1.1 China
- 12.1.2 Japan
- 12.1.3 India
- 12.1.4 South Korea
- 12.1.5 Southeast Asia
- 12.1.6 Australia
- 12.1.7 Indonesia
- 12.1.8 Phillipes
- 12.1.9 Singapore
- 12.1.10 Thailandc
- 12.1.11 Rest of Asia Pacific
- 13. South America Digital Badges Industry Analysis, Insights and Forecast, 2019-2031
- 13.1. Market Analysis, Insights and Forecast - By Country/Sub-region
- 13.1.1 Brazil
- 13.1.2 Argentina
- 13.1.3 Peru
- 13.1.4 Chile
- 13.1.5 Colombia
- 13.1.6 Ecuador
- 13.1.7 Venezuela
- 13.1.8 Rest of South America
- 14. North America Digital Badges Industry Analysis, Insights and Forecast, 2019-2031
- 14.1. Market Analysis, Insights and Forecast - By Country/Sub-region
- 14.1.1 United States
- 14.1.2 Canada
- 14.1.3 Mexico
- 15. MEA Digital Badges Industry Analysis, Insights and Forecast, 2019-2031
- 15.1. Market Analysis, Insights and Forecast - By Country/Sub-region
- 15.1.1 United Arab Emirates
- 15.1.2 Saudi Arabia
- 15.1.3 South Africa
- 15.1.4 Rest of Middle East and Africa
- 16. Competitive Analysis
- 16.1. Global Market Share Analysis 2024
- 16.2. Company Profiles
- 16.2.1 Concentric Sky Inc
- 16.2.1.1. Overview
- 16.2.1.2. Products
- 16.2.1.3. SWOT Analysis
- 16.2.1.4. Recent Developments
- 16.2.1.5. Financials (Based on Availability)
- 16.2.2 ProExam
- 16.2.2.1. Overview
- 16.2.2.2. Products
- 16.2.2.3. SWOT Analysis
- 16.2.2.4. Recent Developments
- 16.2.2.5. Financials (Based on Availability)
- 16.2.3 ARMA International
- 16.2.3.1. Overview
- 16.2.3.2. Products
- 16.2.3.3. SWOT Analysis
- 16.2.3.4. Recent Developments
- 16.2.3.5. Financials (Based on Availability)
- 16.2.4 Forall Systems Inc
- 16.2.4.1. Overview
- 16.2.4.2. Products
- 16.2.4.3. SWOT Analysis
- 16.2.4.4. Recent Developments
- 16.2.4.5. Financials (Based on Availability)
- 16.2.5 Accredible
- 16.2.5.1. Overview
- 16.2.5.2. Products
- 16.2.5.3. SWOT Analysis
- 16.2.5.4. Recent Developments
- 16.2.5.5. Financials (Based on Availability)
- 16.2.6 Badgecraf
- 16.2.6.1. Overview
- 16.2.6.2. Products
- 16.2.6.3. SWOT Analysis
- 16.2.6.4. Recent Developments
- 16.2.6.5. Financials (Based on Availability)
- 16.2.7 Skillsoft Corporation
- 16.2.7.1. Overview
- 16.2.7.2. Products
- 16.2.7.3. SWOT Analysis
- 16.2.7.4. Recent Developments
- 16.2.7.5. Financials (Based on Availability)
- 16.2.8 Portfolium Inc
- 16.2.8.1. Overview
- 16.2.8.2. Products
- 16.2.8.3. SWOT Analysis
- 16.2.8.4. Recent Developments
- 16.2.8.5. Financials (Based on Availability)
- 16.2.9 AXELOS
- 16.2.9.1. Overview
- 16.2.9.2. Products
- 16.2.9.3. SWOT Analysis
- 16.2.9.4. Recent Developments
- 16.2.9.5. Financials (Based on Availability)
- 16.2.10 Credly Inc
- 16.2.10.1. Overview
- 16.2.10.2. Products
- 16.2.10.3. SWOT Analysis
- 16.2.10.4. Recent Developments
- 16.2.10.5. Financials (Based on Availability)
- 16.2.11 International Institute of Business Analysis
- 16.2.11.1. Overview
- 16.2.11.2. Products
- 16.2.11.3. SWOT Analysis
- 16.2.11.4. Recent Developments
- 16.2.11.5. Financials (Based on Availability)
- 16.2.1 Concentric Sky Inc
List of Figures
- Figure 1: Global Digital Badges Industry Revenue Breakdown (Million, %) by Region 2024 & 2032
- Figure 2: Global Digital Badges Industry Volume Breakdown (K Unit, %) by Region 2024 & 2032
- Figure 3: North America Digital Badges Industry Revenue (Million), by Country 2024 & 2032
- Figure 4: North America Digital Badges Industry Volume (K Unit), by Country 2024 & 2032
- Figure 5: North America Digital Badges Industry Revenue Share (%), by Country 2024 & 2032
- Figure 6: North America Digital Badges Industry Volume Share (%), by Country 2024 & 2032
- Figure 7: Europe Digital Badges Industry Revenue (Million), by Country 2024 & 2032
- Figure 8: Europe Digital Badges Industry Volume (K Unit), by Country 2024 & 2032
- Figure 9: Europe Digital Badges Industry Revenue Share (%), by Country 2024 & 2032
- Figure 10: Europe Digital Badges Industry Volume Share (%), by Country 2024 & 2032
- Figure 11: Asia Pacific Digital Badges Industry Revenue (Million), by Country 2024 & 2032
- Figure 12: Asia Pacific Digital Badges Industry Volume (K Unit), by Country 2024 & 2032
- Figure 13: Asia Pacific Digital Badges Industry Revenue Share (%), by Country 2024 & 2032
- Figure 14: Asia Pacific Digital Badges Industry Volume Share (%), by Country 2024 & 2032
- Figure 15: South America Digital Badges Industry Revenue (Million), by Country 2024 & 2032
- Figure 16: South America Digital Badges Industry Volume (K Unit), by Country 2024 & 2032
- Figure 17: South America Digital Badges Industry Revenue Share (%), by Country 2024 & 2032
- Figure 18: South America Digital Badges Industry Volume Share (%), by Country 2024 & 2032
- Figure 19: North America Digital Badges Industry Revenue (Million), by Country 2024 & 2032
- Figure 20: North America Digital Badges Industry Volume (K Unit), by Country 2024 & 2032
- Figure 21: North America Digital Badges Industry Revenue Share (%), by Country 2024 & 2032
- Figure 22: North America Digital Badges Industry Volume Share (%), by Country 2024 & 2032
- Figure 23: MEA Digital Badges Industry Revenue (Million), by Country 2024 & 2032
- Figure 24: MEA Digital Badges Industry Volume (K Unit), by Country 2024 & 2032
- Figure 25: MEA Digital Badges Industry Revenue Share (%), by Country 2024 & 2032
- Figure 26: MEA Digital Badges Industry Volume Share (%), by Country 2024 & 2032
- Figure 27: North America Digital Badges Industry Revenue (Million), by End-user 2024 & 2032
- Figure 28: North America Digital Badges Industry Volume (K Unit), by End-user 2024 & 2032
- Figure 29: North America Digital Badges Industry Revenue Share (%), by End-user 2024 & 2032
- Figure 30: North America Digital Badges Industry Volume Share (%), by End-user 2024 & 2032
- Figure 31: North America Digital Badges Industry Revenue (Million), by Country 2024 & 2032
- Figure 32: North America Digital Badges Industry Volume (K Unit), by Country 2024 & 2032
- Figure 33: North America Digital Badges Industry Revenue Share (%), by Country 2024 & 2032
- Figure 34: North America Digital Badges Industry Volume Share (%), by Country 2024 & 2032
- Figure 35: Europe Digital Badges Industry Revenue (Million), by End-user 2024 & 2032
- Figure 36: Europe Digital Badges Industry Volume (K Unit), by End-user 2024 & 2032
- Figure 37: Europe Digital Badges Industry Revenue Share (%), by End-user 2024 & 2032
- Figure 38: Europe Digital Badges Industry Volume Share (%), by End-user 2024 & 2032
- Figure 39: Europe Digital Badges Industry Revenue (Million), by Country 2024 & 2032
- Figure 40: Europe Digital Badges Industry Volume (K Unit), by Country 2024 & 2032
- Figure 41: Europe Digital Badges Industry Revenue Share (%), by Country 2024 & 2032
- Figure 42: Europe Digital Badges Industry Volume Share (%), by Country 2024 & 2032
- Figure 43: Asia Pacific Digital Badges Industry Revenue (Million), by End-user 2024 & 2032
- Figure 44: Asia Pacific Digital Badges Industry Volume (K Unit), by End-user 2024 & 2032
- Figure 45: Asia Pacific Digital Badges Industry Revenue Share (%), by End-user 2024 & 2032
- Figure 46: Asia Pacific Digital Badges Industry Volume Share (%), by End-user 2024 & 2032
- Figure 47: Asia Pacific Digital Badges Industry Revenue (Million), by Country 2024 & 2032
- Figure 48: Asia Pacific Digital Badges Industry Volume (K Unit), by Country 2024 & 2032
- Figure 49: Asia Pacific Digital Badges Industry Revenue Share (%), by Country 2024 & 2032
- Figure 50: Asia Pacific Digital Badges Industry Volume Share (%), by Country 2024 & 2032
- Figure 51: Rest of the World Digital Badges Industry Revenue (Million), by End-user 2024 & 2032
- Figure 52: Rest of the World Digital Badges Industry Volume (K Unit), by End-user 2024 & 2032
- Figure 53: Rest of the World Digital Badges Industry Revenue Share (%), by End-user 2024 & 2032
- Figure 54: Rest of the World Digital Badges Industry Volume Share (%), by End-user 2024 & 2032
- Figure 55: Rest of the World Digital Badges Industry Revenue (Million), by Country 2024 & 2032
- Figure 56: Rest of the World Digital Badges Industry Volume (K Unit), by Country 2024 & 2032
- Figure 57: Rest of the World Digital Badges Industry Revenue Share (%), by Country 2024 & 2032
- Figure 58: Rest of the World Digital Badges Industry Volume Share (%), by Country 2024 & 2032
List of Tables
- Table 1: Global Digital Badges Industry Revenue Million Forecast, by Region 2019 & 2032
- Table 2: Global Digital Badges Industry Volume K Unit Forecast, by Region 2019 & 2032
- Table 3: Global Digital Badges Industry Revenue Million Forecast, by End-user 2019 & 2032
- Table 4: Global Digital Badges Industry Volume K Unit Forecast, by End-user 2019 & 2032
- Table 5: Global Digital Badges Industry Revenue Million Forecast, by Region 2019 & 2032
- Table 6: Global Digital Badges Industry Volume K Unit Forecast, by Region 2019 & 2032
- Table 7: Global Digital Badges Industry Revenue Million Forecast, by Country 2019 & 2032
- Table 8: Global Digital Badges Industry Volume K Unit Forecast, by Country 2019 & 2032
- Table 9: United States Digital Badges Industry Revenue (Million) Forecast, by Application 2019 & 2032
- Table 10: United States Digital Badges Industry Volume (K Unit) Forecast, by Application 2019 & 2032
- Table 11: Canada Digital Badges Industry Revenue (Million) Forecast, by Application 2019 & 2032
- Table 12: Canada Digital Badges Industry Volume (K Unit) Forecast, by Application 2019 & 2032
- Table 13: Mexico Digital Badges Industry Revenue (Million) Forecast, by Application 2019 & 2032
- Table 14: Mexico Digital Badges Industry Volume (K Unit) Forecast, by Application 2019 & 2032
- Table 15: Global Digital Badges Industry Revenue Million Forecast, by Country 2019 & 2032
- Table 16: Global Digital Badges Industry Volume K Unit Forecast, by Country 2019 & 2032
- Table 17: Germany Digital Badges Industry Revenue (Million) Forecast, by Application 2019 & 2032
- Table 18: Germany Digital Badges Industry Volume (K Unit) Forecast, by Application 2019 & 2032
- Table 19: United Kingdom Digital Badges Industry Revenue (Million) Forecast, by Application 2019 & 2032
- Table 20: United Kingdom Digital Badges Industry Volume (K Unit) Forecast, by Application 2019 & 2032
- Table 21: France Digital Badges Industry Revenue (Million) Forecast, by Application 2019 & 2032
- Table 22: France Digital Badges Industry Volume (K Unit) Forecast, by Application 2019 & 2032
- Table 23: Spain Digital Badges Industry Revenue (Million) Forecast, by Application 2019 & 2032
- Table 24: Spain Digital Badges Industry Volume (K Unit) Forecast, by Application 2019 & 2032
- Table 25: Italy Digital Badges Industry Revenue (Million) Forecast, by Application 2019 & 2032
- Table 26: Italy Digital Badges Industry Volume (K Unit) Forecast, by Application 2019 & 2032
- Table 27: Spain Digital Badges Industry Revenue (Million) Forecast, by Application 2019 & 2032
- Table 28: Spain Digital Badges Industry Volume (K Unit) Forecast, by Application 2019 & 2032
- Table 29: Belgium Digital Badges Industry Revenue (Million) Forecast, by Application 2019 & 2032
- Table 30: Belgium Digital Badges Industry Volume (K Unit) Forecast, by Application 2019 & 2032
- Table 31: Netherland Digital Badges Industry Revenue (Million) Forecast, by Application 2019 & 2032
- Table 32: Netherland Digital Badges Industry Volume (K Unit) Forecast, by Application 2019 & 2032
- Table 33: Nordics Digital Badges Industry Revenue (Million) Forecast, by Application 2019 & 2032
- Table 34: Nordics Digital Badges Industry Volume (K Unit) Forecast, by Application 2019 & 2032
- Table 35: Rest of Europe Digital Badges Industry Revenue (Million) Forecast, by Application 2019 & 2032
- Table 36: Rest of Europe Digital Badges Industry Volume (K Unit) Forecast, by Application 2019 & 2032
- Table 37: Global Digital Badges Industry Revenue Million Forecast, by Country 2019 & 2032
- Table 38: Global Digital Badges Industry Volume K Unit Forecast, by Country 2019 & 2032
- Table 39: China Digital Badges Industry Revenue (Million) Forecast, by Application 2019 & 2032
- Table 40: China Digital Badges Industry Volume (K Unit) Forecast, by Application 2019 & 2032
- Table 41: Japan Digital Badges Industry Revenue (Million) Forecast, by Application 2019 & 2032
- Table 42: Japan Digital Badges Industry Volume (K Unit) Forecast, by Application 2019 & 2032
- Table 43: India Digital Badges Industry Revenue (Million) Forecast, by Application 2019 & 2032
- Table 44: India Digital Badges Industry Volume (K Unit) Forecast, by Application 2019 & 2032
- Table 45: South Korea Digital Badges Industry Revenue (Million) Forecast, by Application 2019 & 2032
- Table 46: South Korea Digital Badges Industry Volume (K Unit) Forecast, by Application 2019 & 2032
- Table 47: Southeast Asia Digital Badges Industry Revenue (Million) Forecast, by Application 2019 & 2032
- Table 48: Southeast Asia Digital Badges Industry Volume (K Unit) Forecast, by Application 2019 & 2032
- Table 49: Australia Digital Badges Industry Revenue (Million) Forecast, by Application 2019 & 2032
- Table 50: Australia Digital Badges Industry Volume (K Unit) Forecast, by Application 2019 & 2032
- Table 51: Indonesia Digital Badges Industry Revenue (Million) Forecast, by Application 2019 & 2032
- Table 52: Indonesia Digital Badges Industry Volume (K Unit) Forecast, by Application 2019 & 2032
- Table 53: Phillipes Digital Badges Industry Revenue (Million) Forecast, by Application 2019 & 2032
- Table 54: Phillipes Digital Badges Industry Volume (K Unit) Forecast, by Application 2019 & 2032
- Table 55: Singapore Digital Badges Industry Revenue (Million) Forecast, by Application 2019 & 2032
- Table 56: Singapore Digital Badges Industry Volume (K Unit) Forecast, by Application 2019 & 2032
- Table 57: Thailandc Digital Badges Industry Revenue (Million) Forecast, by Application 2019 & 2032
- Table 58: Thailandc Digital Badges Industry Volume (K Unit) Forecast, by Application 2019 & 2032
- Table 59: Rest of Asia Pacific Digital Badges Industry Revenue (Million) Forecast, by Application 2019 & 2032
- Table 60: Rest of Asia Pacific Digital Badges Industry Volume (K Unit) Forecast, by Application 2019 & 2032
- Table 61: Global Digital Badges Industry Revenue Million Forecast, by Country 2019 & 2032
- Table 62: Global Digital Badges Industry Volume K Unit Forecast, by Country 2019 & 2032
- Table 63: Brazil Digital Badges Industry Revenue (Million) Forecast, by Application 2019 & 2032
- Table 64: Brazil Digital Badges Industry Volume (K Unit) Forecast, by Application 2019 & 2032
- Table 65: Argentina Digital Badges Industry Revenue (Million) Forecast, by Application 2019 & 2032
- Table 66: Argentina Digital Badges Industry Volume (K Unit) Forecast, by Application 2019 & 2032
- Table 67: Peru Digital Badges Industry Revenue (Million) Forecast, by Application 2019 & 2032
- Table 68: Peru Digital Badges Industry Volume (K Unit) Forecast, by Application 2019 & 2032
- Table 69: Chile Digital Badges Industry Revenue (Million) Forecast, by Application 2019 & 2032
- Table 70: Chile Digital Badges Industry Volume (K Unit) Forecast, by Application 2019 & 2032
- Table 71: Colombia Digital Badges Industry Revenue (Million) Forecast, by Application 2019 & 2032
- Table 72: Colombia Digital Badges Industry Volume (K Unit) Forecast, by Application 2019 & 2032
- Table 73: Ecuador Digital Badges Industry Revenue (Million) Forecast, by Application 2019 & 2032
- Table 74: Ecuador Digital Badges Industry Volume (K Unit) Forecast, by Application 2019 & 2032
- Table 75: Venezuela Digital Badges Industry Revenue (Million) Forecast, by Application 2019 & 2032
- Table 76: Venezuela Digital Badges Industry Volume (K Unit) Forecast, by Application 2019 & 2032
- Table 77: Rest of South America Digital Badges Industry Revenue (Million) Forecast, by Application 2019 & 2032
- Table 78: Rest of South America Digital Badges Industry Volume (K Unit) Forecast, by Application 2019 & 2032
- Table 79: Global Digital Badges Industry Revenue Million Forecast, by Country 2019 & 2032
- Table 80: Global Digital Badges Industry Volume K Unit Forecast, by Country 2019 & 2032
- Table 81: United States Digital Badges Industry Revenue (Million) Forecast, by Application 2019 & 2032
- Table 82: United States Digital Badges Industry Volume (K Unit) Forecast, by Application 2019 & 2032
- Table 83: Canada Digital Badges Industry Revenue (Million) Forecast, by Application 2019 & 2032
- Table 84: Canada Digital Badges Industry Volume (K Unit) Forecast, by Application 2019 & 2032
- Table 85: Mexico Digital Badges Industry Revenue (Million) Forecast, by Application 2019 & 2032
- Table 86: Mexico Digital Badges Industry Volume (K Unit) Forecast, by Application 2019 & 2032
- Table 87: Global Digital Badges Industry Revenue Million Forecast, by Country 2019 & 2032
- Table 88: Global Digital Badges Industry Volume K Unit Forecast, by Country 2019 & 2032
- Table 89: United Arab Emirates Digital Badges Industry Revenue (Million) Forecast, by Application 2019 & 2032
- Table 90: United Arab Emirates Digital Badges Industry Volume (K Unit) Forecast, by Application 2019 & 2032
- Table 91: Saudi Arabia Digital Badges Industry Revenue (Million) Forecast, by Application 2019 & 2032
- Table 92: Saudi Arabia Digital Badges Industry Volume (K Unit) Forecast, by Application 2019 & 2032
- Table 93: South Africa Digital Badges Industry Revenue (Million) Forecast, by Application 2019 & 2032
- Table 94: South Africa Digital Badges Industry Volume (K Unit) Forecast, by Application 2019 & 2032
- Table 95: Rest of Middle East and Africa Digital Badges Industry Revenue (Million) Forecast, by Application 2019 & 2032
- Table 96: Rest of Middle East and Africa Digital Badges Industry Volume (K Unit) Forecast, by Application 2019 & 2032
- Table 97: Global Digital Badges Industry Revenue Million Forecast, by End-user 2019 & 2032
- Table 98: Global Digital Badges Industry Volume K Unit Forecast, by End-user 2019 & 2032
- Table 99: Global Digital Badges Industry Revenue Million Forecast, by Country 2019 & 2032
- Table 100: Global Digital Badges Industry Volume K Unit Forecast, by Country 2019 & 2032
- Table 101: Global Digital Badges Industry Revenue Million Forecast, by End-user 2019 & 2032
- Table 102: Global Digital Badges Industry Volume K Unit Forecast, by End-user 2019 & 2032
- Table 103: Global Digital Badges Industry Revenue Million Forecast, by Country 2019 & 2032
- Table 104: Global Digital Badges Industry Volume K Unit Forecast, by Country 2019 & 2032
- Table 105: Global Digital Badges Industry Revenue Million Forecast, by End-user 2019 & 2032
- Table 106: Global Digital Badges Industry Volume K Unit Forecast, by End-user 2019 & 2032
- Table 107: Global Digital Badges Industry Revenue Million Forecast, by Country 2019 & 2032
- Table 108: Global Digital Badges Industry Volume K Unit Forecast, by Country 2019 & 2032
- Table 109: Global Digital Badges Industry Revenue Million Forecast, by End-user 2019 & 2032
- Table 110: Global Digital Badges Industry Volume K Unit Forecast, by End-user 2019 & 2032
- Table 111: Global Digital Badges Industry Revenue Million Forecast, by Country 2019 & 2032
- Table 112: Global Digital Badges Industry Volume K Unit Forecast, by Country 2019 & 2032
Frequently Asked Questions
1. What is the projected Compound Annual Growth Rate (CAGR) of the Digital Badges Industry?
The projected CAGR is approximately 17.38%.
2. Which companies are prominent players in the Digital Badges Industry?
Key companies in the market include Concentric Sky Inc, ProExam, ARMA International, Forall Systems Inc, Accredible, Badgecraf, Skillsoft Corporation, Portfolium Inc, AXELOS, Credly Inc, International Institute of Business Analysis.
3. What are the main segments of the Digital Badges Industry?
The market segments include End-user.
4. Can you provide details about the market size?
The market size is estimated to be USD 202.29 Million as of 2022.
5. What are some drivers contributing to market growth?
Increasing Focus on Online Learning.
6. What are the notable trends driving market growth?
Academic Segment to Occupy a Significant Market Share.
7. Are there any restraints impacting market growth?
Lack of IT Infrastructure in Developing Regions.
8. Can you provide examples of recent developments in the market?
June 2023: Skilljar has announced a partnership with Accredible; Issuing organizations can seamlessly connect their Skilljar training content with their credentialing program through the new Accredible Integration with Skilljar. This API integration offers learners a more streamlined and engaging experience, enhancing your credentials' market value and relevance.
9. What pricing options are available for accessing the report?
Pricing options include single-user, multi-user, and enterprise licenses priced at USD 4750, USD 5250, and USD 8750 respectively.
10. Is the market size provided in terms of value or volume?
The market size is provided in terms of value, measured in Million and volume, measured in K Unit.
11. Are there any specific market keywords associated with the report?
Yes, the market keyword associated with the report is "Digital Badges Industry," which aids in identifying and referencing the specific market segment covered.
12. How do I determine which pricing option suits my needs best?
The pricing options vary based on user requirements and access needs. Individual users may opt for single-user licenses, while businesses requiring broader access may choose multi-user or enterprise licenses for cost-effective access to the report.
13. Are there any additional resources or data provided in the Digital Badges Industry report?
While the report offers comprehensive insights, it's advisable to review the specific contents or supplementary materials provided to ascertain if additional resources or data are available.
14. How can I stay updated on further developments or reports in the Digital Badges Industry?
To stay informed about further developments, trends, and reports in the Digital Badges Industry, consider subscribing to industry newsletters, following relevant companies and organizations, or regularly checking reputable industry news sources and publications.
Methodology
Step 1 - Identification of Relevant Samples Size from Population Database


Step 2 - Approaches for Defining Global Market Size (Value, Volume* & Price*)

Note*: In applicable scenarios
Step 3 - Data Sources
Primary Research
- Web Analytics
- Survey Reports
- Research Institute
- Latest Research Reports
- Opinion Leaders
Secondary Research
- Annual Reports
- White Paper
- Latest Press Release
- Industry Association
- Paid Database
- Investor Presentations

Step 4 - Data Triangulation
Involves using different sources of information in order to increase the validity of a study
These sources are likely to be stakeholders in a program - participants, other researchers, program staff, other community members, and so on.
Then we put all data in single framework & apply various statistical tools to find out the dynamic on the market.
During the analysis stage, feedback from the stakeholder groups would be compared to determine areas of agreement as well as areas of divergence


