
Key Insights
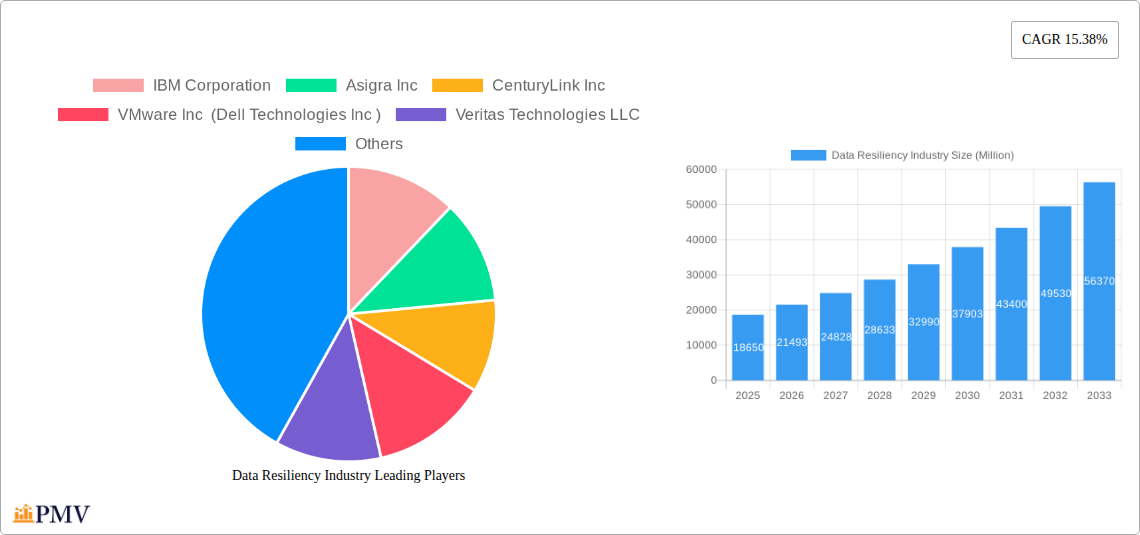
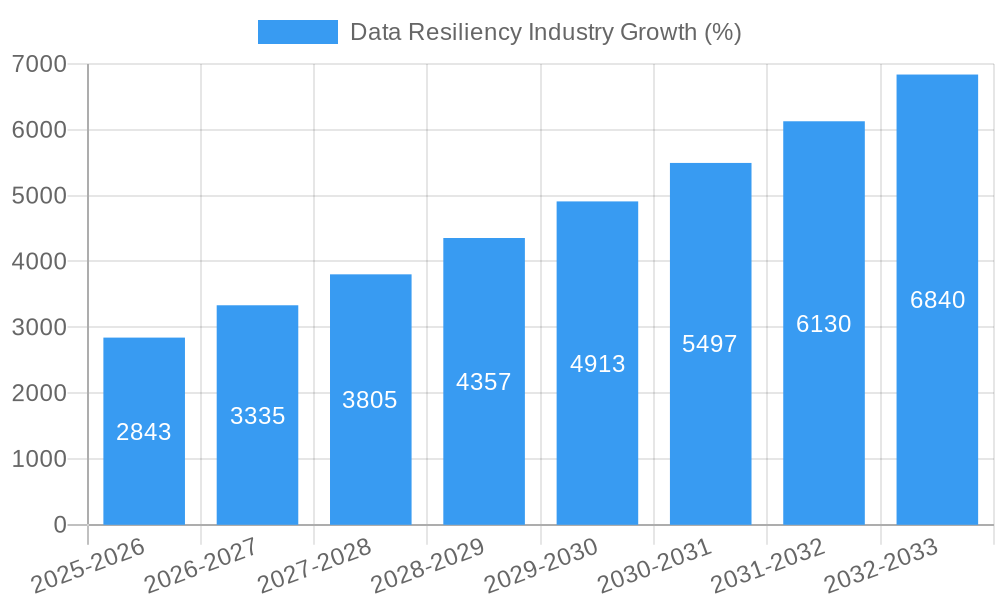
The data resiliency market, valued at $18.65 billion in 2025, is experiencing robust growth, projected to expand at a Compound Annual Growth Rate (CAGR) of 15.38% from 2025 to 2033. This significant expansion is fueled by several key drivers. The increasing volume and value of data across various sectors, coupled with stringent regulatory compliance requirements (like GDPR and CCPA) demanding robust data protection, are compelling organizations to invest heavily in data resiliency solutions. Furthermore, the rise of sophisticated cyber threats, including ransomware attacks and data breaches, is significantly driving demand for advanced data protection and recovery mechanisms. The shift towards cloud computing and hybrid cloud environments also contributes to market growth, as organizations seek reliable data protection solutions across diverse deployment models. The market is segmented by deployment (on-premise and cloud) and end-user vertical (BFSI, IT & Telecommunications, Government, Manufacturing, Healthcare, and others). The cloud deployment segment is expected to witness faster growth due to its scalability, cost-effectiveness, and accessibility. Within end-user verticals, BFSI and IT & Telecommunication sectors are leading the adoption, driven by their critical dependence on data integrity and availability.
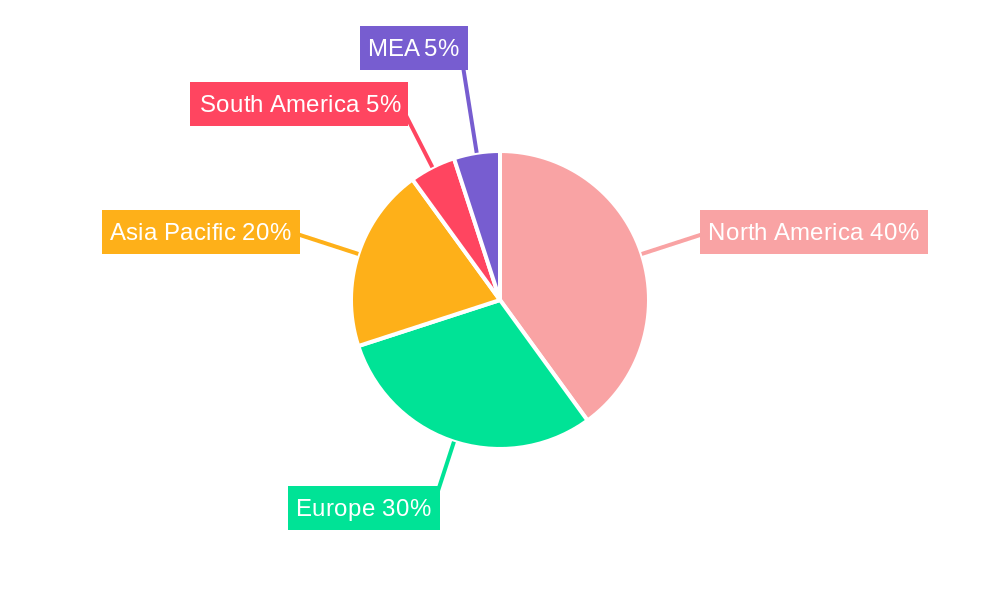
The competitive landscape is characterized by a mix of established players like IBM, Microsoft, and Veritas, alongside emerging technology providers. These companies are continuously innovating, offering solutions encompassing data backup, disaster recovery, archiving, and data replication. Competition is intensifying with the integration of artificial intelligence (AI) and machine learning (ML) into data resiliency solutions, enabling enhanced automation, predictive analytics, and improved recovery times. Geographic growth is expected to be widespread, with North America and Europe maintaining significant market share, but the Asia-Pacific region exhibiting considerable potential for future expansion due to rapid digitalization and economic growth. However, factors such as the high initial investment costs associated with implementing comprehensive data resiliency strategies and the complexity of integrating diverse solutions across heterogeneous IT environments could pose challenges to market expansion.
Data Resiliency Industry Market Report: 2019-2033
This comprehensive report provides a detailed analysis of the Data Resiliency Industry, projecting a market size of $XX Million by 2033. It covers the period from 2019 to 2033, with 2025 serving as the base and estimated year. The forecast period spans 2025-2033, while the historical period encompasses 2019-2024. This report is essential for businesses, investors, and researchers seeking to understand the dynamics and future potential of this rapidly evolving market. It features in-depth analysis of market segments, competitive landscape, key growth drivers, and challenges, providing actionable insights for strategic decision-making.
Data Resiliency Industry Market Structure & Competitive Dynamics
The Data Resiliency Industry is characterized by a moderately concentrated market structure, with key players like IBM Corporation, VMware Inc (Dell Technologies Inc), Microsoft Corporation, and Veritas Technologies LLC holding significant market share. The industry's competitive dynamics are shaped by ongoing innovation, particularly in areas like cloud-based solutions and AI-driven data protection. Regulatory frameworks, such as GDPR and CCPA, significantly influence vendor strategies and customer choices. Product substitution is a factor, with some organizations opting for simpler, less expensive backup solutions. However, the increasing sophistication of cyber threats and the growing value of data are driving demand for robust, comprehensive data resiliency solutions. M&A activity has been significant, with deal values exceeding $XX Million in recent years, reflecting consolidation and the pursuit of broader market reach. For instance, Carbonite's acquisition by OpenText showcases this trend. Market share analysis reveals that the top five players collectively account for approximately XX% of the market.
- Market Concentration: Moderately concentrated, with top 5 players holding approximately XX% market share.
- Innovation Ecosystem: Strong, driven by advancements in cloud computing, AI, and machine learning.
- Regulatory Framework: Increasingly stringent data protection regulations drive market growth.
- M&A Activity: Significant, with deal values exceeding $XX Million in recent years.
Data Resiliency Industry Industry Trends & Insights
The Data Resiliency Industry is experiencing robust growth, driven by several key factors. The escalating frequency and severity of cyberattacks are compelling organizations to invest heavily in data protection and recovery capabilities. The migration to cloud environments is also fueling demand, as businesses seek resilient solutions for their cloud-based data. Furthermore, the rise of big data and the increasing importance of data analytics are increasing the need for robust data management and protection strategies. The Compound Annual Growth Rate (CAGR) during the forecast period (2025-2033) is projected to be XX%. Market penetration is currently at approximately XX%, with significant growth potential in emerging markets and underserved sectors. Competitive dynamics are intensifying, with players focusing on innovation, strategic partnerships, and expansion into new markets. Consumer preferences are shifting toward cloud-based solutions offering scalability, cost-effectiveness, and enhanced security features.
Dominant Markets & Segments in Data Resiliency Industry
The Cloud segment is currently the dominant deployment model in the Data Resiliency Industry, driven by its scalability, cost-effectiveness, and ease of access. The BFSI (Banking, Financial Services, and Insurance) sector represents the largest end-user vertical, owing to its stringent regulatory requirements and the criticality of data protection in financial transactions. The North American region holds the largest market share due to high technological adoption, robust IT infrastructure, and stringent data privacy regulations.
Key Drivers:
- Cloud Segment: Scalability, cost-effectiveness, and ease of access.
- BFSI Vertical: Stringent regulatory compliance and criticality of data protection.
- North American Region: High technological adoption and robust IT infrastructure.
Dominance Analysis: The dominance of the cloud segment is projected to continue throughout the forecast period, driven by the increasing adoption of cloud-native applications and the growing preference for cloud-based services. The BFSI sector will remain a key growth driver due to the inherent risks associated with data breaches in this industry.
Data Resiliency Industry Product Innovations
Recent product innovations in the data resiliency industry include advancements in automated data backup and recovery, AI-powered data protection, and integrated security solutions. These innovations enhance data protection effectiveness, reduce recovery times, and improve overall operational efficiency. The market is witnessing a convergence of data protection and security functionalities, with solutions offering comprehensive protection against various threats. This addresses the increasing need for a holistic approach to data security and resilience. The market fit for these products is strong, given the rising concerns around data security and compliance.
Report Segmentation & Scope
The report segments the Data Resiliency Industry by Deployment (On-premise, Cloud) and End-user Vertical (BFSI, IT & Telecommunication, Government, Manufacturing, Healthcare, Other End-user Vertical). The Cloud deployment segment is expected to witness faster growth compared to the on-premise segment. Within the end-user verticals, BFSI, IT & Telecommunication, and Government are expected to be the leading segments due to their higher data volumes and stringent regulatory requirements. Each segment’s growth projection, market size, and competitive landscape are analyzed in detail within the report.
Key Drivers of Data Resiliency Industry Growth
The Data Resiliency Industry's growth is propelled by several factors: the increasing volume and value of data, rising cyber threats, stringent data protection regulations (like GDPR and CCPA), the increasing adoption of cloud computing, and the growing need for business continuity and disaster recovery planning. Technological advancements like AI and machine learning are further enhancing the capabilities of data resiliency solutions. The economic incentive to minimize data loss and associated financial implications is also a significant driver.
Challenges in the Data Resiliency Industry Sector
The Data Resiliency Industry faces challenges such as the high cost of implementation and maintenance of advanced solutions, the complexity of integrating data protection strategies across diverse IT environments, and the need for skilled professionals to manage and maintain these systems. Supply chain disruptions can impact the availability of hardware and software components. Competitive pressures, including pricing wars and the emergence of new players, also pose significant challenges. These factors can impact market growth and profitability.
Leading Players in the Data Resiliency Industry Market
- IBM Corporation
- Asigra Inc
- CenturyLink Inc
- VMware Inc (Dell Technologies Inc)
- Veritas Technologies LLC
- Microsoft Corporation
- NetApp Inc
- Carbonite Inc (OpenText Corporation)
- Acronis International GmbH
- Micro Focus International plc
- Commvault Systems Inc
Key Developments in Data Resiliency Industry Sector
- 2022-Q4: IBM announced significant advancements in its data protection portfolio, integrating AI for enhanced threat detection.
- 2023-Q1: Microsoft launched a new cloud-based data resiliency solution, emphasizing enhanced security features.
- 2023-Q2: A major merger between two mid-sized data resiliency companies resulted in a combined market share of XX%. (Specific details within the full report)
Strategic Data Resiliency Industry Market Outlook
The Data Resiliency Industry is poised for continued growth, fueled by ongoing technological advancements, evolving regulatory landscapes, and the escalating need for robust data protection strategies. Strategic opportunities lie in developing innovative solutions that address the growing challenges of data security and compliance, particularly in cloud environments. Focusing on AI-powered solutions and integrated security offerings will be critical for success in this dynamic market. The expansion into emerging markets and untapped industry verticals presents further growth potential.
Data Resiliency Industry Segmentation
-
1. Deployment
- 1.1. On-premise
- 1.2. Cloud
-
2. End-user Vertical
- 2.1. BFSI
- 2.2. IT & Telecommunication
- 2.3. Government
- 2.4. Manufacturing
- 2.5. Healthcare
- 2.6. Other End-user Vertical
Data Resiliency Industry Segmentation By Geography
- 1. North America
- 2. Europe
- 3. Asia Pacific
- 4. Latin America
- 5. Middle East
Data Resiliency Industry REPORT HIGHLIGHTS
| Aspects | Details |
|---|---|
| Study Period | 2019-2033 |
| Base Year | 2024 |
| Estimated Year | 2025 |
| Forecast Period | 2025-2033 |
| Historical Period | 2019-2024 |
| Growth Rate | CAGR of 15.38% from 2019-2033 |
| Segmentation |
|
Table of Contents
- 1. Introduction
- 1.1. Research Scope
- 1.2. Market Segmentation
- 1.3. Research Methodology
- 1.4. Definitions and Assumptions
- 2. Executive Summary
- 2.1. Introduction
- 3. Market Dynamics
- 3.1. Introduction
- 3.2. Market Drivers
- 3.2.1. ; Rapid Growth in Data being Generated from Multiple Sources; Increasing Privacy Concerns and Rising Need for Data Security
- 3.3. Market Restrains
- 3.3.1. ; Availability of open-source alternatives
- 3.4. Market Trends
- 3.4.1. BFSI Segment is Expected to Witness Significant Growth
- 4. Market Factor Analysis
- 4.1. Porters Five Forces
- 4.2. Supply/Value Chain
- 4.3. PESTEL analysis
- 4.4. Market Entropy
- 4.5. Patent/Trademark Analysis
- 5. Global Data Resiliency Industry Analysis, Insights and Forecast, 2019-2031
- 5.1. Market Analysis, Insights and Forecast - by Deployment
- 5.1.1. On-premise
- 5.1.2. Cloud
- 5.2. Market Analysis, Insights and Forecast - by End-user Vertical
- 5.2.1. BFSI
- 5.2.2. IT & Telecommunication
- 5.2.3. Government
- 5.2.4. Manufacturing
- 5.2.5. Healthcare
- 5.2.6. Other End-user Vertical
- 5.3. Market Analysis, Insights and Forecast - by Region
- 5.3.1. North America
- 5.3.2. Europe
- 5.3.3. Asia Pacific
- 5.3.4. Latin America
- 5.3.5. Middle East
- 5.1. Market Analysis, Insights and Forecast - by Deployment
- 6. North America Data Resiliency Industry Analysis, Insights and Forecast, 2019-2031
- 6.1. Market Analysis, Insights and Forecast - by Deployment
- 6.1.1. On-premise
- 6.1.2. Cloud
- 6.2. Market Analysis, Insights and Forecast - by End-user Vertical
- 6.2.1. BFSI
- 6.2.2. IT & Telecommunication
- 6.2.3. Government
- 6.2.4. Manufacturing
- 6.2.5. Healthcare
- 6.2.6. Other End-user Vertical
- 6.1. Market Analysis, Insights and Forecast - by Deployment
- 7. Europe Data Resiliency Industry Analysis, Insights and Forecast, 2019-2031
- 7.1. Market Analysis, Insights and Forecast - by Deployment
- 7.1.1. On-premise
- 7.1.2. Cloud
- 7.2. Market Analysis, Insights and Forecast - by End-user Vertical
- 7.2.1. BFSI
- 7.2.2. IT & Telecommunication
- 7.2.3. Government
- 7.2.4. Manufacturing
- 7.2.5. Healthcare
- 7.2.6. Other End-user Vertical
- 7.1. Market Analysis, Insights and Forecast - by Deployment
- 8. Asia Pacific Data Resiliency Industry Analysis, Insights and Forecast, 2019-2031
- 8.1. Market Analysis, Insights and Forecast - by Deployment
- 8.1.1. On-premise
- 8.1.2. Cloud
- 8.2. Market Analysis, Insights and Forecast - by End-user Vertical
- 8.2.1. BFSI
- 8.2.2. IT & Telecommunication
- 8.2.3. Government
- 8.2.4. Manufacturing
- 8.2.5. Healthcare
- 8.2.6. Other End-user Vertical
- 8.1. Market Analysis, Insights and Forecast - by Deployment
- 9. Latin America Data Resiliency Industry Analysis, Insights and Forecast, 2019-2031
- 9.1. Market Analysis, Insights and Forecast - by Deployment
- 9.1.1. On-premise
- 9.1.2. Cloud
- 9.2. Market Analysis, Insights and Forecast - by End-user Vertical
- 9.2.1. BFSI
- 9.2.2. IT & Telecommunication
- 9.2.3. Government
- 9.2.4. Manufacturing
- 9.2.5. Healthcare
- 9.2.6. Other End-user Vertical
- 9.1. Market Analysis, Insights and Forecast - by Deployment
- 10. Middle East Data Resiliency Industry Analysis, Insights and Forecast, 2019-2031
- 10.1. Market Analysis, Insights and Forecast - by Deployment
- 10.1.1. On-premise
- 10.1.2. Cloud
- 10.2. Market Analysis, Insights and Forecast - by End-user Vertical
- 10.2.1. BFSI
- 10.2.2. IT & Telecommunication
- 10.2.3. Government
- 10.2.4. Manufacturing
- 10.2.5. Healthcare
- 10.2.6. Other End-user Vertical
- 10.1. Market Analysis, Insights and Forecast - by Deployment
- 11. North America Data Resiliency Industry Analysis, Insights and Forecast, 2019-2031
- 11.1. Market Analysis, Insights and Forecast - By Country/Sub-region
- 11.1.1 United States
- 11.1.2 Canada
- 11.1.3 Mexico
- 12. Europe Data Resiliency Industry Analysis, Insights and Forecast, 2019-2031
- 12.1. Market Analysis, Insights and Forecast - By Country/Sub-region
- 12.1.1 Germany
- 12.1.2 United Kingdom
- 12.1.3 France
- 12.1.4 Spain
- 12.1.5 Italy
- 12.1.6 Spain
- 12.1.7 Belgium
- 12.1.8 Netherland
- 12.1.9 Nordics
- 12.1.10 Rest of Europe
- 13. Asia Pacific Data Resiliency Industry Analysis, Insights and Forecast, 2019-2031
- 13.1. Market Analysis, Insights and Forecast - By Country/Sub-region
- 13.1.1 China
- 13.1.2 Japan
- 13.1.3 India
- 13.1.4 South Korea
- 13.1.5 Southeast Asia
- 13.1.6 Australia
- 13.1.7 Indonesia
- 13.1.8 Phillipes
- 13.1.9 Singapore
- 13.1.10 Thailandc
- 13.1.11 Rest of Asia Pacific
- 14. South America Data Resiliency Industry Analysis, Insights and Forecast, 2019-2031
- 14.1. Market Analysis, Insights and Forecast - By Country/Sub-region
- 14.1.1 Brazil
- 14.1.2 Argentina
- 14.1.3 Peru
- 14.1.4 Chile
- 14.1.5 Colombia
- 14.1.6 Ecuador
- 14.1.7 Venezuela
- 14.1.8 Rest of South America
- 15. North America Data Resiliency Industry Analysis, Insights and Forecast, 2019-2031
- 15.1. Market Analysis, Insights and Forecast - By Country/Sub-region
- 15.1.1 United States
- 15.1.2 Canada
- 15.1.3 Mexico
- 16. MEA Data Resiliency Industry Analysis, Insights and Forecast, 2019-2031
- 16.1. Market Analysis, Insights and Forecast - By Country/Sub-region
- 16.1.1 United Arab Emirates
- 16.1.2 Saudi Arabia
- 16.1.3 South Africa
- 16.1.4 Rest of Middle East and Africa
- 17. Competitive Analysis
- 17.1. Global Market Share Analysis 2024
- 17.2. Company Profiles
- 17.2.1 IBM Corporation
- 17.2.1.1. Overview
- 17.2.1.2. Products
- 17.2.1.3. SWOT Analysis
- 17.2.1.4. Recent Developments
- 17.2.1.5. Financials (Based on Availability)
- 17.2.2 Asigra Inc
- 17.2.2.1. Overview
- 17.2.2.2. Products
- 17.2.2.3. SWOT Analysis
- 17.2.2.4. Recent Developments
- 17.2.2.5. Financials (Based on Availability)
- 17.2.3 CenturyLink Inc
- 17.2.3.1. Overview
- 17.2.3.2. Products
- 17.2.3.3. SWOT Analysis
- 17.2.3.4. Recent Developments
- 17.2.3.5. Financials (Based on Availability)
- 17.2.4 VMware Inc (Dell Technologies Inc )
- 17.2.4.1. Overview
- 17.2.4.2. Products
- 17.2.4.3. SWOT Analysis
- 17.2.4.4. Recent Developments
- 17.2.4.5. Financials (Based on Availability)
- 17.2.5 Veritas Technologies LLC
- 17.2.5.1. Overview
- 17.2.5.2. Products
- 17.2.5.3. SWOT Analysis
- 17.2.5.4. Recent Developments
- 17.2.5.5. Financials (Based on Availability)
- 17.2.6 Microsoft Corporation
- 17.2.6.1. Overview
- 17.2.6.2. Products
- 17.2.6.3. SWOT Analysis
- 17.2.6.4. Recent Developments
- 17.2.6.5. Financials (Based on Availability)
- 17.2.7 NetApp Inc
- 17.2.7.1. Overview
- 17.2.7.2. Products
- 17.2.7.3. SWOT Analysis
- 17.2.7.4. Recent Developments
- 17.2.7.5. Financials (Based on Availability)
- 17.2.8 Carbonite Inc (OpenText Corporation)
- 17.2.8.1. Overview
- 17.2.8.2. Products
- 17.2.8.3. SWOT Analysis
- 17.2.8.4. Recent Developments
- 17.2.8.5. Financials (Based on Availability)
- 17.2.9 Acronis International GmbH
- 17.2.9.1. Overview
- 17.2.9.2. Products
- 17.2.9.3. SWOT Analysis
- 17.2.9.4. Recent Developments
- 17.2.9.5. Financials (Based on Availability)
- 17.2.10 Micro Focus International plc
- 17.2.10.1. Overview
- 17.2.10.2. Products
- 17.2.10.3. SWOT Analysis
- 17.2.10.4. Recent Developments
- 17.2.10.5. Financials (Based on Availability)
- 17.2.11 Commvault Systems Inc
- 17.2.11.1. Overview
- 17.2.11.2. Products
- 17.2.11.3. SWOT Analysis
- 17.2.11.4. Recent Developments
- 17.2.11.5. Financials (Based on Availability)
- 17.2.1 IBM Corporation
List of Figures
- Figure 1: Global Data Resiliency Industry Revenue Breakdown (Million, %) by Region 2024 & 2032
- Figure 2: Global Data Resiliency Industry Volume Breakdown (K Unit, %) by Region 2024 & 2032
- Figure 3: North America Data Resiliency Industry Revenue (Million), by Country 2024 & 2032
- Figure 4: North America Data Resiliency Industry Volume (K Unit), by Country 2024 & 2032
- Figure 5: North America Data Resiliency Industry Revenue Share (%), by Country 2024 & 2032
- Figure 6: North America Data Resiliency Industry Volume Share (%), by Country 2024 & 2032
- Figure 7: Europe Data Resiliency Industry Revenue (Million), by Country 2024 & 2032
- Figure 8: Europe Data Resiliency Industry Volume (K Unit), by Country 2024 & 2032
- Figure 9: Europe Data Resiliency Industry Revenue Share (%), by Country 2024 & 2032
- Figure 10: Europe Data Resiliency Industry Volume Share (%), by Country 2024 & 2032
- Figure 11: Asia Pacific Data Resiliency Industry Revenue (Million), by Country 2024 & 2032
- Figure 12: Asia Pacific Data Resiliency Industry Volume (K Unit), by Country 2024 & 2032
- Figure 13: Asia Pacific Data Resiliency Industry Revenue Share (%), by Country 2024 & 2032
- Figure 14: Asia Pacific Data Resiliency Industry Volume Share (%), by Country 2024 & 2032
- Figure 15: South America Data Resiliency Industry Revenue (Million), by Country 2024 & 2032
- Figure 16: South America Data Resiliency Industry Volume (K Unit), by Country 2024 & 2032
- Figure 17: South America Data Resiliency Industry Revenue Share (%), by Country 2024 & 2032
- Figure 18: South America Data Resiliency Industry Volume Share (%), by Country 2024 & 2032
- Figure 19: North America Data Resiliency Industry Revenue (Million), by Country 2024 & 2032
- Figure 20: North America Data Resiliency Industry Volume (K Unit), by Country 2024 & 2032
- Figure 21: North America Data Resiliency Industry Revenue Share (%), by Country 2024 & 2032
- Figure 22: North America Data Resiliency Industry Volume Share (%), by Country 2024 & 2032
- Figure 23: MEA Data Resiliency Industry Revenue (Million), by Country 2024 & 2032
- Figure 24: MEA Data Resiliency Industry Volume (K Unit), by Country 2024 & 2032
- Figure 25: MEA Data Resiliency Industry Revenue Share (%), by Country 2024 & 2032
- Figure 26: MEA Data Resiliency Industry Volume Share (%), by Country 2024 & 2032
- Figure 27: North America Data Resiliency Industry Revenue (Million), by Deployment 2024 & 2032
- Figure 28: North America Data Resiliency Industry Volume (K Unit), by Deployment 2024 & 2032
- Figure 29: North America Data Resiliency Industry Revenue Share (%), by Deployment 2024 & 2032
- Figure 30: North America Data Resiliency Industry Volume Share (%), by Deployment 2024 & 2032
- Figure 31: North America Data Resiliency Industry Revenue (Million), by End-user Vertical 2024 & 2032
- Figure 32: North America Data Resiliency Industry Volume (K Unit), by End-user Vertical 2024 & 2032
- Figure 33: North America Data Resiliency Industry Revenue Share (%), by End-user Vertical 2024 & 2032
- Figure 34: North America Data Resiliency Industry Volume Share (%), by End-user Vertical 2024 & 2032
- Figure 35: North America Data Resiliency Industry Revenue (Million), by Country 2024 & 2032
- Figure 36: North America Data Resiliency Industry Volume (K Unit), by Country 2024 & 2032
- Figure 37: North America Data Resiliency Industry Revenue Share (%), by Country 2024 & 2032
- Figure 38: North America Data Resiliency Industry Volume Share (%), by Country 2024 & 2032
- Figure 39: Europe Data Resiliency Industry Revenue (Million), by Deployment 2024 & 2032
- Figure 40: Europe Data Resiliency Industry Volume (K Unit), by Deployment 2024 & 2032
- Figure 41: Europe Data Resiliency Industry Revenue Share (%), by Deployment 2024 & 2032
- Figure 42: Europe Data Resiliency Industry Volume Share (%), by Deployment 2024 & 2032
- Figure 43: Europe Data Resiliency Industry Revenue (Million), by End-user Vertical 2024 & 2032
- Figure 44: Europe Data Resiliency Industry Volume (K Unit), by End-user Vertical 2024 & 2032
- Figure 45: Europe Data Resiliency Industry Revenue Share (%), by End-user Vertical 2024 & 2032
- Figure 46: Europe Data Resiliency Industry Volume Share (%), by End-user Vertical 2024 & 2032
- Figure 47: Europe Data Resiliency Industry Revenue (Million), by Country 2024 & 2032
- Figure 48: Europe Data Resiliency Industry Volume (K Unit), by Country 2024 & 2032
- Figure 49: Europe Data Resiliency Industry Revenue Share (%), by Country 2024 & 2032
- Figure 50: Europe Data Resiliency Industry Volume Share (%), by Country 2024 & 2032
- Figure 51: Asia Pacific Data Resiliency Industry Revenue (Million), by Deployment 2024 & 2032
- Figure 52: Asia Pacific Data Resiliency Industry Volume (K Unit), by Deployment 2024 & 2032
- Figure 53: Asia Pacific Data Resiliency Industry Revenue Share (%), by Deployment 2024 & 2032
- Figure 54: Asia Pacific Data Resiliency Industry Volume Share (%), by Deployment 2024 & 2032
- Figure 55: Asia Pacific Data Resiliency Industry Revenue (Million), by End-user Vertical 2024 & 2032
- Figure 56: Asia Pacific Data Resiliency Industry Volume (K Unit), by End-user Vertical 2024 & 2032
- Figure 57: Asia Pacific Data Resiliency Industry Revenue Share (%), by End-user Vertical 2024 & 2032
- Figure 58: Asia Pacific Data Resiliency Industry Volume Share (%), by End-user Vertical 2024 & 2032
- Figure 59: Asia Pacific Data Resiliency Industry Revenue (Million), by Country 2024 & 2032
- Figure 60: Asia Pacific Data Resiliency Industry Volume (K Unit), by Country 2024 & 2032
- Figure 61: Asia Pacific Data Resiliency Industry Revenue Share (%), by Country 2024 & 2032
- Figure 62: Asia Pacific Data Resiliency Industry Volume Share (%), by Country 2024 & 2032
- Figure 63: Latin America Data Resiliency Industry Revenue (Million), by Deployment 2024 & 2032
- Figure 64: Latin America Data Resiliency Industry Volume (K Unit), by Deployment 2024 & 2032
- Figure 65: Latin America Data Resiliency Industry Revenue Share (%), by Deployment 2024 & 2032
- Figure 66: Latin America Data Resiliency Industry Volume Share (%), by Deployment 2024 & 2032
- Figure 67: Latin America Data Resiliency Industry Revenue (Million), by End-user Vertical 2024 & 2032
- Figure 68: Latin America Data Resiliency Industry Volume (K Unit), by End-user Vertical 2024 & 2032
- Figure 69: Latin America Data Resiliency Industry Revenue Share (%), by End-user Vertical 2024 & 2032
- Figure 70: Latin America Data Resiliency Industry Volume Share (%), by End-user Vertical 2024 & 2032
- Figure 71: Latin America Data Resiliency Industry Revenue (Million), by Country 2024 & 2032
- Figure 72: Latin America Data Resiliency Industry Volume (K Unit), by Country 2024 & 2032
- Figure 73: Latin America Data Resiliency Industry Revenue Share (%), by Country 2024 & 2032
- Figure 74: Latin America Data Resiliency Industry Volume Share (%), by Country 2024 & 2032
- Figure 75: Middle East Data Resiliency Industry Revenue (Million), by Deployment 2024 & 2032
- Figure 76: Middle East Data Resiliency Industry Volume (K Unit), by Deployment 2024 & 2032
- Figure 77: Middle East Data Resiliency Industry Revenue Share (%), by Deployment 2024 & 2032
- Figure 78: Middle East Data Resiliency Industry Volume Share (%), by Deployment 2024 & 2032
- Figure 79: Middle East Data Resiliency Industry Revenue (Million), by End-user Vertical 2024 & 2032
- Figure 80: Middle East Data Resiliency Industry Volume (K Unit), by End-user Vertical 2024 & 2032
- Figure 81: Middle East Data Resiliency Industry Revenue Share (%), by End-user Vertical 2024 & 2032
- Figure 82: Middle East Data Resiliency Industry Volume Share (%), by End-user Vertical 2024 & 2032
- Figure 83: Middle East Data Resiliency Industry Revenue (Million), by Country 2024 & 2032
- Figure 84: Middle East Data Resiliency Industry Volume (K Unit), by Country 2024 & 2032
- Figure 85: Middle East Data Resiliency Industry Revenue Share (%), by Country 2024 & 2032
- Figure 86: Middle East Data Resiliency Industry Volume Share (%), by Country 2024 & 2032
List of Tables
- Table 1: Global Data Resiliency Industry Revenue Million Forecast, by Region 2019 & 2032
- Table 2: Global Data Resiliency Industry Volume K Unit Forecast, by Region 2019 & 2032
- Table 3: Global Data Resiliency Industry Revenue Million Forecast, by Deployment 2019 & 2032
- Table 4: Global Data Resiliency Industry Volume K Unit Forecast, by Deployment 2019 & 2032
- Table 5: Global Data Resiliency Industry Revenue Million Forecast, by End-user Vertical 2019 & 2032
- Table 6: Global Data Resiliency Industry Volume K Unit Forecast, by End-user Vertical 2019 & 2032
- Table 7: Global Data Resiliency Industry Revenue Million Forecast, by Region 2019 & 2032
- Table 8: Global Data Resiliency Industry Volume K Unit Forecast, by Region 2019 & 2032
- Table 9: Global Data Resiliency Industry Revenue Million Forecast, by Country 2019 & 2032
- Table 10: Global Data Resiliency Industry Volume K Unit Forecast, by Country 2019 & 2032
- Table 11: United States Data Resiliency Industry Revenue (Million) Forecast, by Application 2019 & 2032
- Table 12: United States Data Resiliency Industry Volume (K Unit) Forecast, by Application 2019 & 2032
- Table 13: Canada Data Resiliency Industry Revenue (Million) Forecast, by Application 2019 & 2032
- Table 14: Canada Data Resiliency Industry Volume (K Unit) Forecast, by Application 2019 & 2032
- Table 15: Mexico Data Resiliency Industry Revenue (Million) Forecast, by Application 2019 & 2032
- Table 16: Mexico Data Resiliency Industry Volume (K Unit) Forecast, by Application 2019 & 2032
- Table 17: Global Data Resiliency Industry Revenue Million Forecast, by Country 2019 & 2032
- Table 18: Global Data Resiliency Industry Volume K Unit Forecast, by Country 2019 & 2032
- Table 19: Germany Data Resiliency Industry Revenue (Million) Forecast, by Application 2019 & 2032
- Table 20: Germany Data Resiliency Industry Volume (K Unit) Forecast, by Application 2019 & 2032
- Table 21: United Kingdom Data Resiliency Industry Revenue (Million) Forecast, by Application 2019 & 2032
- Table 22: United Kingdom Data Resiliency Industry Volume (K Unit) Forecast, by Application 2019 & 2032
- Table 23: France Data Resiliency Industry Revenue (Million) Forecast, by Application 2019 & 2032
- Table 24: France Data Resiliency Industry Volume (K Unit) Forecast, by Application 2019 & 2032
- Table 25: Spain Data Resiliency Industry Revenue (Million) Forecast, by Application 2019 & 2032
- Table 26: Spain Data Resiliency Industry Volume (K Unit) Forecast, by Application 2019 & 2032
- Table 27: Italy Data Resiliency Industry Revenue (Million) Forecast, by Application 2019 & 2032
- Table 28: Italy Data Resiliency Industry Volume (K Unit) Forecast, by Application 2019 & 2032
- Table 29: Spain Data Resiliency Industry Revenue (Million) Forecast, by Application 2019 & 2032
- Table 30: Spain Data Resiliency Industry Volume (K Unit) Forecast, by Application 2019 & 2032
- Table 31: Belgium Data Resiliency Industry Revenue (Million) Forecast, by Application 2019 & 2032
- Table 32: Belgium Data Resiliency Industry Volume (K Unit) Forecast, by Application 2019 & 2032
- Table 33: Netherland Data Resiliency Industry Revenue (Million) Forecast, by Application 2019 & 2032
- Table 34: Netherland Data Resiliency Industry Volume (K Unit) Forecast, by Application 2019 & 2032
- Table 35: Nordics Data Resiliency Industry Revenue (Million) Forecast, by Application 2019 & 2032
- Table 36: Nordics Data Resiliency Industry Volume (K Unit) Forecast, by Application 2019 & 2032
- Table 37: Rest of Europe Data Resiliency Industry Revenue (Million) Forecast, by Application 2019 & 2032
- Table 38: Rest of Europe Data Resiliency Industry Volume (K Unit) Forecast, by Application 2019 & 2032
- Table 39: Global Data Resiliency Industry Revenue Million Forecast, by Country 2019 & 2032
- Table 40: Global Data Resiliency Industry Volume K Unit Forecast, by Country 2019 & 2032
- Table 41: China Data Resiliency Industry Revenue (Million) Forecast, by Application 2019 & 2032
- Table 42: China Data Resiliency Industry Volume (K Unit) Forecast, by Application 2019 & 2032
- Table 43: Japan Data Resiliency Industry Revenue (Million) Forecast, by Application 2019 & 2032
- Table 44: Japan Data Resiliency Industry Volume (K Unit) Forecast, by Application 2019 & 2032
- Table 45: India Data Resiliency Industry Revenue (Million) Forecast, by Application 2019 & 2032
- Table 46: India Data Resiliency Industry Volume (K Unit) Forecast, by Application 2019 & 2032
- Table 47: South Korea Data Resiliency Industry Revenue (Million) Forecast, by Application 2019 & 2032
- Table 48: South Korea Data Resiliency Industry Volume (K Unit) Forecast, by Application 2019 & 2032
- Table 49: Southeast Asia Data Resiliency Industry Revenue (Million) Forecast, by Application 2019 & 2032
- Table 50: Southeast Asia Data Resiliency Industry Volume (K Unit) Forecast, by Application 2019 & 2032
- Table 51: Australia Data Resiliency Industry Revenue (Million) Forecast, by Application 2019 & 2032
- Table 52: Australia Data Resiliency Industry Volume (K Unit) Forecast, by Application 2019 & 2032
- Table 53: Indonesia Data Resiliency Industry Revenue (Million) Forecast, by Application 2019 & 2032
- Table 54: Indonesia Data Resiliency Industry Volume (K Unit) Forecast, by Application 2019 & 2032
- Table 55: Phillipes Data Resiliency Industry Revenue (Million) Forecast, by Application 2019 & 2032
- Table 56: Phillipes Data Resiliency Industry Volume (K Unit) Forecast, by Application 2019 & 2032
- Table 57: Singapore Data Resiliency Industry Revenue (Million) Forecast, by Application 2019 & 2032
- Table 58: Singapore Data Resiliency Industry Volume (K Unit) Forecast, by Application 2019 & 2032
- Table 59: Thailandc Data Resiliency Industry Revenue (Million) Forecast, by Application 2019 & 2032
- Table 60: Thailandc Data Resiliency Industry Volume (K Unit) Forecast, by Application 2019 & 2032
- Table 61: Rest of Asia Pacific Data Resiliency Industry Revenue (Million) Forecast, by Application 2019 & 2032
- Table 62: Rest of Asia Pacific Data Resiliency Industry Volume (K Unit) Forecast, by Application 2019 & 2032
- Table 63: Global Data Resiliency Industry Revenue Million Forecast, by Country 2019 & 2032
- Table 64: Global Data Resiliency Industry Volume K Unit Forecast, by Country 2019 & 2032
- Table 65: Brazil Data Resiliency Industry Revenue (Million) Forecast, by Application 2019 & 2032
- Table 66: Brazil Data Resiliency Industry Volume (K Unit) Forecast, by Application 2019 & 2032
- Table 67: Argentina Data Resiliency Industry Revenue (Million) Forecast, by Application 2019 & 2032
- Table 68: Argentina Data Resiliency Industry Volume (K Unit) Forecast, by Application 2019 & 2032
- Table 69: Peru Data Resiliency Industry Revenue (Million) Forecast, by Application 2019 & 2032
- Table 70: Peru Data Resiliency Industry Volume (K Unit) Forecast, by Application 2019 & 2032
- Table 71: Chile Data Resiliency Industry Revenue (Million) Forecast, by Application 2019 & 2032
- Table 72: Chile Data Resiliency Industry Volume (K Unit) Forecast, by Application 2019 & 2032
- Table 73: Colombia Data Resiliency Industry Revenue (Million) Forecast, by Application 2019 & 2032
- Table 74: Colombia Data Resiliency Industry Volume (K Unit) Forecast, by Application 2019 & 2032
- Table 75: Ecuador Data Resiliency Industry Revenue (Million) Forecast, by Application 2019 & 2032
- Table 76: Ecuador Data Resiliency Industry Volume (K Unit) Forecast, by Application 2019 & 2032
- Table 77: Venezuela Data Resiliency Industry Revenue (Million) Forecast, by Application 2019 & 2032
- Table 78: Venezuela Data Resiliency Industry Volume (K Unit) Forecast, by Application 2019 & 2032
- Table 79: Rest of South America Data Resiliency Industry Revenue (Million) Forecast, by Application 2019 & 2032
- Table 80: Rest of South America Data Resiliency Industry Volume (K Unit) Forecast, by Application 2019 & 2032
- Table 81: Global Data Resiliency Industry Revenue Million Forecast, by Country 2019 & 2032
- Table 82: Global Data Resiliency Industry Volume K Unit Forecast, by Country 2019 & 2032
- Table 83: United States Data Resiliency Industry Revenue (Million) Forecast, by Application 2019 & 2032
- Table 84: United States Data Resiliency Industry Volume (K Unit) Forecast, by Application 2019 & 2032
- Table 85: Canada Data Resiliency Industry Revenue (Million) Forecast, by Application 2019 & 2032
- Table 86: Canada Data Resiliency Industry Volume (K Unit) Forecast, by Application 2019 & 2032
- Table 87: Mexico Data Resiliency Industry Revenue (Million) Forecast, by Application 2019 & 2032
- Table 88: Mexico Data Resiliency Industry Volume (K Unit) Forecast, by Application 2019 & 2032
- Table 89: Global Data Resiliency Industry Revenue Million Forecast, by Country 2019 & 2032
- Table 90: Global Data Resiliency Industry Volume K Unit Forecast, by Country 2019 & 2032
- Table 91: United Arab Emirates Data Resiliency Industry Revenue (Million) Forecast, by Application 2019 & 2032
- Table 92: United Arab Emirates Data Resiliency Industry Volume (K Unit) Forecast, by Application 2019 & 2032
- Table 93: Saudi Arabia Data Resiliency Industry Revenue (Million) Forecast, by Application 2019 & 2032
- Table 94: Saudi Arabia Data Resiliency Industry Volume (K Unit) Forecast, by Application 2019 & 2032
- Table 95: South Africa Data Resiliency Industry Revenue (Million) Forecast, by Application 2019 & 2032
- Table 96: South Africa Data Resiliency Industry Volume (K Unit) Forecast, by Application 2019 & 2032
- Table 97: Rest of Middle East and Africa Data Resiliency Industry Revenue (Million) Forecast, by Application 2019 & 2032
- Table 98: Rest of Middle East and Africa Data Resiliency Industry Volume (K Unit) Forecast, by Application 2019 & 2032
- Table 99: Global Data Resiliency Industry Revenue Million Forecast, by Deployment 2019 & 2032
- Table 100: Global Data Resiliency Industry Volume K Unit Forecast, by Deployment 2019 & 2032
- Table 101: Global Data Resiliency Industry Revenue Million Forecast, by End-user Vertical 2019 & 2032
- Table 102: Global Data Resiliency Industry Volume K Unit Forecast, by End-user Vertical 2019 & 2032
- Table 103: Global Data Resiliency Industry Revenue Million Forecast, by Country 2019 & 2032
- Table 104: Global Data Resiliency Industry Volume K Unit Forecast, by Country 2019 & 2032
- Table 105: Global Data Resiliency Industry Revenue Million Forecast, by Deployment 2019 & 2032
- Table 106: Global Data Resiliency Industry Volume K Unit Forecast, by Deployment 2019 & 2032
- Table 107: Global Data Resiliency Industry Revenue Million Forecast, by End-user Vertical 2019 & 2032
- Table 108: Global Data Resiliency Industry Volume K Unit Forecast, by End-user Vertical 2019 & 2032
- Table 109: Global Data Resiliency Industry Revenue Million Forecast, by Country 2019 & 2032
- Table 110: Global Data Resiliency Industry Volume K Unit Forecast, by Country 2019 & 2032
- Table 111: Global Data Resiliency Industry Revenue Million Forecast, by Deployment 2019 & 2032
- Table 112: Global Data Resiliency Industry Volume K Unit Forecast, by Deployment 2019 & 2032
- Table 113: Global Data Resiliency Industry Revenue Million Forecast, by End-user Vertical 2019 & 2032
- Table 114: Global Data Resiliency Industry Volume K Unit Forecast, by End-user Vertical 2019 & 2032
- Table 115: Global Data Resiliency Industry Revenue Million Forecast, by Country 2019 & 2032
- Table 116: Global Data Resiliency Industry Volume K Unit Forecast, by Country 2019 & 2032
- Table 117: Global Data Resiliency Industry Revenue Million Forecast, by Deployment 2019 & 2032
- Table 118: Global Data Resiliency Industry Volume K Unit Forecast, by Deployment 2019 & 2032
- Table 119: Global Data Resiliency Industry Revenue Million Forecast, by End-user Vertical 2019 & 2032
- Table 120: Global Data Resiliency Industry Volume K Unit Forecast, by End-user Vertical 2019 & 2032
- Table 121: Global Data Resiliency Industry Revenue Million Forecast, by Country 2019 & 2032
- Table 122: Global Data Resiliency Industry Volume K Unit Forecast, by Country 2019 & 2032
- Table 123: Global Data Resiliency Industry Revenue Million Forecast, by Deployment 2019 & 2032
- Table 124: Global Data Resiliency Industry Volume K Unit Forecast, by Deployment 2019 & 2032
- Table 125: Global Data Resiliency Industry Revenue Million Forecast, by End-user Vertical 2019 & 2032
- Table 126: Global Data Resiliency Industry Volume K Unit Forecast, by End-user Vertical 2019 & 2032
- Table 127: Global Data Resiliency Industry Revenue Million Forecast, by Country 2019 & 2032
- Table 128: Global Data Resiliency Industry Volume K Unit Forecast, by Country 2019 & 2032
Frequently Asked Questions
1. What is the projected Compound Annual Growth Rate (CAGR) of the Data Resiliency Industry?
The projected CAGR is approximately 15.38%.
2. Which companies are prominent players in the Data Resiliency Industry?
Key companies in the market include IBM Corporation, Asigra Inc, CenturyLink Inc, VMware Inc (Dell Technologies Inc ), Veritas Technologies LLC, Microsoft Corporation, NetApp Inc, Carbonite Inc (OpenText Corporation), Acronis International GmbH, Micro Focus International plc, Commvault Systems Inc.
3. What are the main segments of the Data Resiliency Industry?
The market segments include Deployment, End-user Vertical.
4. Can you provide details about the market size?
The market size is estimated to be USD 18.65 Million as of 2022.
5. What are some drivers contributing to market growth?
; Rapid Growth in Data being Generated from Multiple Sources; Increasing Privacy Concerns and Rising Need for Data Security.
6. What are the notable trends driving market growth?
BFSI Segment is Expected to Witness Significant Growth.
7. Are there any restraints impacting market growth?
; Availability of open-source alternatives.
8. Can you provide examples of recent developments in the market?
N/A
9. What pricing options are available for accessing the report?
Pricing options include single-user, multi-user, and enterprise licenses priced at USD 4750, USD 5250, and USD 8750 respectively.
10. Is the market size provided in terms of value or volume?
The market size is provided in terms of value, measured in Million and volume, measured in K Unit.
11. Are there any specific market keywords associated with the report?
Yes, the market keyword associated with the report is "Data Resiliency Industry," which aids in identifying and referencing the specific market segment covered.
12. How do I determine which pricing option suits my needs best?
The pricing options vary based on user requirements and access needs. Individual users may opt for single-user licenses, while businesses requiring broader access may choose multi-user or enterprise licenses for cost-effective access to the report.
13. Are there any additional resources or data provided in the Data Resiliency Industry report?
While the report offers comprehensive insights, it's advisable to review the specific contents or supplementary materials provided to ascertain if additional resources or data are available.
14. How can I stay updated on further developments or reports in the Data Resiliency Industry?
To stay informed about further developments, trends, and reports in the Data Resiliency Industry, consider subscribing to industry newsletters, following relevant companies and organizations, or regularly checking reputable industry news sources and publications.
Methodology
Step 1 - Identification of Relevant Samples Size from Population Database


Step 2 - Approaches for Defining Global Market Size (Value, Volume* & Price*)

Note*: In applicable scenarios
Step 3 - Data Sources
Primary Research
- Web Analytics
- Survey Reports
- Research Institute
- Latest Research Reports
- Opinion Leaders
Secondary Research
- Annual Reports
- White Paper
- Latest Press Release
- Industry Association
- Paid Database
- Investor Presentations

Step 4 - Data Triangulation
Involves using different sources of information in order to increase the validity of a study
These sources are likely to be stakeholders in a program - participants, other researchers, program staff, other community members, and so on.
Then we put all data in single framework & apply various statistical tools to find out the dynamic on the market.
During the analysis stage, feedback from the stakeholder groups would be compared to determine areas of agreement as well as areas of divergence


