
Key Insights
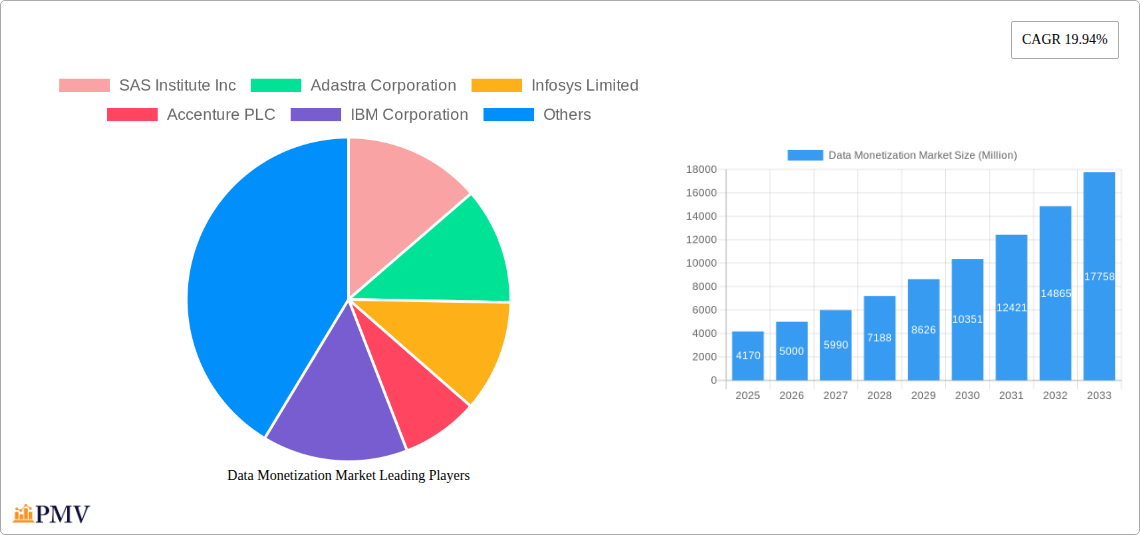
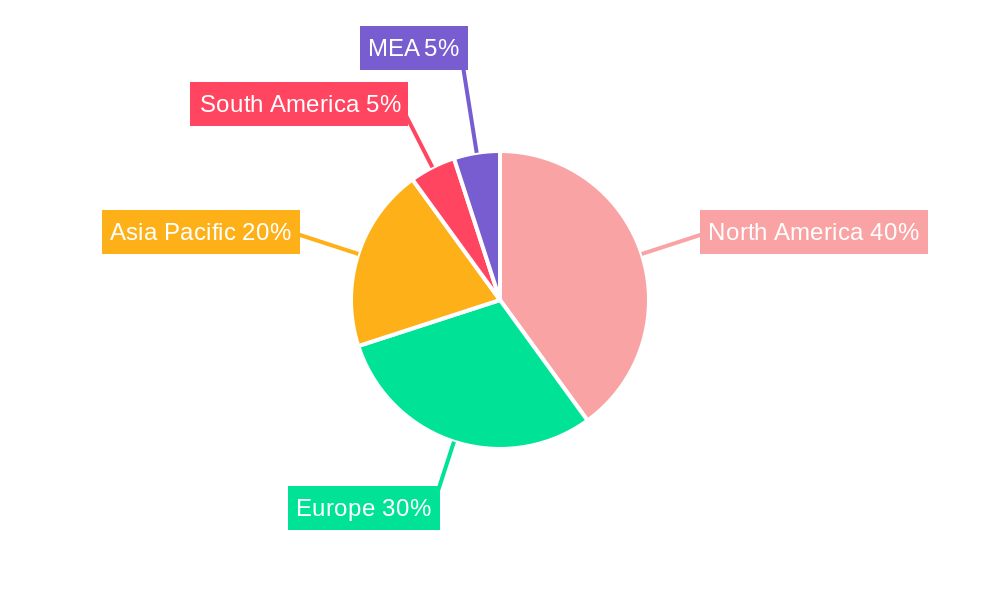
The global data monetization market, valued at $4.17 billion in 2025, is experiencing robust growth, projected to expand at a Compound Annual Growth Rate (CAGR) of 19.94% from 2025 to 2033. This surge is driven by several key factors. The increasing volume of data generated across various sectors, coupled with advancements in data analytics and AI technologies, enables organizations to extract valuable insights and create new revenue streams from their data assets. Furthermore, the rising adoption of cloud-based data management solutions and a growing focus on data security and privacy regulations are fostering market expansion. The BFSI (Banking, Financial Services, and Insurance), Telecom & IT, and Manufacturing sectors are significant contributors to market growth, actively leveraging data monetization strategies for enhanced customer engagement, operational efficiency, and new product development. The market is segmented by organization size (SMEs and large enterprises), with large enterprises currently dominating due to their greater resources and established data infrastructure. However, the SME segment is poised for significant growth driven by the increasing accessibility of data monetization tools and services. Geographic expansion is also a key driver, with North America and Europe holding substantial market shares, while Asia-Pacific is anticipated to witness rapid growth fueled by technological advancements and increasing data generation in emerging economies. Competitive pressures are also shaping the landscape, with established players like SAS, IBM, and Accenture competing with emerging technology providers and specialized data monetization firms.
The continued growth of the data monetization market hinges on several factors. Successful implementation requires overcoming challenges related to data quality, integration, and security. The ability to comply with evolving data privacy regulations like GDPR and CCPA is critical for sustained growth. Furthermore, the development and adoption of innovative data monetization models, such as data marketplaces and data-as-a-service offerings, will play a crucial role in shaping the future trajectory of the market. Companies are increasingly investing in advanced analytics capabilities and data infrastructure to effectively manage and leverage their data assets. The market's evolution will be driven by ongoing technological advancements, the emergence of new data sources (like IoT), and the expanding regulatory landscape surrounding data usage and monetization. This creates both challenges and opportunities for businesses seeking to capitalize on the value of their data.
This in-depth report provides a comprehensive analysis of the global Data Monetization Market, offering valuable insights for businesses, investors, and stakeholders seeking to understand and capitalize on this rapidly evolving sector. The study period covers 2019-2033, with 2025 as the base and estimated year, and a forecast period of 2025-2033. The report leverages extensive market research, incorporating key industry developments and competitive dynamics to present a holistic view of the market's current state and future trajectory. The market is projected to reach xx Million by 2033, exhibiting a significant CAGR of xx%.
Data Monetization Market Market Structure & Competitive Dynamics
The Data Monetization Market is characterized by a moderately concentrated structure, with a few major players holding significant market share. However, the market also exhibits a dynamic competitive landscape, influenced by continuous innovation, evolving regulatory frameworks, and the emergence of disruptive technologies. The market concentration ratio (CR4) is estimated at xx%, indicating the presence of both established players and smaller, agile competitors.
Key factors influencing the market structure include:
- Innovation Ecosystems: The rapid pace of technological advancements, particularly in areas such as AI, big data analytics, and blockchain, is fostering a vibrant innovation ecosystem, driving the development of new data monetization strategies and solutions.
- Regulatory Frameworks: Data privacy regulations, such as GDPR and CCPA, are significantly shaping the market landscape, influencing data usage practices and creating both challenges and opportunities for market participants.
- Product Substitutes: The availability of alternative data sources and monetization approaches presents a degree of substitutability, though the unique value proposition of specific data sets often mitigates this factor.
- End-User Trends: The growing adoption of data-driven decision-making across various industries is fueling demand for effective data monetization strategies.
- M&A Activities: Strategic mergers and acquisitions (M&A) are playing a crucial role in shaping the market landscape, with significant deals valued at xx Million observed in the historical period (2019-2024). For example, the acquisition of [Company A] by [Company B] in [Year] significantly altered the market share distribution.
Data Monetization Market Industry Trends & Insights
The Data Monetization Market is experiencing robust growth, driven by a confluence of factors. The increasing availability of data, coupled with advancements in data analytics and AI, is enabling businesses to extract greater value from their data assets. This trend is further amplified by the rising adoption of cloud computing and the growing demand for personalized customer experiences. The market is expected to witness a CAGR of xx% during the forecast period (2025-2033), reaching a projected market size of xx Million by 2033.
Key growth drivers include:
- Technological Advancements: AI-powered analytics tools, blockchain technology for secure data exchange, and the proliferation of IoT devices are revolutionizing data monetization capabilities.
- Rising Data Volumes: The exponential growth in data generation across various industries is creating an abundance of valuable data assets that require effective monetization strategies.
- Growing Demand for Personalized Experiences: Businesses are increasingly leveraging data to personalize customer interactions, leading to enhanced customer engagement and increased revenue streams.
- Cloud Computing Adoption: Cloud-based data platforms provide scalable and cost-effective solutions for data storage, processing, and monetization.
- Increasing Regulatory Scrutiny: While posing challenges, increasing data privacy regulations also incentivize the development of robust and compliant data monetization solutions. Market penetration for compliant solutions is currently at xx% and expected to reach xx% by 2033.
Dominant Markets & Segments in Data Monetization Market
The Data Monetization Market exhibits significant regional variations in growth and adoption. [Region X] currently represents the leading market, accounting for xx% of the global market share in 2025, driven primarily by [specific factors like strong economic growth and advanced technological infrastructure].
By Organization Size:
- Large Enterprises: This segment dominates the market, driven by their higher data volumes, robust IT infrastructure, and greater investment capacity. Growth projections for this segment are xx% CAGR.
- Small and Medium-sized Enterprises (SMEs): This segment is experiencing faster growth than the large enterprise segment, fueled by increasing awareness of data monetization opportunities and the availability of cost-effective solutions. Growth projections for this segment are xx% CAGR.
By End-user Industry:
- BFSI (Banking, Financial Services, and Insurance): This sector is a significant adopter of data monetization strategies, leveraging data for risk management, fraud detection, and personalized financial services.
- Telecom and IT: This sector benefits from high data volumes and advanced technologies, facilitating innovative data monetization initiatives.
- Manufacturing: Data from connected machines and production processes fuels efficiency improvements and new revenue streams.
- Healthcare: Data monetization in healthcare is regulated but growing, with strong demand for secure, compliant solutions for research and personalized medicine.
- Retail: Retailers leverage data for targeted advertising, inventory management, and personalized shopping experiences.
- Other End-user Industries: This segment includes diverse sectors adopting data monetization strategies, contributing to overall market growth.
Data Monetization Market Product Innovations
Recent advancements in data monetization include the development of sophisticated AI-powered analytics platforms, blockchain-based solutions for secure data exchange, and API-driven marketplaces for data sharing. These innovations are transforming how businesses approach data monetization, enhancing efficiency, security, and the overall value proposition. The market is witnessing a shift towards more agile and flexible data monetization models, catering to diverse business needs and regulatory requirements.
Report Segmentation & Scope
This report segments the Data Monetization Market based on organization size (Small and Medium-sized Enterprises and Large Enterprises) and end-user industry (BFSI, Telecom and IT, Manufacturing, Healthcare, Retail, and Other End-user Industries). Each segment is analyzed in detail, including its market size, growth projections, and competitive dynamics. The report provides insights into the market share of each segment, along with projected growth rates for the forecast period.
Key Drivers of Data Monetization Market Growth
Several key factors are driving the growth of the Data Monetization Market: the increasing availability of large data sets, advancements in analytics and AI, rising demand for personalized customer experiences, and the expanding adoption of cloud computing. Government initiatives promoting data sharing and open data policies also significantly contribute to market expansion. Technological advancements continue to unlock new possibilities for data monetization, with AI-powered insights and blockchain-based security playing pivotal roles.
Challenges in the Data Monetization Market Sector
The Data Monetization Market faces challenges such as data privacy regulations (GDPR, CCPA), concerns around data security and breaches, and the complexity of establishing efficient data governance frameworks. The need for robust data quality and interoperability is also critical. These factors impact market growth by increasing compliance costs and limiting data sharing possibilities. Addressing these challenges requires collaborative efforts across industries and governments to establish trustworthy data ecosystems.
Leading Players in the Data Monetization Market Market
- SAS Institute Inc
- Adastra Corporation
- Infosys Limited
- Accenture PLC
- IBM Corporation
- NetScout Systems Inc
- Dawex Systems SAS
- Ness Technologies Inc
- Google LLC (Alphabet Inc)
- Thales Group
- Cisco Systems Inc
- Openwave Mobility Inc (ENEA)
- SAP SE
- Emu Analytics Ltd
Key Developments in Data Monetization Market Sector
- April 2024: Carv raised USD 10 Million in Series A funding, highlighting the growing investor interest in data ownership and monetization platforms for web3 gaming and AI. This development signifies the market's potential for growth in innovative data monetization models.
- February 2024: Tecnotree's partnership with BytePlus showcases the potential of AI and API monetization strategies for Communication Service Providers (CSPs), emphasizing the B2B2X digital ecosystem's importance in the Data Monetization Market. This collaboration demonstrates the increasing focus on transforming wholesale enterprise monetization.
Strategic Data Monetization Market Market Outlook
The Data Monetization Market holds significant future potential, driven by continued technological advancements, increasing data volumes, and growing demand for data-driven insights across various sectors. Strategic opportunities lie in developing innovative data monetization solutions that address data privacy concerns, enhance data security, and facilitate seamless data sharing. The focus on personalized experiences and the emergence of new data sources (e.g., IoT, Web3) will further fuel market growth and diversification.
Data Monetization Market Segmentation
-
1. Organization Size
- 1.1. Small and Medium-sized Enterprises
- 1.2. Large Enterprises
-
2. End-user Industry
- 2.1. BFSI
- 2.2. Telecom and IT
- 2.3. Manufacturing
- 2.4. Healthcare
- 2.5. Retail
- 2.6. Other End-user Industries
Data Monetization Market Segmentation By Geography
- 1. North America
- 2. Europe
- 3. Asia
- 4. Australia and New Zealand
- 5. Latin America
- 6. Middle East and Africa
Data Monetization Market REPORT HIGHLIGHTS
| Aspects | Details |
|---|---|
| Study Period | 2019-2033 |
| Base Year | 2024 |
| Estimated Year | 2025 |
| Forecast Period | 2025-2033 |
| Historical Period | 2019-2024 |
| Growth Rate | CAGR of 19.94% from 2019-2033 |
| Segmentation |
|
Table of Contents
- 1. Introduction
- 1.1. Research Scope
- 1.2. Market Segmentation
- 1.3. Research Methodology
- 1.4. Definitions and Assumptions
- 2. Executive Summary
- 2.1. Introduction
- 3. Market Dynamics
- 3.1. Introduction
- 3.2. Market Drivers
- 3.2.1. Rapid Adoption of Advanced Analytics and Visualization; Increasing Volume and Variety of Business Data
- 3.3. Market Restrains
- 3.3.1. Interoperability With Existing Systems; Varying Structure of Regulatory Policies
- 3.4. Market Trends
- 3.4.1. Large Enterprises to Hold Major Market Share
- 4. Market Factor Analysis
- 4.1. Porters Five Forces
- 4.2. Supply/Value Chain
- 4.3. PESTEL analysis
- 4.4. Market Entropy
- 4.5. Patent/Trademark Analysis
- 5. Global Data Monetization Market Analysis, Insights and Forecast, 2019-2031
- 5.1. Market Analysis, Insights and Forecast - by Organization Size
- 5.1.1. Small and Medium-sized Enterprises
- 5.1.2. Large Enterprises
- 5.2. Market Analysis, Insights and Forecast - by End-user Industry
- 5.2.1. BFSI
- 5.2.2. Telecom and IT
- 5.2.3. Manufacturing
- 5.2.4. Healthcare
- 5.2.5. Retail
- 5.2.6. Other End-user Industries
- 5.3. Market Analysis, Insights and Forecast - by Region
- 5.3.1. North America
- 5.3.2. Europe
- 5.3.3. Asia
- 5.3.4. Australia and New Zealand
- 5.3.5. Latin America
- 5.3.6. Middle East and Africa
- 5.1. Market Analysis, Insights and Forecast - by Organization Size
- 6. North America Data Monetization Market Analysis, Insights and Forecast, 2019-2031
- 6.1. Market Analysis, Insights and Forecast - by Organization Size
- 6.1.1. Small and Medium-sized Enterprises
- 6.1.2. Large Enterprises
- 6.2. Market Analysis, Insights and Forecast - by End-user Industry
- 6.2.1. BFSI
- 6.2.2. Telecom and IT
- 6.2.3. Manufacturing
- 6.2.4. Healthcare
- 6.2.5. Retail
- 6.2.6. Other End-user Industries
- 6.1. Market Analysis, Insights and Forecast - by Organization Size
- 7. Europe Data Monetization Market Analysis, Insights and Forecast, 2019-2031
- 7.1. Market Analysis, Insights and Forecast - by Organization Size
- 7.1.1. Small and Medium-sized Enterprises
- 7.1.2. Large Enterprises
- 7.2. Market Analysis, Insights and Forecast - by End-user Industry
- 7.2.1. BFSI
- 7.2.2. Telecom and IT
- 7.2.3. Manufacturing
- 7.2.4. Healthcare
- 7.2.5. Retail
- 7.2.6. Other End-user Industries
- 7.1. Market Analysis, Insights and Forecast - by Organization Size
- 8. Asia Data Monetization Market Analysis, Insights and Forecast, 2019-2031
- 8.1. Market Analysis, Insights and Forecast - by Organization Size
- 8.1.1. Small and Medium-sized Enterprises
- 8.1.2. Large Enterprises
- 8.2. Market Analysis, Insights and Forecast - by End-user Industry
- 8.2.1. BFSI
- 8.2.2. Telecom and IT
- 8.2.3. Manufacturing
- 8.2.4. Healthcare
- 8.2.5. Retail
- 8.2.6. Other End-user Industries
- 8.1. Market Analysis, Insights and Forecast - by Organization Size
- 9. Australia and New Zealand Data Monetization Market Analysis, Insights and Forecast, 2019-2031
- 9.1. Market Analysis, Insights and Forecast - by Organization Size
- 9.1.1. Small and Medium-sized Enterprises
- 9.1.2. Large Enterprises
- 9.2. Market Analysis, Insights and Forecast - by End-user Industry
- 9.2.1. BFSI
- 9.2.2. Telecom and IT
- 9.2.3. Manufacturing
- 9.2.4. Healthcare
- 9.2.5. Retail
- 9.2.6. Other End-user Industries
- 9.1. Market Analysis, Insights and Forecast - by Organization Size
- 10. Latin America Data Monetization Market Analysis, Insights and Forecast, 2019-2031
- 10.1. Market Analysis, Insights and Forecast - by Organization Size
- 10.1.1. Small and Medium-sized Enterprises
- 10.1.2. Large Enterprises
- 10.2. Market Analysis, Insights and Forecast - by End-user Industry
- 10.2.1. BFSI
- 10.2.2. Telecom and IT
- 10.2.3. Manufacturing
- 10.2.4. Healthcare
- 10.2.5. Retail
- 10.2.6. Other End-user Industries
- 10.1. Market Analysis, Insights and Forecast - by Organization Size
- 11. Middle East and Africa Data Monetization Market Analysis, Insights and Forecast, 2019-2031
- 11.1. Market Analysis, Insights and Forecast - by Organization Size
- 11.1.1. Small and Medium-sized Enterprises
- 11.1.2. Large Enterprises
- 11.2. Market Analysis, Insights and Forecast - by End-user Industry
- 11.2.1. BFSI
- 11.2.2. Telecom and IT
- 11.2.3. Manufacturing
- 11.2.4. Healthcare
- 11.2.5. Retail
- 11.2.6. Other End-user Industries
- 11.1. Market Analysis, Insights and Forecast - by Organization Size
- 12. North America Data Monetization Market Analysis, Insights and Forecast, 2019-2031
- 12.1. Market Analysis, Insights and Forecast - By Country/Sub-region
- 12.1.1 United States
- 12.1.2 Canada
- 12.1.3 Mexico
- 13. Europe Data Monetization Market Analysis, Insights and Forecast, 2019-2031
- 13.1. Market Analysis, Insights and Forecast - By Country/Sub-region
- 13.1.1 Germany
- 13.1.2 United Kingdom
- 13.1.3 France
- 13.1.4 Spain
- 13.1.5 Italy
- 13.1.6 Spain
- 13.1.7 Belgium
- 13.1.8 Netherland
- 13.1.9 Nordics
- 13.1.10 Rest of Europe
- 14. Asia Pacific Data Monetization Market Analysis, Insights and Forecast, 2019-2031
- 14.1. Market Analysis, Insights and Forecast - By Country/Sub-region
- 14.1.1 China
- 14.1.2 Japan
- 14.1.3 India
- 14.1.4 South Korea
- 14.1.5 Southeast Asia
- 14.1.6 Australia
- 14.1.7 Indonesia
- 14.1.8 Phillipes
- 14.1.9 Singapore
- 14.1.10 Thailandc
- 14.1.11 Rest of Asia Pacific
- 15. South America Data Monetization Market Analysis, Insights and Forecast, 2019-2031
- 15.1. Market Analysis, Insights and Forecast - By Country/Sub-region
- 15.1.1 Brazil
- 15.1.2 Argentina
- 15.1.3 Peru
- 15.1.4 Chile
- 15.1.5 Colombia
- 15.1.6 Ecuador
- 15.1.7 Venezuela
- 15.1.8 Rest of South America
- 16. North America Data Monetization Market Analysis, Insights and Forecast, 2019-2031
- 16.1. Market Analysis, Insights and Forecast - By Country/Sub-region
- 16.1.1 United States
- 16.1.2 Canada
- 16.1.3 Mexico
- 17. MEA Data Monetization Market Analysis, Insights and Forecast, 2019-2031
- 17.1. Market Analysis, Insights and Forecast - By Country/Sub-region
- 17.1.1 United Arab Emirates
- 17.1.2 Saudi Arabia
- 17.1.3 South Africa
- 17.1.4 Rest of Middle East and Africa
- 18. Competitive Analysis
- 18.1. Global Market Share Analysis 2024
- 18.2. Company Profiles
- 18.2.1 SAS Institute Inc
- 18.2.1.1. Overview
- 18.2.1.2. Products
- 18.2.1.3. SWOT Analysis
- 18.2.1.4. Recent Developments
- 18.2.1.5. Financials (Based on Availability)
- 18.2.2 Adastra Corporation
- 18.2.2.1. Overview
- 18.2.2.2. Products
- 18.2.2.3. SWOT Analysis
- 18.2.2.4. Recent Developments
- 18.2.2.5. Financials (Based on Availability)
- 18.2.3 Infosys Limited
- 18.2.3.1. Overview
- 18.2.3.2. Products
- 18.2.3.3. SWOT Analysis
- 18.2.3.4. Recent Developments
- 18.2.3.5. Financials (Based on Availability)
- 18.2.4 Accenture PLC
- 18.2.4.1. Overview
- 18.2.4.2. Products
- 18.2.4.3. SWOT Analysis
- 18.2.4.4. Recent Developments
- 18.2.4.5. Financials (Based on Availability)
- 18.2.5 IBM Corporation
- 18.2.5.1. Overview
- 18.2.5.2. Products
- 18.2.5.3. SWOT Analysis
- 18.2.5.4. Recent Developments
- 18.2.5.5. Financials (Based on Availability)
- 18.2.6 NetScout Systems Inc
- 18.2.6.1. Overview
- 18.2.6.2. Products
- 18.2.6.3. SWOT Analysis
- 18.2.6.4. Recent Developments
- 18.2.6.5. Financials (Based on Availability)
- 18.2.7 Dawex Systems SAS
- 18.2.7.1. Overview
- 18.2.7.2. Products
- 18.2.7.3. SWOT Analysis
- 18.2.7.4. Recent Developments
- 18.2.7.5. Financials (Based on Availability)
- 18.2.8 Ness Technologies Inc
- 18.2.8.1. Overview
- 18.2.8.2. Products
- 18.2.8.3. SWOT Analysis
- 18.2.8.4. Recent Developments
- 18.2.8.5. Financials (Based on Availability)
- 18.2.9 Google LLC (Alphabet Inc )
- 18.2.9.1. Overview
- 18.2.9.2. Products
- 18.2.9.3. SWOT Analysis
- 18.2.9.4. Recent Developments
- 18.2.9.5. Financials (Based on Availability)
- 18.2.10 Thales Group
- 18.2.10.1. Overview
- 18.2.10.2. Products
- 18.2.10.3. SWOT Analysis
- 18.2.10.4. Recent Developments
- 18.2.10.5. Financials (Based on Availability)
- 18.2.11 Cisco Systems Inc
- 18.2.11.1. Overview
- 18.2.11.2. Products
- 18.2.11.3. SWOT Analysis
- 18.2.11.4. Recent Developments
- 18.2.11.5. Financials (Based on Availability)
- 18.2.12 Openwave Mobility Inc (ENEA)
- 18.2.12.1. Overview
- 18.2.12.2. Products
- 18.2.12.3. SWOT Analysis
- 18.2.12.4. Recent Developments
- 18.2.12.5. Financials (Based on Availability)
- 18.2.13 SAP SE
- 18.2.13.1. Overview
- 18.2.13.2. Products
- 18.2.13.3. SWOT Analysis
- 18.2.13.4. Recent Developments
- 18.2.13.5. Financials (Based on Availability)
- 18.2.14 Emu Analytics Ltd
- 18.2.14.1. Overview
- 18.2.14.2. Products
- 18.2.14.3. SWOT Analysis
- 18.2.14.4. Recent Developments
- 18.2.14.5. Financials (Based on Availability)
- 18.2.1 SAS Institute Inc
List of Figures
- Figure 1: Global Data Monetization Market Revenue Breakdown (Million, %) by Region 2024 & 2032
- Figure 2: Global Data Monetization Market Volume Breakdown (K Unit, %) by Region 2024 & 2032
- Figure 3: North America Data Monetization Market Revenue (Million), by Country 2024 & 2032
- Figure 4: North America Data Monetization Market Volume (K Unit), by Country 2024 & 2032
- Figure 5: North America Data Monetization Market Revenue Share (%), by Country 2024 & 2032
- Figure 6: North America Data Monetization Market Volume Share (%), by Country 2024 & 2032
- Figure 7: Europe Data Monetization Market Revenue (Million), by Country 2024 & 2032
- Figure 8: Europe Data Monetization Market Volume (K Unit), by Country 2024 & 2032
- Figure 9: Europe Data Monetization Market Revenue Share (%), by Country 2024 & 2032
- Figure 10: Europe Data Monetization Market Volume Share (%), by Country 2024 & 2032
- Figure 11: Asia Pacific Data Monetization Market Revenue (Million), by Country 2024 & 2032
- Figure 12: Asia Pacific Data Monetization Market Volume (K Unit), by Country 2024 & 2032
- Figure 13: Asia Pacific Data Monetization Market Revenue Share (%), by Country 2024 & 2032
- Figure 14: Asia Pacific Data Monetization Market Volume Share (%), by Country 2024 & 2032
- Figure 15: South America Data Monetization Market Revenue (Million), by Country 2024 & 2032
- Figure 16: South America Data Monetization Market Volume (K Unit), by Country 2024 & 2032
- Figure 17: South America Data Monetization Market Revenue Share (%), by Country 2024 & 2032
- Figure 18: South America Data Monetization Market Volume Share (%), by Country 2024 & 2032
- Figure 19: North America Data Monetization Market Revenue (Million), by Country 2024 & 2032
- Figure 20: North America Data Monetization Market Volume (K Unit), by Country 2024 & 2032
- Figure 21: North America Data Monetization Market Revenue Share (%), by Country 2024 & 2032
- Figure 22: North America Data Monetization Market Volume Share (%), by Country 2024 & 2032
- Figure 23: MEA Data Monetization Market Revenue (Million), by Country 2024 & 2032
- Figure 24: MEA Data Monetization Market Volume (K Unit), by Country 2024 & 2032
- Figure 25: MEA Data Monetization Market Revenue Share (%), by Country 2024 & 2032
- Figure 26: MEA Data Monetization Market Volume Share (%), by Country 2024 & 2032
- Figure 27: North America Data Monetization Market Revenue (Million), by Organization Size 2024 & 2032
- Figure 28: North America Data Monetization Market Volume (K Unit), by Organization Size 2024 & 2032
- Figure 29: North America Data Monetization Market Revenue Share (%), by Organization Size 2024 & 2032
- Figure 30: North America Data Monetization Market Volume Share (%), by Organization Size 2024 & 2032
- Figure 31: North America Data Monetization Market Revenue (Million), by End-user Industry 2024 & 2032
- Figure 32: North America Data Monetization Market Volume (K Unit), by End-user Industry 2024 & 2032
- Figure 33: North America Data Monetization Market Revenue Share (%), by End-user Industry 2024 & 2032
- Figure 34: North America Data Monetization Market Volume Share (%), by End-user Industry 2024 & 2032
- Figure 35: North America Data Monetization Market Revenue (Million), by Country 2024 & 2032
- Figure 36: North America Data Monetization Market Volume (K Unit), by Country 2024 & 2032
- Figure 37: North America Data Monetization Market Revenue Share (%), by Country 2024 & 2032
- Figure 38: North America Data Monetization Market Volume Share (%), by Country 2024 & 2032
- Figure 39: Europe Data Monetization Market Revenue (Million), by Organization Size 2024 & 2032
- Figure 40: Europe Data Monetization Market Volume (K Unit), by Organization Size 2024 & 2032
- Figure 41: Europe Data Monetization Market Revenue Share (%), by Organization Size 2024 & 2032
- Figure 42: Europe Data Monetization Market Volume Share (%), by Organization Size 2024 & 2032
- Figure 43: Europe Data Monetization Market Revenue (Million), by End-user Industry 2024 & 2032
- Figure 44: Europe Data Monetization Market Volume (K Unit), by End-user Industry 2024 & 2032
- Figure 45: Europe Data Monetization Market Revenue Share (%), by End-user Industry 2024 & 2032
- Figure 46: Europe Data Monetization Market Volume Share (%), by End-user Industry 2024 & 2032
- Figure 47: Europe Data Monetization Market Revenue (Million), by Country 2024 & 2032
- Figure 48: Europe Data Monetization Market Volume (K Unit), by Country 2024 & 2032
- Figure 49: Europe Data Monetization Market Revenue Share (%), by Country 2024 & 2032
- Figure 50: Europe Data Monetization Market Volume Share (%), by Country 2024 & 2032
- Figure 51: Asia Data Monetization Market Revenue (Million), by Organization Size 2024 & 2032
- Figure 52: Asia Data Monetization Market Volume (K Unit), by Organization Size 2024 & 2032
- Figure 53: Asia Data Monetization Market Revenue Share (%), by Organization Size 2024 & 2032
- Figure 54: Asia Data Monetization Market Volume Share (%), by Organization Size 2024 & 2032
- Figure 55: Asia Data Monetization Market Revenue (Million), by End-user Industry 2024 & 2032
- Figure 56: Asia Data Monetization Market Volume (K Unit), by End-user Industry 2024 & 2032
- Figure 57: Asia Data Monetization Market Revenue Share (%), by End-user Industry 2024 & 2032
- Figure 58: Asia Data Monetization Market Volume Share (%), by End-user Industry 2024 & 2032
- Figure 59: Asia Data Monetization Market Revenue (Million), by Country 2024 & 2032
- Figure 60: Asia Data Monetization Market Volume (K Unit), by Country 2024 & 2032
- Figure 61: Asia Data Monetization Market Revenue Share (%), by Country 2024 & 2032
- Figure 62: Asia Data Monetization Market Volume Share (%), by Country 2024 & 2032
- Figure 63: Australia and New Zealand Data Monetization Market Revenue (Million), by Organization Size 2024 & 2032
- Figure 64: Australia and New Zealand Data Monetization Market Volume (K Unit), by Organization Size 2024 & 2032
- Figure 65: Australia and New Zealand Data Monetization Market Revenue Share (%), by Organization Size 2024 & 2032
- Figure 66: Australia and New Zealand Data Monetization Market Volume Share (%), by Organization Size 2024 & 2032
- Figure 67: Australia and New Zealand Data Monetization Market Revenue (Million), by End-user Industry 2024 & 2032
- Figure 68: Australia and New Zealand Data Monetization Market Volume (K Unit), by End-user Industry 2024 & 2032
- Figure 69: Australia and New Zealand Data Monetization Market Revenue Share (%), by End-user Industry 2024 & 2032
- Figure 70: Australia and New Zealand Data Monetization Market Volume Share (%), by End-user Industry 2024 & 2032
- Figure 71: Australia and New Zealand Data Monetization Market Revenue (Million), by Country 2024 & 2032
- Figure 72: Australia and New Zealand Data Monetization Market Volume (K Unit), by Country 2024 & 2032
- Figure 73: Australia and New Zealand Data Monetization Market Revenue Share (%), by Country 2024 & 2032
- Figure 74: Australia and New Zealand Data Monetization Market Volume Share (%), by Country 2024 & 2032
- Figure 75: Latin America Data Monetization Market Revenue (Million), by Organization Size 2024 & 2032
- Figure 76: Latin America Data Monetization Market Volume (K Unit), by Organization Size 2024 & 2032
- Figure 77: Latin America Data Monetization Market Revenue Share (%), by Organization Size 2024 & 2032
- Figure 78: Latin America Data Monetization Market Volume Share (%), by Organization Size 2024 & 2032
- Figure 79: Latin America Data Monetization Market Revenue (Million), by End-user Industry 2024 & 2032
- Figure 80: Latin America Data Monetization Market Volume (K Unit), by End-user Industry 2024 & 2032
- Figure 81: Latin America Data Monetization Market Revenue Share (%), by End-user Industry 2024 & 2032
- Figure 82: Latin America Data Monetization Market Volume Share (%), by End-user Industry 2024 & 2032
- Figure 83: Latin America Data Monetization Market Revenue (Million), by Country 2024 & 2032
- Figure 84: Latin America Data Monetization Market Volume (K Unit), by Country 2024 & 2032
- Figure 85: Latin America Data Monetization Market Revenue Share (%), by Country 2024 & 2032
- Figure 86: Latin America Data Monetization Market Volume Share (%), by Country 2024 & 2032
- Figure 87: Middle East and Africa Data Monetization Market Revenue (Million), by Organization Size 2024 & 2032
- Figure 88: Middle East and Africa Data Monetization Market Volume (K Unit), by Organization Size 2024 & 2032
- Figure 89: Middle East and Africa Data Monetization Market Revenue Share (%), by Organization Size 2024 & 2032
- Figure 90: Middle East and Africa Data Monetization Market Volume Share (%), by Organization Size 2024 & 2032
- Figure 91: Middle East and Africa Data Monetization Market Revenue (Million), by End-user Industry 2024 & 2032
- Figure 92: Middle East and Africa Data Monetization Market Volume (K Unit), by End-user Industry 2024 & 2032
- Figure 93: Middle East and Africa Data Monetization Market Revenue Share (%), by End-user Industry 2024 & 2032
- Figure 94: Middle East and Africa Data Monetization Market Volume Share (%), by End-user Industry 2024 & 2032
- Figure 95: Middle East and Africa Data Monetization Market Revenue (Million), by Country 2024 & 2032
- Figure 96: Middle East and Africa Data Monetization Market Volume (K Unit), by Country 2024 & 2032
- Figure 97: Middle East and Africa Data Monetization Market Revenue Share (%), by Country 2024 & 2032
- Figure 98: Middle East and Africa Data Monetization Market Volume Share (%), by Country 2024 & 2032
List of Tables
- Table 1: Global Data Monetization Market Revenue Million Forecast, by Region 2019 & 2032
- Table 2: Global Data Monetization Market Volume K Unit Forecast, by Region 2019 & 2032
- Table 3: Global Data Monetization Market Revenue Million Forecast, by Organization Size 2019 & 2032
- Table 4: Global Data Monetization Market Volume K Unit Forecast, by Organization Size 2019 & 2032
- Table 5: Global Data Monetization Market Revenue Million Forecast, by End-user Industry 2019 & 2032
- Table 6: Global Data Monetization Market Volume K Unit Forecast, by End-user Industry 2019 & 2032
- Table 7: Global Data Monetization Market Revenue Million Forecast, by Region 2019 & 2032
- Table 8: Global Data Monetization Market Volume K Unit Forecast, by Region 2019 & 2032
- Table 9: Global Data Monetization Market Revenue Million Forecast, by Country 2019 & 2032
- Table 10: Global Data Monetization Market Volume K Unit Forecast, by Country 2019 & 2032
- Table 11: United States Data Monetization Market Revenue (Million) Forecast, by Application 2019 & 2032
- Table 12: United States Data Monetization Market Volume (K Unit) Forecast, by Application 2019 & 2032
- Table 13: Canada Data Monetization Market Revenue (Million) Forecast, by Application 2019 & 2032
- Table 14: Canada Data Monetization Market Volume (K Unit) Forecast, by Application 2019 & 2032
- Table 15: Mexico Data Monetization Market Revenue (Million) Forecast, by Application 2019 & 2032
- Table 16: Mexico Data Monetization Market Volume (K Unit) Forecast, by Application 2019 & 2032
- Table 17: Global Data Monetization Market Revenue Million Forecast, by Country 2019 & 2032
- Table 18: Global Data Monetization Market Volume K Unit Forecast, by Country 2019 & 2032
- Table 19: Germany Data Monetization Market Revenue (Million) Forecast, by Application 2019 & 2032
- Table 20: Germany Data Monetization Market Volume (K Unit) Forecast, by Application 2019 & 2032
- Table 21: United Kingdom Data Monetization Market Revenue (Million) Forecast, by Application 2019 & 2032
- Table 22: United Kingdom Data Monetization Market Volume (K Unit) Forecast, by Application 2019 & 2032
- Table 23: France Data Monetization Market Revenue (Million) Forecast, by Application 2019 & 2032
- Table 24: France Data Monetization Market Volume (K Unit) Forecast, by Application 2019 & 2032
- Table 25: Spain Data Monetization Market Revenue (Million) Forecast, by Application 2019 & 2032
- Table 26: Spain Data Monetization Market Volume (K Unit) Forecast, by Application 2019 & 2032
- Table 27: Italy Data Monetization Market Revenue (Million) Forecast, by Application 2019 & 2032
- Table 28: Italy Data Monetization Market Volume (K Unit) Forecast, by Application 2019 & 2032
- Table 29: Spain Data Monetization Market Revenue (Million) Forecast, by Application 2019 & 2032
- Table 30: Spain Data Monetization Market Volume (K Unit) Forecast, by Application 2019 & 2032
- Table 31: Belgium Data Monetization Market Revenue (Million) Forecast, by Application 2019 & 2032
- Table 32: Belgium Data Monetization Market Volume (K Unit) Forecast, by Application 2019 & 2032
- Table 33: Netherland Data Monetization Market Revenue (Million) Forecast, by Application 2019 & 2032
- Table 34: Netherland Data Monetization Market Volume (K Unit) Forecast, by Application 2019 & 2032
- Table 35: Nordics Data Monetization Market Revenue (Million) Forecast, by Application 2019 & 2032
- Table 36: Nordics Data Monetization Market Volume (K Unit) Forecast, by Application 2019 & 2032
- Table 37: Rest of Europe Data Monetization Market Revenue (Million) Forecast, by Application 2019 & 2032
- Table 38: Rest of Europe Data Monetization Market Volume (K Unit) Forecast, by Application 2019 & 2032
- Table 39: Global Data Monetization Market Revenue Million Forecast, by Country 2019 & 2032
- Table 40: Global Data Monetization Market Volume K Unit Forecast, by Country 2019 & 2032
- Table 41: China Data Monetization Market Revenue (Million) Forecast, by Application 2019 & 2032
- Table 42: China Data Monetization Market Volume (K Unit) Forecast, by Application 2019 & 2032
- Table 43: Japan Data Monetization Market Revenue (Million) Forecast, by Application 2019 & 2032
- Table 44: Japan Data Monetization Market Volume (K Unit) Forecast, by Application 2019 & 2032
- Table 45: India Data Monetization Market Revenue (Million) Forecast, by Application 2019 & 2032
- Table 46: India Data Monetization Market Volume (K Unit) Forecast, by Application 2019 & 2032
- Table 47: South Korea Data Monetization Market Revenue (Million) Forecast, by Application 2019 & 2032
- Table 48: South Korea Data Monetization Market Volume (K Unit) Forecast, by Application 2019 & 2032
- Table 49: Southeast Asia Data Monetization Market Revenue (Million) Forecast, by Application 2019 & 2032
- Table 50: Southeast Asia Data Monetization Market Volume (K Unit) Forecast, by Application 2019 & 2032
- Table 51: Australia Data Monetization Market Revenue (Million) Forecast, by Application 2019 & 2032
- Table 52: Australia Data Monetization Market Volume (K Unit) Forecast, by Application 2019 & 2032
- Table 53: Indonesia Data Monetization Market Revenue (Million) Forecast, by Application 2019 & 2032
- Table 54: Indonesia Data Monetization Market Volume (K Unit) Forecast, by Application 2019 & 2032
- Table 55: Phillipes Data Monetization Market Revenue (Million) Forecast, by Application 2019 & 2032
- Table 56: Phillipes Data Monetization Market Volume (K Unit) Forecast, by Application 2019 & 2032
- Table 57: Singapore Data Monetization Market Revenue (Million) Forecast, by Application 2019 & 2032
- Table 58: Singapore Data Monetization Market Volume (K Unit) Forecast, by Application 2019 & 2032
- Table 59: Thailandc Data Monetization Market Revenue (Million) Forecast, by Application 2019 & 2032
- Table 60: Thailandc Data Monetization Market Volume (K Unit) Forecast, by Application 2019 & 2032
- Table 61: Rest of Asia Pacific Data Monetization Market Revenue (Million) Forecast, by Application 2019 & 2032
- Table 62: Rest of Asia Pacific Data Monetization Market Volume (K Unit) Forecast, by Application 2019 & 2032
- Table 63: Global Data Monetization Market Revenue Million Forecast, by Country 2019 & 2032
- Table 64: Global Data Monetization Market Volume K Unit Forecast, by Country 2019 & 2032
- Table 65: Brazil Data Monetization Market Revenue (Million) Forecast, by Application 2019 & 2032
- Table 66: Brazil Data Monetization Market Volume (K Unit) Forecast, by Application 2019 & 2032
- Table 67: Argentina Data Monetization Market Revenue (Million) Forecast, by Application 2019 & 2032
- Table 68: Argentina Data Monetization Market Volume (K Unit) Forecast, by Application 2019 & 2032
- Table 69: Peru Data Monetization Market Revenue (Million) Forecast, by Application 2019 & 2032
- Table 70: Peru Data Monetization Market Volume (K Unit) Forecast, by Application 2019 & 2032
- Table 71: Chile Data Monetization Market Revenue (Million) Forecast, by Application 2019 & 2032
- Table 72: Chile Data Monetization Market Volume (K Unit) Forecast, by Application 2019 & 2032
- Table 73: Colombia Data Monetization Market Revenue (Million) Forecast, by Application 2019 & 2032
- Table 74: Colombia Data Monetization Market Volume (K Unit) Forecast, by Application 2019 & 2032
- Table 75: Ecuador Data Monetization Market Revenue (Million) Forecast, by Application 2019 & 2032
- Table 76: Ecuador Data Monetization Market Volume (K Unit) Forecast, by Application 2019 & 2032
- Table 77: Venezuela Data Monetization Market Revenue (Million) Forecast, by Application 2019 & 2032
- Table 78: Venezuela Data Monetization Market Volume (K Unit) Forecast, by Application 2019 & 2032
- Table 79: Rest of South America Data Monetization Market Revenue (Million) Forecast, by Application 2019 & 2032
- Table 80: Rest of South America Data Monetization Market Volume (K Unit) Forecast, by Application 2019 & 2032
- Table 81: Global Data Monetization Market Revenue Million Forecast, by Country 2019 & 2032
- Table 82: Global Data Monetization Market Volume K Unit Forecast, by Country 2019 & 2032
- Table 83: United States Data Monetization Market Revenue (Million) Forecast, by Application 2019 & 2032
- Table 84: United States Data Monetization Market Volume (K Unit) Forecast, by Application 2019 & 2032
- Table 85: Canada Data Monetization Market Revenue (Million) Forecast, by Application 2019 & 2032
- Table 86: Canada Data Monetization Market Volume (K Unit) Forecast, by Application 2019 & 2032
- Table 87: Mexico Data Monetization Market Revenue (Million) Forecast, by Application 2019 & 2032
- Table 88: Mexico Data Monetization Market Volume (K Unit) Forecast, by Application 2019 & 2032
- Table 89: Global Data Monetization Market Revenue Million Forecast, by Country 2019 & 2032
- Table 90: Global Data Monetization Market Volume K Unit Forecast, by Country 2019 & 2032
- Table 91: United Arab Emirates Data Monetization Market Revenue (Million) Forecast, by Application 2019 & 2032
- Table 92: United Arab Emirates Data Monetization Market Volume (K Unit) Forecast, by Application 2019 & 2032
- Table 93: Saudi Arabia Data Monetization Market Revenue (Million) Forecast, by Application 2019 & 2032
- Table 94: Saudi Arabia Data Monetization Market Volume (K Unit) Forecast, by Application 2019 & 2032
- Table 95: South Africa Data Monetization Market Revenue (Million) Forecast, by Application 2019 & 2032
- Table 96: South Africa Data Monetization Market Volume (K Unit) Forecast, by Application 2019 & 2032
- Table 97: Rest of Middle East and Africa Data Monetization Market Revenue (Million) Forecast, by Application 2019 & 2032
- Table 98: Rest of Middle East and Africa Data Monetization Market Volume (K Unit) Forecast, by Application 2019 & 2032
- Table 99: Global Data Monetization Market Revenue Million Forecast, by Organization Size 2019 & 2032
- Table 100: Global Data Monetization Market Volume K Unit Forecast, by Organization Size 2019 & 2032
- Table 101: Global Data Monetization Market Revenue Million Forecast, by End-user Industry 2019 & 2032
- Table 102: Global Data Monetization Market Volume K Unit Forecast, by End-user Industry 2019 & 2032
- Table 103: Global Data Monetization Market Revenue Million Forecast, by Country 2019 & 2032
- Table 104: Global Data Monetization Market Volume K Unit Forecast, by Country 2019 & 2032
- Table 105: Global Data Monetization Market Revenue Million Forecast, by Organization Size 2019 & 2032
- Table 106: Global Data Monetization Market Volume K Unit Forecast, by Organization Size 2019 & 2032
- Table 107: Global Data Monetization Market Revenue Million Forecast, by End-user Industry 2019 & 2032
- Table 108: Global Data Monetization Market Volume K Unit Forecast, by End-user Industry 2019 & 2032
- Table 109: Global Data Monetization Market Revenue Million Forecast, by Country 2019 & 2032
- Table 110: Global Data Monetization Market Volume K Unit Forecast, by Country 2019 & 2032
- Table 111: Global Data Monetization Market Revenue Million Forecast, by Organization Size 2019 & 2032
- Table 112: Global Data Monetization Market Volume K Unit Forecast, by Organization Size 2019 & 2032
- Table 113: Global Data Monetization Market Revenue Million Forecast, by End-user Industry 2019 & 2032
- Table 114: Global Data Monetization Market Volume K Unit Forecast, by End-user Industry 2019 & 2032
- Table 115: Global Data Monetization Market Revenue Million Forecast, by Country 2019 & 2032
- Table 116: Global Data Monetization Market Volume K Unit Forecast, by Country 2019 & 2032
- Table 117: Global Data Monetization Market Revenue Million Forecast, by Organization Size 2019 & 2032
- Table 118: Global Data Monetization Market Volume K Unit Forecast, by Organization Size 2019 & 2032
- Table 119: Global Data Monetization Market Revenue Million Forecast, by End-user Industry 2019 & 2032
- Table 120: Global Data Monetization Market Volume K Unit Forecast, by End-user Industry 2019 & 2032
- Table 121: Global Data Monetization Market Revenue Million Forecast, by Country 2019 & 2032
- Table 122: Global Data Monetization Market Volume K Unit Forecast, by Country 2019 & 2032
- Table 123: Global Data Monetization Market Revenue Million Forecast, by Organization Size 2019 & 2032
- Table 124: Global Data Monetization Market Volume K Unit Forecast, by Organization Size 2019 & 2032
- Table 125: Global Data Monetization Market Revenue Million Forecast, by End-user Industry 2019 & 2032
- Table 126: Global Data Monetization Market Volume K Unit Forecast, by End-user Industry 2019 & 2032
- Table 127: Global Data Monetization Market Revenue Million Forecast, by Country 2019 & 2032
- Table 128: Global Data Monetization Market Volume K Unit Forecast, by Country 2019 & 2032
- Table 129: Global Data Monetization Market Revenue Million Forecast, by Organization Size 2019 & 2032
- Table 130: Global Data Monetization Market Volume K Unit Forecast, by Organization Size 2019 & 2032
- Table 131: Global Data Monetization Market Revenue Million Forecast, by End-user Industry 2019 & 2032
- Table 132: Global Data Monetization Market Volume K Unit Forecast, by End-user Industry 2019 & 2032
- Table 133: Global Data Monetization Market Revenue Million Forecast, by Country 2019 & 2032
- Table 134: Global Data Monetization Market Volume K Unit Forecast, by Country 2019 & 2032
Frequently Asked Questions
1. What is the projected Compound Annual Growth Rate (CAGR) of the Data Monetization Market?
The projected CAGR is approximately 19.94%.
2. Which companies are prominent players in the Data Monetization Market?
Key companies in the market include SAS Institute Inc, Adastra Corporation, Infosys Limited, Accenture PLC, IBM Corporation, NetScout Systems Inc, Dawex Systems SAS, Ness Technologies Inc, Google LLC (Alphabet Inc ), Thales Group, Cisco Systems Inc, Openwave Mobility Inc (ENEA), SAP SE, Emu Analytics Ltd.
3. What are the main segments of the Data Monetization Market?
The market segments include Organization Size, End-user Industry.
4. Can you provide details about the market size?
The market size is estimated to be USD 4.17 Million as of 2022.
5. What are some drivers contributing to market growth?
Rapid Adoption of Advanced Analytics and Visualization; Increasing Volume and Variety of Business Data.
6. What are the notable trends driving market growth?
Large Enterprises to Hold Major Market Share.
7. Are there any restraints impacting market growth?
Interoperability With Existing Systems; Varying Structure of Regulatory Policies.
8. Can you provide examples of recent developments in the market?
April 2024: Carv, a data layer platform that lets web3 gaming apps, AI companies, and gamers control and monetize their data, raised a USD 10 million series A round led by Tribe Capital and IOSG Ventures. The company differentiates itself by empowering users with data ownership and monetization rights, which are expected to support the market growth during the forecast period.
9. What pricing options are available for accessing the report?
Pricing options include single-user, multi-user, and enterprise licenses priced at USD 4750, USD 5250, and USD 8750 respectively.
10. Is the market size provided in terms of value or volume?
The market size is provided in terms of value, measured in Million and volume, measured in K Unit.
11. Are there any specific market keywords associated with the report?
Yes, the market keyword associated with the report is "Data Monetization Market," which aids in identifying and referencing the specific market segment covered.
12. How do I determine which pricing option suits my needs best?
The pricing options vary based on user requirements and access needs. Individual users may opt for single-user licenses, while businesses requiring broader access may choose multi-user or enterprise licenses for cost-effective access to the report.
13. Are there any additional resources or data provided in the Data Monetization Market report?
While the report offers comprehensive insights, it's advisable to review the specific contents or supplementary materials provided to ascertain if additional resources or data are available.
14. How can I stay updated on further developments or reports in the Data Monetization Market?
To stay informed about further developments, trends, and reports in the Data Monetization Market, consider subscribing to industry newsletters, following relevant companies and organizations, or regularly checking reputable industry news sources and publications.
Methodology
Step 1 - Identification of Relevant Samples Size from Population Database


Step 2 - Approaches for Defining Global Market Size (Value, Volume* & Price*)

Note*: In applicable scenarios
Step 3 - Data Sources
Primary Research
- Web Analytics
- Survey Reports
- Research Institute
- Latest Research Reports
- Opinion Leaders
Secondary Research
- Annual Reports
- White Paper
- Latest Press Release
- Industry Association
- Paid Database
- Investor Presentations

Step 4 - Data Triangulation
Involves using different sources of information in order to increase the validity of a study
These sources are likely to be stakeholders in a program - participants, other researchers, program staff, other community members, and so on.
Then we put all data in single framework & apply various statistical tools to find out the dynamic on the market.
During the analysis stage, feedback from the stakeholder groups would be compared to determine areas of agreement as well as areas of divergence


