
Key Insights
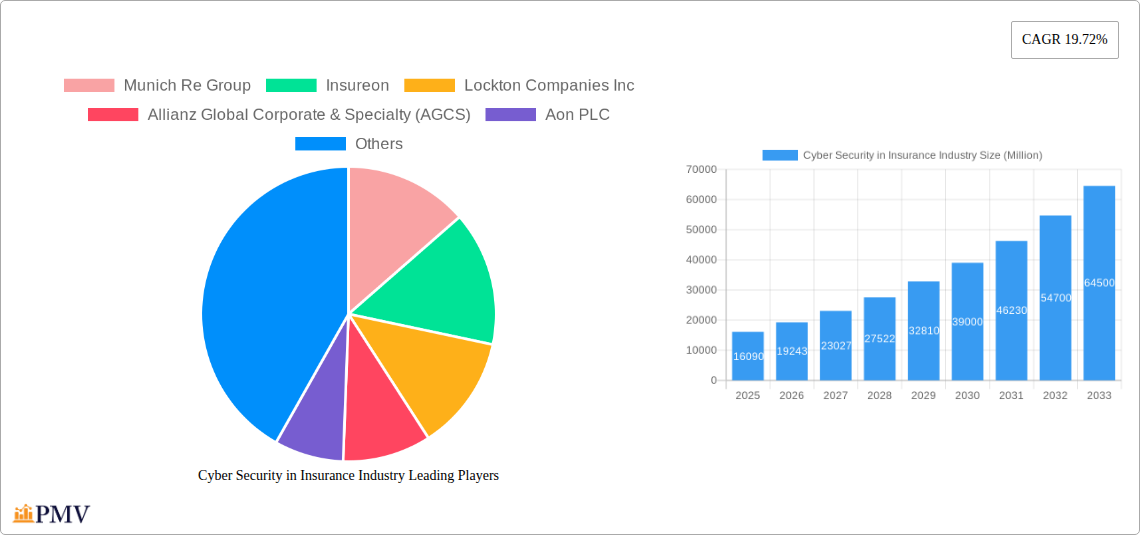
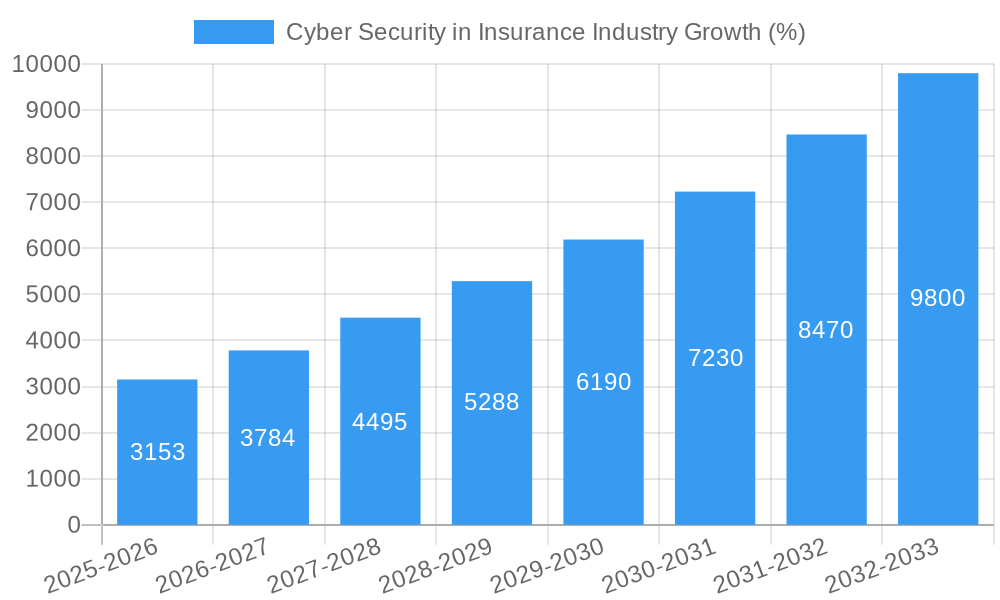
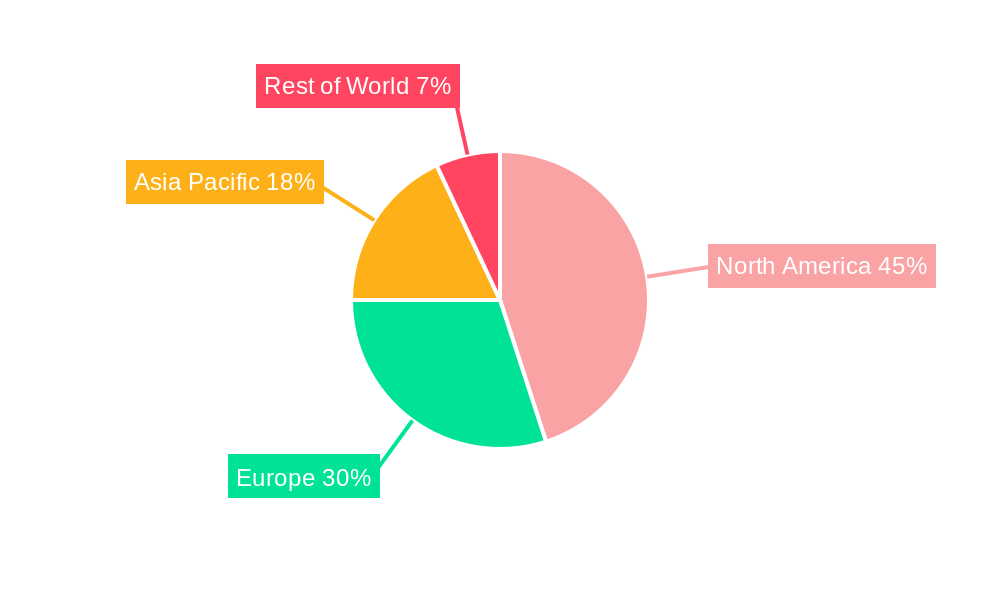
The cybersecurity insurance market is experiencing robust growth, projected to reach \$16.09 billion in 2025 and exhibiting a Compound Annual Growth Rate (CAGR) of 19.72% from 2025 to 2033. This expansion is driven by the increasing frequency and severity of cyberattacks targeting insurance companies and their clients, coupled with escalating regulatory pressure demanding enhanced data protection. The rising adoption of digital technologies across various sectors—healthcare, BFSI (Banking, Financial Services, and Insurance), retail, and manufacturing—fuels demand for robust cybersecurity solutions and, consequently, insurance coverage. Large enterprises, with their extensive digital footprints and valuable data assets, represent a significant market segment, but SMEs are also increasingly recognizing the critical need for cyber insurance as they become more vulnerable to sophisticated attacks. Competition is fierce among established players like Munich Re Group, Allianz, Aon, and Chubb, alongside emerging cybersecurity specialists like Security Scorecard. Geographic growth is expected across North America (particularly the US), Europe (driven by strong regulatory frameworks like GDPR), and Asia-Pacific (fueled by digital transformation in rapidly developing economies like India and China).
The market's trajectory suggests continued strong growth, driven by factors such as the evolution of cyber threats (e.g., ransomware, advanced persistent threats), increasing interconnectedness of systems, and the growing awareness of potential financial and reputational damage from breaches. However, challenges remain, including the difficulty in accurately assessing cyber risk, the complexity of insurance policies, and the potential for coverage gaps. Insurers are actively developing innovative solutions, including proactive security assessments and risk management services, to address these challenges and better serve their clients. The future landscape will likely see further consolidation among insurers, increased collaboration between insurers and cybersecurity providers, and the emergence of more tailored and sophisticated cyber insurance products catering to the specific needs of different industries and organizational sizes.
This comprehensive report provides a detailed analysis of the Cyber Security in Insurance Industry market, offering invaluable insights for stakeholders across the value chain. With a study period spanning 2019-2033, a base year of 2025, and a forecast period of 2025-2033, this report leverages historical data (2019-2024) to project future market trends and growth opportunities. The market is segmented by end-user industry (Healthcare, Retail, BFSI, IT and Telecom, Manufacturing, Other) and organization size (SMEs, Large Enterprises). The report values this market at $xx Million in 2025 and projects a CAGR of xx% during the forecast period, reaching $xx Million by 2033. Key players analyzed include Munich Re Group, Insureon, Lockton Companies Inc, Allianz Global Corporate & Specialty (AGCS), Aon PLC, Security Scorecard Inc, American International Group Inc, Zurich Insurance Co Ltd, The Chubb Corporation, Berkshire Hathaway Inc, and AXA XL.
Cyber Security in Insurance Industry Market Structure & Competitive Dynamics
The cyber security in insurance market exhibits a moderately concentrated structure, with a few large multinational players holding significant market share. Companies like Munich Re Group, Allianz, and Aon PLC command substantial portions of the market, particularly in the large enterprise segment. However, the landscape is dynamic, with smaller, specialized firms focusing on niche areas such as SME solutions or specific industry verticals. The market's competitive intensity is high, driven by factors like technological innovation, regulatory changes, and the ever-evolving threat landscape.
- Market Concentration: The top 5 players collectively hold an estimated xx% market share in 2025.
- Innovation Ecosystems: Significant investments in R&D and strategic partnerships are fostering innovation, especially in areas like AI-driven threat detection and blockchain-based security solutions.
- Regulatory Frameworks: Increasingly stringent data privacy regulations (like GDPR and CCPA) are driving demand for robust cyber security solutions, particularly in sectors like BFSI and Healthcare.
- Product Substitutes: While dedicated cyber security solutions are preferred, alternative approaches like cloud-based security services sometimes act as substitutes, especially for SMEs.
- End-user Trends: Growing awareness of cyber threats, coupled with rising data breaches, is pushing organizations across various sectors to prioritize cyber security investments.
- M&A Activities: The market has witnessed significant M&A activity in recent years, with deal values exceeding $xx Million annually. Consolidation is expected to continue, driving further market concentration. Examples include (Insert examples if available, or state "Data unavailable for specific M&A deals").
Cyber Security in Insurance Industry Industry Trends & Insights
The global cyber security in insurance market is experiencing robust growth, fueled by a multitude of factors. The increasing frequency and severity of cyberattacks, coupled with stricter regulatory compliance requirements, are compelling businesses to significantly ramp up their investments in cyber security solutions. Technological advancements, such as AI and machine learning, are revolutionizing threat detection and response capabilities, further propelling market expansion. Shifting consumer preferences toward comprehensive cyber security coverage, as evident in rising demand for bundled solutions and enhanced insurance policies, is another significant growth driver. The competitive landscape is characterized by intense rivalry, with established players and new entrants vying for market share through product innovation, strategic partnerships, and acquisitions. The market's growth trajectory is projected to remain positive, with a Compound Annual Growth Rate (CAGR) of xx% between 2025 and 2033, driven primarily by the increasing adoption of sophisticated security solutions and a surge in cyber insurance policies. Market penetration for advanced threat detection solutions is currently at xx% and is estimated to reach xx% by 2033.
Dominant Markets & Segments in Cyber Security in Insurance Industry
Leading Region/Country: North America currently dominates the global market, driven by high technological adoption, stringent regulatory frameworks, and a substantial concentration of key players. Europe follows closely, also driven by strong regulatory pressure and heightened cyber security awareness.
- End-user Industry:
- BFSI: This sector displays the highest demand due to the sensitive nature of financial data and the significant impact of breaches.
- Healthcare: Increasingly stringent HIPAA regulations and the sensitive nature of patient data are contributing to significant growth.
- IT and Telecom: High reliance on digital infrastructure makes this sector highly vulnerable and necessitates robust security.
- Organization Size:
- Large Enterprises: These organizations have higher budgets and advanced security needs, leading to significant market share.
- SMEs: Growing awareness of cyber risks and the availability of more affordable solutions are driving significant growth in this segment.
Key Drivers (per segment):
- BFSI: Stringent regulatory compliance (e.g., GDPR, CCPA), increasing digitalization, and the value of financial data.
- Healthcare: HIPAA compliance, sensitive patient data, and the increasing use of connected medical devices.
- Large Enterprises: Higher budgets, sophisticated security requirements, and the need to protect critical infrastructure.
- SMEs: Rising cyber threat awareness, availability of affordable solutions, and government incentives.
The dominance of North America is attributed to the region's robust economy, well-established infrastructure, and concentration of major players. Europe's strong regulatory framework and increasing cyber security awareness also propel market growth in the region.
Cyber Security in Insurance Industry Product Innovations
Recent innovations in cyber security for the insurance industry include the integration of AI and machine learning for advanced threat detection, behavioral analytics for fraud prevention, and blockchain technology for secure data management. These advancements offer enhanced threat detection accuracy, faster incident response times, and improved data protection capabilities. The market fit is strong, driven by the increasing need for proactive, rather than reactive, security measures. The development of comprehensive, bundled solutions that integrate insurance coverage with cybersecurity technologies is also gaining traction, especially among SMEs.
Report Segmentation & Scope
The report segments the market by:
End-user Industry: Healthcare, Retail, BFSI, IT and Telecom, Manufacturing, Other End-user Industries. Growth projections vary significantly across sectors, with BFSI and Healthcare anticipated to lead growth due to regulatory pressure and sensitive data. Competitive dynamics vary by industry, with specific solutions tailored to the unique needs of each sector.
Organization Size: Small and Medium Enterprises (SMEs) and Large Enterprises. SMEs are projected to experience faster growth due to increasing affordability and awareness of cybersecurity risks. Large enterprises will continue to hold a larger market share due to their high security budgets and needs.
Key Drivers of Cyber Security in Insurance Industry Growth
Several factors fuel the market's growth. Technological advancements, like AI-powered threat detection and blockchain for data security, enhance security capabilities and drive adoption. The increasing frequency and severity of cyberattacks necessitate robust security solutions, fostering market expansion. Stringent government regulations and compliance mandates, like GDPR and HIPAA, further propel demand for advanced security measures. Moreover, the rising awareness of cyber risks among businesses of all sizes fuels demand for both preventative measures and cyber insurance.
Challenges in the Cyber Security in Insurance Industry Sector
The sector faces several challenges. The ever-evolving nature of cyber threats necessitates continuous adaptation and investment in new technologies, presenting an ongoing financial burden. The complexities of integrating diverse security solutions across an organization can hinder effective implementation. The shortage of skilled cybersecurity professionals also limits the sector's growth and development. Regulatory compliance requirements can be complex and expensive, placing a significant burden on organizations, especially SMEs.
Leading Players in the Cyber Security in Insurance Industry Market
- Munich Re Group
- Insureon
- Lockton Companies Inc
- Allianz Global Corporate & Specialty (AGCS)
- Aon PLC
- Security Scorecard Inc
- American International Group Inc
- Zurich Insurance Co Ltd
- The Chubb Corporation
- Berkshire Hathaway Inc
- AXA XL
Key Developments in Cyber Security in Insurance Industry Sector
September 2022: The Coalition, a cyber insurer, expanded its services to the UK market after achieving significant success in the USA, offering comprehensive cyber risk management solutions to SMEs. This significantly increased market competition and provided more options for SMEs.
August 2022: SolCyber's partnership with Converge Insurance enhanced cyber insurance coverage and streamlined the application process for SMEs, fostering improved security posture and reduced business risks. This partnership demonstrates the growing collaboration between cybersecurity providers and insurers to offer more comprehensive solutions.
Strategic Cyber Security in Insurance Industry Market Outlook
The future of the cyber security in insurance market appears promising, with continued growth driven by increasing cyber threats, stringent regulations, and technological advancements. Strategic opportunities lie in developing innovative, integrated solutions that combine insurance coverage with advanced cybersecurity technologies. Focusing on niche market segments, such as SMEs or specific industry verticals, can also yield significant returns. The market's expansion will necessitate strategic partnerships and collaborations across the cybersecurity and insurance ecosystems to offer truly comprehensive and effective solutions.
Cyber Security in Insurance Industry Segmentation
-
1. Organization Size
- 1.1. Large Enterprises
- 1.2. Small and Medium Enterprises
-
2. End-user Industry
- 2.1. Retail
- 2.2. BFSI
- 2.3. Healthcare
- 2.4. Manufacturing
Cyber Security in Insurance Industry Segmentation By Geography
-
1. North America
- 1.1. United States
- 1.2. Canada
-
2. Europe
- 2.1. Germany
- 2.2. United Kingdom
- 2.3. France
-
3. Asia
- 3.1. India
- 3.2. China
- 3.3. Japan
- 3.4. Singapore
- 3.5. Australia and New Zealand
-
4. Latin America
- 4.1. Brazil
- 4.2. Argentina
- 4.3. Rest of South America
-
5. Middle East and Africa
- 5.1. UAE
- 5.2. South Africa
- 5.3. Saudi Arabia
- 5.4. Rest Of MEA
Cyber Security in Insurance Industry REPORT HIGHLIGHTS
| Aspects | Details |
|---|---|
| Study Period | 2019-2033 |
| Base Year | 2024 |
| Estimated Year | 2025 |
| Forecast Period | 2025-2033 |
| Historical Period | 2019-2024 |
| Growth Rate | CAGR of 19.72% from 2019-2033 |
| Segmentation |
|
Table of Contents
- 1. Introduction
- 1.1. Research Scope
- 1.2. Market Segmentation
- 1.3. Research Methodology
- 1.4. Definitions and Assumptions
- 2. Executive Summary
- 2.1. Introduction
- 3. Market Dynamics
- 3.1. Introduction
- 3.2. Market Drivers
- 3.2.1. Increasing Adoption of Cloud-based Services; Rising Data Security Breaches
- 3.3. Market Restrains
- 3.3.1. Difficulties in Implementing Cyber Insurance and High Costs
- 3.4. Market Trends
- 3.4.1. The BFSI Segment is Estimated to Hold a Significant Share
- 4. Market Factor Analysis
- 4.1. Porters Five Forces
- 4.2. Supply/Value Chain
- 4.3. PESTEL analysis
- 4.4. Market Entropy
- 4.5. Patent/Trademark Analysis
- 5. Global Cyber Security in Insurance Industry Analysis, Insights and Forecast, 2019-2031
- 5.1. Market Analysis, Insights and Forecast - by Organization Size
- 5.1.1. Large Enterprises
- 5.1.2. Small and Medium Enterprises
- 5.2. Market Analysis, Insights and Forecast - by End-user Industry
- 5.2.1. Retail
- 5.2.2. BFSI
- 5.2.3. Healthcare
- 5.2.4. Manufacturing
- 5.3. Market Analysis, Insights and Forecast - by Region
- 5.3.1. North America
- 5.3.2. Europe
- 5.3.3. Asia
- 5.3.4. Latin America
- 5.3.5. Middle East and Africa
- 5.1. Market Analysis, Insights and Forecast - by Organization Size
- 6. North America Cyber Security in Insurance Industry Analysis, Insights and Forecast, 2019-2031
- 6.1. Market Analysis, Insights and Forecast - by Organization Size
- 6.1.1. Large Enterprises
- 6.1.2. Small and Medium Enterprises
- 6.2. Market Analysis, Insights and Forecast - by End-user Industry
- 6.2.1. Retail
- 6.2.2. BFSI
- 6.2.3. Healthcare
- 6.2.4. Manufacturing
- 6.1. Market Analysis, Insights and Forecast - by Organization Size
- 7. Europe Cyber Security in Insurance Industry Analysis, Insights and Forecast, 2019-2031
- 7.1. Market Analysis, Insights and Forecast - by Organization Size
- 7.1.1. Large Enterprises
- 7.1.2. Small and Medium Enterprises
- 7.2. Market Analysis, Insights and Forecast - by End-user Industry
- 7.2.1. Retail
- 7.2.2. BFSI
- 7.2.3. Healthcare
- 7.2.4. Manufacturing
- 7.1. Market Analysis, Insights and Forecast - by Organization Size
- 8. Asia Cyber Security in Insurance Industry Analysis, Insights and Forecast, 2019-2031
- 8.1. Market Analysis, Insights and Forecast - by Organization Size
- 8.1.1. Large Enterprises
- 8.1.2. Small and Medium Enterprises
- 8.2. Market Analysis, Insights and Forecast - by End-user Industry
- 8.2.1. Retail
- 8.2.2. BFSI
- 8.2.3. Healthcare
- 8.2.4. Manufacturing
- 8.1. Market Analysis, Insights and Forecast - by Organization Size
- 9. Latin America Cyber Security in Insurance Industry Analysis, Insights and Forecast, 2019-2031
- 9.1. Market Analysis, Insights and Forecast - by Organization Size
- 9.1.1. Large Enterprises
- 9.1.2. Small and Medium Enterprises
- 9.2. Market Analysis, Insights and Forecast - by End-user Industry
- 9.2.1. Retail
- 9.2.2. BFSI
- 9.2.3. Healthcare
- 9.2.4. Manufacturing
- 9.1. Market Analysis, Insights and Forecast - by Organization Size
- 10. Middle East and Africa Cyber Security in Insurance Industry Analysis, Insights and Forecast, 2019-2031
- 10.1. Market Analysis, Insights and Forecast - by Organization Size
- 10.1.1. Large Enterprises
- 10.1.2. Small and Medium Enterprises
- 10.2. Market Analysis, Insights and Forecast - by End-user Industry
- 10.2.1. Retail
- 10.2.2. BFSI
- 10.2.3. Healthcare
- 10.2.4. Manufacturing
- 10.1. Market Analysis, Insights and Forecast - by Organization Size
- 11. North America Cyber Security in Insurance Industry Analysis, Insights and Forecast, 2019-2031
- 11.1. Market Analysis, Insights and Forecast - By Country/Sub-region
- 11.1.1 United States
- 11.1.2 Canada
- 11.1.3 Mexico
- 12. Europe Cyber Security in Insurance Industry Analysis, Insights and Forecast, 2019-2031
- 12.1. Market Analysis, Insights and Forecast - By Country/Sub-region
- 12.1.1 Germany
- 12.1.2 United Kingdom
- 12.1.3 France
- 12.1.4 Spain
- 12.1.5 Italy
- 12.1.6 Spain
- 12.1.7 Belgium
- 12.1.8 Netherland
- 12.1.9 Nordics
- 12.1.10 Rest of Europe
- 13. Asia Pacific Cyber Security in Insurance Industry Analysis, Insights and Forecast, 2019-2031
- 13.1. Market Analysis, Insights and Forecast - By Country/Sub-region
- 13.1.1 China
- 13.1.2 Japan
- 13.1.3 India
- 13.1.4 South Korea
- 13.1.5 Southeast Asia
- 13.1.6 Australia
- 13.1.7 Indonesia
- 13.1.8 Phillipes
- 13.1.9 Singapore
- 13.1.10 Thailandc
- 13.1.11 Rest of Asia Pacific
- 14. South America Cyber Security in Insurance Industry Analysis, Insights and Forecast, 2019-2031
- 14.1. Market Analysis, Insights and Forecast - By Country/Sub-region
- 14.1.1 Brazil
- 14.1.2 Argentina
- 14.1.3 Peru
- 14.1.4 Chile
- 14.1.5 Colombia
- 14.1.6 Ecuador
- 14.1.7 Venezuela
- 14.1.8 Rest of South America
- 15. North America Cyber Security in Insurance Industry Analysis, Insights and Forecast, 2019-2031
- 15.1. Market Analysis, Insights and Forecast - By Country/Sub-region
- 15.1.1 United States
- 15.1.2 Canada
- 15.1.3 Mexico
- 16. MEA Cyber Security in Insurance Industry Analysis, Insights and Forecast, 2019-2031
- 16.1. Market Analysis, Insights and Forecast - By Country/Sub-region
- 16.1.1 United Arab Emirates
- 16.1.2 Saudi Arabia
- 16.1.3 South Africa
- 16.1.4 Rest of Middle East and Africa
- 17. Competitive Analysis
- 17.1. Global Market Share Analysis 2024
- 17.2. Company Profiles
- 17.2.1 Munich Re Group
- 17.2.1.1. Overview
- 17.2.1.2. Products
- 17.2.1.3. SWOT Analysis
- 17.2.1.4. Recent Developments
- 17.2.1.5. Financials (Based on Availability)
- 17.2.2 Insureon
- 17.2.2.1. Overview
- 17.2.2.2. Products
- 17.2.2.3. SWOT Analysis
- 17.2.2.4. Recent Developments
- 17.2.2.5. Financials (Based on Availability)
- 17.2.3 Lockton Companies Inc
- 17.2.3.1. Overview
- 17.2.3.2. Products
- 17.2.3.3. SWOT Analysis
- 17.2.3.4. Recent Developments
- 17.2.3.5. Financials (Based on Availability)
- 17.2.4 Allianz Global Corporate & Specialty (AGCS)
- 17.2.4.1. Overview
- 17.2.4.2. Products
- 17.2.4.3. SWOT Analysis
- 17.2.4.4. Recent Developments
- 17.2.4.5. Financials (Based on Availability)
- 17.2.5 Aon PLC
- 17.2.5.1. Overview
- 17.2.5.2. Products
- 17.2.5.3. SWOT Analysis
- 17.2.5.4. Recent Developments
- 17.2.5.5. Financials (Based on Availability)
- 17.2.6 Security Scorecard Inc
- 17.2.6.1. Overview
- 17.2.6.2. Products
- 17.2.6.3. SWOT Analysis
- 17.2.6.4. Recent Developments
- 17.2.6.5. Financials (Based on Availability)
- 17.2.7 American International Group Inc
- 17.2.7.1. Overview
- 17.2.7.2. Products
- 17.2.7.3. SWOT Analysis
- 17.2.7.4. Recent Developments
- 17.2.7.5. Financials (Based on Availability)
- 17.2.8 Zurich Insurance Co Ltd
- 17.2.8.1. Overview
- 17.2.8.2. Products
- 17.2.8.3. SWOT Analysis
- 17.2.8.4. Recent Developments
- 17.2.8.5. Financials (Based on Availability)
- 17.2.9 The Chubb Corporation
- 17.2.9.1. Overview
- 17.2.9.2. Products
- 17.2.9.3. SWOT Analysis
- 17.2.9.4. Recent Developments
- 17.2.9.5. Financials (Based on Availability)
- 17.2.10 Berkshire Hathaway Inc
- 17.2.10.1. Overview
- 17.2.10.2. Products
- 17.2.10.3. SWOT Analysis
- 17.2.10.4. Recent Developments
- 17.2.10.5. Financials (Based on Availability)
- 17.2.11 AXA XL
- 17.2.11.1. Overview
- 17.2.11.2. Products
- 17.2.11.3. SWOT Analysis
- 17.2.11.4. Recent Developments
- 17.2.11.5. Financials (Based on Availability)
- 17.2.1 Munich Re Group
List of Figures
- Figure 1: Global Cyber Security in Insurance Industry Revenue Breakdown (Million, %) by Region 2024 & 2032
- Figure 2: Global Cyber Security in Insurance Industry Volume Breakdown (K Unit, %) by Region 2024 & 2032
- Figure 3: North America Cyber Security in Insurance Industry Revenue (Million), by Country 2024 & 2032
- Figure 4: North America Cyber Security in Insurance Industry Volume (K Unit), by Country 2024 & 2032
- Figure 5: North America Cyber Security in Insurance Industry Revenue Share (%), by Country 2024 & 2032
- Figure 6: North America Cyber Security in Insurance Industry Volume Share (%), by Country 2024 & 2032
- Figure 7: Europe Cyber Security in Insurance Industry Revenue (Million), by Country 2024 & 2032
- Figure 8: Europe Cyber Security in Insurance Industry Volume (K Unit), by Country 2024 & 2032
- Figure 9: Europe Cyber Security in Insurance Industry Revenue Share (%), by Country 2024 & 2032
- Figure 10: Europe Cyber Security in Insurance Industry Volume Share (%), by Country 2024 & 2032
- Figure 11: Asia Pacific Cyber Security in Insurance Industry Revenue (Million), by Country 2024 & 2032
- Figure 12: Asia Pacific Cyber Security in Insurance Industry Volume (K Unit), by Country 2024 & 2032
- Figure 13: Asia Pacific Cyber Security in Insurance Industry Revenue Share (%), by Country 2024 & 2032
- Figure 14: Asia Pacific Cyber Security in Insurance Industry Volume Share (%), by Country 2024 & 2032
- Figure 15: South America Cyber Security in Insurance Industry Revenue (Million), by Country 2024 & 2032
- Figure 16: South America Cyber Security in Insurance Industry Volume (K Unit), by Country 2024 & 2032
- Figure 17: South America Cyber Security in Insurance Industry Revenue Share (%), by Country 2024 & 2032
- Figure 18: South America Cyber Security in Insurance Industry Volume Share (%), by Country 2024 & 2032
- Figure 19: North America Cyber Security in Insurance Industry Revenue (Million), by Country 2024 & 2032
- Figure 20: North America Cyber Security in Insurance Industry Volume (K Unit), by Country 2024 & 2032
- Figure 21: North America Cyber Security in Insurance Industry Revenue Share (%), by Country 2024 & 2032
- Figure 22: North America Cyber Security in Insurance Industry Volume Share (%), by Country 2024 & 2032
- Figure 23: MEA Cyber Security in Insurance Industry Revenue (Million), by Country 2024 & 2032
- Figure 24: MEA Cyber Security in Insurance Industry Volume (K Unit), by Country 2024 & 2032
- Figure 25: MEA Cyber Security in Insurance Industry Revenue Share (%), by Country 2024 & 2032
- Figure 26: MEA Cyber Security in Insurance Industry Volume Share (%), by Country 2024 & 2032
- Figure 27: North America Cyber Security in Insurance Industry Revenue (Million), by Organization Size 2024 & 2032
- Figure 28: North America Cyber Security in Insurance Industry Volume (K Unit), by Organization Size 2024 & 2032
- Figure 29: North America Cyber Security in Insurance Industry Revenue Share (%), by Organization Size 2024 & 2032
- Figure 30: North America Cyber Security in Insurance Industry Volume Share (%), by Organization Size 2024 & 2032
- Figure 31: North America Cyber Security in Insurance Industry Revenue (Million), by End-user Industry 2024 & 2032
- Figure 32: North America Cyber Security in Insurance Industry Volume (K Unit), by End-user Industry 2024 & 2032
- Figure 33: North America Cyber Security in Insurance Industry Revenue Share (%), by End-user Industry 2024 & 2032
- Figure 34: North America Cyber Security in Insurance Industry Volume Share (%), by End-user Industry 2024 & 2032
- Figure 35: North America Cyber Security in Insurance Industry Revenue (Million), by Country 2024 & 2032
- Figure 36: North America Cyber Security in Insurance Industry Volume (K Unit), by Country 2024 & 2032
- Figure 37: North America Cyber Security in Insurance Industry Revenue Share (%), by Country 2024 & 2032
- Figure 38: North America Cyber Security in Insurance Industry Volume Share (%), by Country 2024 & 2032
- Figure 39: Europe Cyber Security in Insurance Industry Revenue (Million), by Organization Size 2024 & 2032
- Figure 40: Europe Cyber Security in Insurance Industry Volume (K Unit), by Organization Size 2024 & 2032
- Figure 41: Europe Cyber Security in Insurance Industry Revenue Share (%), by Organization Size 2024 & 2032
- Figure 42: Europe Cyber Security in Insurance Industry Volume Share (%), by Organization Size 2024 & 2032
- Figure 43: Europe Cyber Security in Insurance Industry Revenue (Million), by End-user Industry 2024 & 2032
- Figure 44: Europe Cyber Security in Insurance Industry Volume (K Unit), by End-user Industry 2024 & 2032
- Figure 45: Europe Cyber Security in Insurance Industry Revenue Share (%), by End-user Industry 2024 & 2032
- Figure 46: Europe Cyber Security in Insurance Industry Volume Share (%), by End-user Industry 2024 & 2032
- Figure 47: Europe Cyber Security in Insurance Industry Revenue (Million), by Country 2024 & 2032
- Figure 48: Europe Cyber Security in Insurance Industry Volume (K Unit), by Country 2024 & 2032
- Figure 49: Europe Cyber Security in Insurance Industry Revenue Share (%), by Country 2024 & 2032
- Figure 50: Europe Cyber Security in Insurance Industry Volume Share (%), by Country 2024 & 2032
- Figure 51: Asia Cyber Security in Insurance Industry Revenue (Million), by Organization Size 2024 & 2032
- Figure 52: Asia Cyber Security in Insurance Industry Volume (K Unit), by Organization Size 2024 & 2032
- Figure 53: Asia Cyber Security in Insurance Industry Revenue Share (%), by Organization Size 2024 & 2032
- Figure 54: Asia Cyber Security in Insurance Industry Volume Share (%), by Organization Size 2024 & 2032
- Figure 55: Asia Cyber Security in Insurance Industry Revenue (Million), by End-user Industry 2024 & 2032
- Figure 56: Asia Cyber Security in Insurance Industry Volume (K Unit), by End-user Industry 2024 & 2032
- Figure 57: Asia Cyber Security in Insurance Industry Revenue Share (%), by End-user Industry 2024 & 2032
- Figure 58: Asia Cyber Security in Insurance Industry Volume Share (%), by End-user Industry 2024 & 2032
- Figure 59: Asia Cyber Security in Insurance Industry Revenue (Million), by Country 2024 & 2032
- Figure 60: Asia Cyber Security in Insurance Industry Volume (K Unit), by Country 2024 & 2032
- Figure 61: Asia Cyber Security in Insurance Industry Revenue Share (%), by Country 2024 & 2032
- Figure 62: Asia Cyber Security in Insurance Industry Volume Share (%), by Country 2024 & 2032
- Figure 63: Latin America Cyber Security in Insurance Industry Revenue (Million), by Organization Size 2024 & 2032
- Figure 64: Latin America Cyber Security in Insurance Industry Volume (K Unit), by Organization Size 2024 & 2032
- Figure 65: Latin America Cyber Security in Insurance Industry Revenue Share (%), by Organization Size 2024 & 2032
- Figure 66: Latin America Cyber Security in Insurance Industry Volume Share (%), by Organization Size 2024 & 2032
- Figure 67: Latin America Cyber Security in Insurance Industry Revenue (Million), by End-user Industry 2024 & 2032
- Figure 68: Latin America Cyber Security in Insurance Industry Volume (K Unit), by End-user Industry 2024 & 2032
- Figure 69: Latin America Cyber Security in Insurance Industry Revenue Share (%), by End-user Industry 2024 & 2032
- Figure 70: Latin America Cyber Security in Insurance Industry Volume Share (%), by End-user Industry 2024 & 2032
- Figure 71: Latin America Cyber Security in Insurance Industry Revenue (Million), by Country 2024 & 2032
- Figure 72: Latin America Cyber Security in Insurance Industry Volume (K Unit), by Country 2024 & 2032
- Figure 73: Latin America Cyber Security in Insurance Industry Revenue Share (%), by Country 2024 & 2032
- Figure 74: Latin America Cyber Security in Insurance Industry Volume Share (%), by Country 2024 & 2032
- Figure 75: Middle East and Africa Cyber Security in Insurance Industry Revenue (Million), by Organization Size 2024 & 2032
- Figure 76: Middle East and Africa Cyber Security in Insurance Industry Volume (K Unit), by Organization Size 2024 & 2032
- Figure 77: Middle East and Africa Cyber Security in Insurance Industry Revenue Share (%), by Organization Size 2024 & 2032
- Figure 78: Middle East and Africa Cyber Security in Insurance Industry Volume Share (%), by Organization Size 2024 & 2032
- Figure 79: Middle East and Africa Cyber Security in Insurance Industry Revenue (Million), by End-user Industry 2024 & 2032
- Figure 80: Middle East and Africa Cyber Security in Insurance Industry Volume (K Unit), by End-user Industry 2024 & 2032
- Figure 81: Middle East and Africa Cyber Security in Insurance Industry Revenue Share (%), by End-user Industry 2024 & 2032
- Figure 82: Middle East and Africa Cyber Security in Insurance Industry Volume Share (%), by End-user Industry 2024 & 2032
- Figure 83: Middle East and Africa Cyber Security in Insurance Industry Revenue (Million), by Country 2024 & 2032
- Figure 84: Middle East and Africa Cyber Security in Insurance Industry Volume (K Unit), by Country 2024 & 2032
- Figure 85: Middle East and Africa Cyber Security in Insurance Industry Revenue Share (%), by Country 2024 & 2032
- Figure 86: Middle East and Africa Cyber Security in Insurance Industry Volume Share (%), by Country 2024 & 2032
List of Tables
- Table 1: Global Cyber Security in Insurance Industry Revenue Million Forecast, by Region 2019 & 2032
- Table 2: Global Cyber Security in Insurance Industry Volume K Unit Forecast, by Region 2019 & 2032
- Table 3: Global Cyber Security in Insurance Industry Revenue Million Forecast, by Organization Size 2019 & 2032
- Table 4: Global Cyber Security in Insurance Industry Volume K Unit Forecast, by Organization Size 2019 & 2032
- Table 5: Global Cyber Security in Insurance Industry Revenue Million Forecast, by End-user Industry 2019 & 2032
- Table 6: Global Cyber Security in Insurance Industry Volume K Unit Forecast, by End-user Industry 2019 & 2032
- Table 7: Global Cyber Security in Insurance Industry Revenue Million Forecast, by Region 2019 & 2032
- Table 8: Global Cyber Security in Insurance Industry Volume K Unit Forecast, by Region 2019 & 2032
- Table 9: Global Cyber Security in Insurance Industry Revenue Million Forecast, by Country 2019 & 2032
- Table 10: Global Cyber Security in Insurance Industry Volume K Unit Forecast, by Country 2019 & 2032
- Table 11: United States Cyber Security in Insurance Industry Revenue (Million) Forecast, by Application 2019 & 2032
- Table 12: United States Cyber Security in Insurance Industry Volume (K Unit) Forecast, by Application 2019 & 2032
- Table 13: Canada Cyber Security in Insurance Industry Revenue (Million) Forecast, by Application 2019 & 2032
- Table 14: Canada Cyber Security in Insurance Industry Volume (K Unit) Forecast, by Application 2019 & 2032
- Table 15: Mexico Cyber Security in Insurance Industry Revenue (Million) Forecast, by Application 2019 & 2032
- Table 16: Mexico Cyber Security in Insurance Industry Volume (K Unit) Forecast, by Application 2019 & 2032
- Table 17: Global Cyber Security in Insurance Industry Revenue Million Forecast, by Country 2019 & 2032
- Table 18: Global Cyber Security in Insurance Industry Volume K Unit Forecast, by Country 2019 & 2032
- Table 19: Germany Cyber Security in Insurance Industry Revenue (Million) Forecast, by Application 2019 & 2032
- Table 20: Germany Cyber Security in Insurance Industry Volume (K Unit) Forecast, by Application 2019 & 2032
- Table 21: United Kingdom Cyber Security in Insurance Industry Revenue (Million) Forecast, by Application 2019 & 2032
- Table 22: United Kingdom Cyber Security in Insurance Industry Volume (K Unit) Forecast, by Application 2019 & 2032
- Table 23: France Cyber Security in Insurance Industry Revenue (Million) Forecast, by Application 2019 & 2032
- Table 24: France Cyber Security in Insurance Industry Volume (K Unit) Forecast, by Application 2019 & 2032
- Table 25: Spain Cyber Security in Insurance Industry Revenue (Million) Forecast, by Application 2019 & 2032
- Table 26: Spain Cyber Security in Insurance Industry Volume (K Unit) Forecast, by Application 2019 & 2032
- Table 27: Italy Cyber Security in Insurance Industry Revenue (Million) Forecast, by Application 2019 & 2032
- Table 28: Italy Cyber Security in Insurance Industry Volume (K Unit) Forecast, by Application 2019 & 2032
- Table 29: Spain Cyber Security in Insurance Industry Revenue (Million) Forecast, by Application 2019 & 2032
- Table 30: Spain Cyber Security in Insurance Industry Volume (K Unit) Forecast, by Application 2019 & 2032
- Table 31: Belgium Cyber Security in Insurance Industry Revenue (Million) Forecast, by Application 2019 & 2032
- Table 32: Belgium Cyber Security in Insurance Industry Volume (K Unit) Forecast, by Application 2019 & 2032
- Table 33: Netherland Cyber Security in Insurance Industry Revenue (Million) Forecast, by Application 2019 & 2032
- Table 34: Netherland Cyber Security in Insurance Industry Volume (K Unit) Forecast, by Application 2019 & 2032
- Table 35: Nordics Cyber Security in Insurance Industry Revenue (Million) Forecast, by Application 2019 & 2032
- Table 36: Nordics Cyber Security in Insurance Industry Volume (K Unit) Forecast, by Application 2019 & 2032
- Table 37: Rest of Europe Cyber Security in Insurance Industry Revenue (Million) Forecast, by Application 2019 & 2032
- Table 38: Rest of Europe Cyber Security in Insurance Industry Volume (K Unit) Forecast, by Application 2019 & 2032
- Table 39: Global Cyber Security in Insurance Industry Revenue Million Forecast, by Country 2019 & 2032
- Table 40: Global Cyber Security in Insurance Industry Volume K Unit Forecast, by Country 2019 & 2032
- Table 41: China Cyber Security in Insurance Industry Revenue (Million) Forecast, by Application 2019 & 2032
- Table 42: China Cyber Security in Insurance Industry Volume (K Unit) Forecast, by Application 2019 & 2032
- Table 43: Japan Cyber Security in Insurance Industry Revenue (Million) Forecast, by Application 2019 & 2032
- Table 44: Japan Cyber Security in Insurance Industry Volume (K Unit) Forecast, by Application 2019 & 2032
- Table 45: India Cyber Security in Insurance Industry Revenue (Million) Forecast, by Application 2019 & 2032
- Table 46: India Cyber Security in Insurance Industry Volume (K Unit) Forecast, by Application 2019 & 2032
- Table 47: South Korea Cyber Security in Insurance Industry Revenue (Million) Forecast, by Application 2019 & 2032
- Table 48: South Korea Cyber Security in Insurance Industry Volume (K Unit) Forecast, by Application 2019 & 2032
- Table 49: Southeast Asia Cyber Security in Insurance Industry Revenue (Million) Forecast, by Application 2019 & 2032
- Table 50: Southeast Asia Cyber Security in Insurance Industry Volume (K Unit) Forecast, by Application 2019 & 2032
- Table 51: Australia Cyber Security in Insurance Industry Revenue (Million) Forecast, by Application 2019 & 2032
- Table 52: Australia Cyber Security in Insurance Industry Volume (K Unit) Forecast, by Application 2019 & 2032
- Table 53: Indonesia Cyber Security in Insurance Industry Revenue (Million) Forecast, by Application 2019 & 2032
- Table 54: Indonesia Cyber Security in Insurance Industry Volume (K Unit) Forecast, by Application 2019 & 2032
- Table 55: Phillipes Cyber Security in Insurance Industry Revenue (Million) Forecast, by Application 2019 & 2032
- Table 56: Phillipes Cyber Security in Insurance Industry Volume (K Unit) Forecast, by Application 2019 & 2032
- Table 57: Singapore Cyber Security in Insurance Industry Revenue (Million) Forecast, by Application 2019 & 2032
- Table 58: Singapore Cyber Security in Insurance Industry Volume (K Unit) Forecast, by Application 2019 & 2032
- Table 59: Thailandc Cyber Security in Insurance Industry Revenue (Million) Forecast, by Application 2019 & 2032
- Table 60: Thailandc Cyber Security in Insurance Industry Volume (K Unit) Forecast, by Application 2019 & 2032
- Table 61: Rest of Asia Pacific Cyber Security in Insurance Industry Revenue (Million) Forecast, by Application 2019 & 2032
- Table 62: Rest of Asia Pacific Cyber Security in Insurance Industry Volume (K Unit) Forecast, by Application 2019 & 2032
- Table 63: Global Cyber Security in Insurance Industry Revenue Million Forecast, by Country 2019 & 2032
- Table 64: Global Cyber Security in Insurance Industry Volume K Unit Forecast, by Country 2019 & 2032
- Table 65: Brazil Cyber Security in Insurance Industry Revenue (Million) Forecast, by Application 2019 & 2032
- Table 66: Brazil Cyber Security in Insurance Industry Volume (K Unit) Forecast, by Application 2019 & 2032
- Table 67: Argentina Cyber Security in Insurance Industry Revenue (Million) Forecast, by Application 2019 & 2032
- Table 68: Argentina Cyber Security in Insurance Industry Volume (K Unit) Forecast, by Application 2019 & 2032
- Table 69: Peru Cyber Security in Insurance Industry Revenue (Million) Forecast, by Application 2019 & 2032
- Table 70: Peru Cyber Security in Insurance Industry Volume (K Unit) Forecast, by Application 2019 & 2032
- Table 71: Chile Cyber Security in Insurance Industry Revenue (Million) Forecast, by Application 2019 & 2032
- Table 72: Chile Cyber Security in Insurance Industry Volume (K Unit) Forecast, by Application 2019 & 2032
- Table 73: Colombia Cyber Security in Insurance Industry Revenue (Million) Forecast, by Application 2019 & 2032
- Table 74: Colombia Cyber Security in Insurance Industry Volume (K Unit) Forecast, by Application 2019 & 2032
- Table 75: Ecuador Cyber Security in Insurance Industry Revenue (Million) Forecast, by Application 2019 & 2032
- Table 76: Ecuador Cyber Security in Insurance Industry Volume (K Unit) Forecast, by Application 2019 & 2032
- Table 77: Venezuela Cyber Security in Insurance Industry Revenue (Million) Forecast, by Application 2019 & 2032
- Table 78: Venezuela Cyber Security in Insurance Industry Volume (K Unit) Forecast, by Application 2019 & 2032
- Table 79: Rest of South America Cyber Security in Insurance Industry Revenue (Million) Forecast, by Application 2019 & 2032
- Table 80: Rest of South America Cyber Security in Insurance Industry Volume (K Unit) Forecast, by Application 2019 & 2032
- Table 81: Global Cyber Security in Insurance Industry Revenue Million Forecast, by Country 2019 & 2032
- Table 82: Global Cyber Security in Insurance Industry Volume K Unit Forecast, by Country 2019 & 2032
- Table 83: United States Cyber Security in Insurance Industry Revenue (Million) Forecast, by Application 2019 & 2032
- Table 84: United States Cyber Security in Insurance Industry Volume (K Unit) Forecast, by Application 2019 & 2032
- Table 85: Canada Cyber Security in Insurance Industry Revenue (Million) Forecast, by Application 2019 & 2032
- Table 86: Canada Cyber Security in Insurance Industry Volume (K Unit) Forecast, by Application 2019 & 2032
- Table 87: Mexico Cyber Security in Insurance Industry Revenue (Million) Forecast, by Application 2019 & 2032
- Table 88: Mexico Cyber Security in Insurance Industry Volume (K Unit) Forecast, by Application 2019 & 2032
- Table 89: Global Cyber Security in Insurance Industry Revenue Million Forecast, by Country 2019 & 2032
- Table 90: Global Cyber Security in Insurance Industry Volume K Unit Forecast, by Country 2019 & 2032
- Table 91: United Arab Emirates Cyber Security in Insurance Industry Revenue (Million) Forecast, by Application 2019 & 2032
- Table 92: United Arab Emirates Cyber Security in Insurance Industry Volume (K Unit) Forecast, by Application 2019 & 2032
- Table 93: Saudi Arabia Cyber Security in Insurance Industry Revenue (Million) Forecast, by Application 2019 & 2032
- Table 94: Saudi Arabia Cyber Security in Insurance Industry Volume (K Unit) Forecast, by Application 2019 & 2032
- Table 95: South Africa Cyber Security in Insurance Industry Revenue (Million) Forecast, by Application 2019 & 2032
- Table 96: South Africa Cyber Security in Insurance Industry Volume (K Unit) Forecast, by Application 2019 & 2032
- Table 97: Rest of Middle East and Africa Cyber Security in Insurance Industry Revenue (Million) Forecast, by Application 2019 & 2032
- Table 98: Rest of Middle East and Africa Cyber Security in Insurance Industry Volume (K Unit) Forecast, by Application 2019 & 2032
- Table 99: Global Cyber Security in Insurance Industry Revenue Million Forecast, by Organization Size 2019 & 2032
- Table 100: Global Cyber Security in Insurance Industry Volume K Unit Forecast, by Organization Size 2019 & 2032
- Table 101: Global Cyber Security in Insurance Industry Revenue Million Forecast, by End-user Industry 2019 & 2032
- Table 102: Global Cyber Security in Insurance Industry Volume K Unit Forecast, by End-user Industry 2019 & 2032
- Table 103: Global Cyber Security in Insurance Industry Revenue Million Forecast, by Country 2019 & 2032
- Table 104: Global Cyber Security in Insurance Industry Volume K Unit Forecast, by Country 2019 & 2032
- Table 105: United States Cyber Security in Insurance Industry Revenue (Million) Forecast, by Application 2019 & 2032
- Table 106: United States Cyber Security in Insurance Industry Volume (K Unit) Forecast, by Application 2019 & 2032
- Table 107: Canada Cyber Security in Insurance Industry Revenue (Million) Forecast, by Application 2019 & 2032
- Table 108: Canada Cyber Security in Insurance Industry Volume (K Unit) Forecast, by Application 2019 & 2032
- Table 109: Global Cyber Security in Insurance Industry Revenue Million Forecast, by Organization Size 2019 & 2032
- Table 110: Global Cyber Security in Insurance Industry Volume K Unit Forecast, by Organization Size 2019 & 2032
- Table 111: Global Cyber Security in Insurance Industry Revenue Million Forecast, by End-user Industry 2019 & 2032
- Table 112: Global Cyber Security in Insurance Industry Volume K Unit Forecast, by End-user Industry 2019 & 2032
- Table 113: Global Cyber Security in Insurance Industry Revenue Million Forecast, by Country 2019 & 2032
- Table 114: Global Cyber Security in Insurance Industry Volume K Unit Forecast, by Country 2019 & 2032
- Table 115: Germany Cyber Security in Insurance Industry Revenue (Million) Forecast, by Application 2019 & 2032
- Table 116: Germany Cyber Security in Insurance Industry Volume (K Unit) Forecast, by Application 2019 & 2032
- Table 117: United Kingdom Cyber Security in Insurance Industry Revenue (Million) Forecast, by Application 2019 & 2032
- Table 118: United Kingdom Cyber Security in Insurance Industry Volume (K Unit) Forecast, by Application 2019 & 2032
- Table 119: France Cyber Security in Insurance Industry Revenue (Million) Forecast, by Application 2019 & 2032
- Table 120: France Cyber Security in Insurance Industry Volume (K Unit) Forecast, by Application 2019 & 2032
- Table 121: Global Cyber Security in Insurance Industry Revenue Million Forecast, by Organization Size 2019 & 2032
- Table 122: Global Cyber Security in Insurance Industry Volume K Unit Forecast, by Organization Size 2019 & 2032
- Table 123: Global Cyber Security in Insurance Industry Revenue Million Forecast, by End-user Industry 2019 & 2032
- Table 124: Global Cyber Security in Insurance Industry Volume K Unit Forecast, by End-user Industry 2019 & 2032
- Table 125: Global Cyber Security in Insurance Industry Revenue Million Forecast, by Country 2019 & 2032
- Table 126: Global Cyber Security in Insurance Industry Volume K Unit Forecast, by Country 2019 & 2032
- Table 127: India Cyber Security in Insurance Industry Revenue (Million) Forecast, by Application 2019 & 2032
- Table 128: India Cyber Security in Insurance Industry Volume (K Unit) Forecast, by Application 2019 & 2032
- Table 129: China Cyber Security in Insurance Industry Revenue (Million) Forecast, by Application 2019 & 2032
- Table 130: China Cyber Security in Insurance Industry Volume (K Unit) Forecast, by Application 2019 & 2032
- Table 131: Japan Cyber Security in Insurance Industry Revenue (Million) Forecast, by Application 2019 & 2032
- Table 132: Japan Cyber Security in Insurance Industry Volume (K Unit) Forecast, by Application 2019 & 2032
- Table 133: Singapore Cyber Security in Insurance Industry Revenue (Million) Forecast, by Application 2019 & 2032
- Table 134: Singapore Cyber Security in Insurance Industry Volume (K Unit) Forecast, by Application 2019 & 2032
- Table 135: Australia and New Zealand Cyber Security in Insurance Industry Revenue (Million) Forecast, by Application 2019 & 2032
- Table 136: Australia and New Zealand Cyber Security in Insurance Industry Volume (K Unit) Forecast, by Application 2019 & 2032
- Table 137: Global Cyber Security in Insurance Industry Revenue Million Forecast, by Organization Size 2019 & 2032
- Table 138: Global Cyber Security in Insurance Industry Volume K Unit Forecast, by Organization Size 2019 & 2032
- Table 139: Global Cyber Security in Insurance Industry Revenue Million Forecast, by End-user Industry 2019 & 2032
- Table 140: Global Cyber Security in Insurance Industry Volume K Unit Forecast, by End-user Industry 2019 & 2032
- Table 141: Global Cyber Security in Insurance Industry Revenue Million Forecast, by Country 2019 & 2032
- Table 142: Global Cyber Security in Insurance Industry Volume K Unit Forecast, by Country 2019 & 2032
- Table 143: Brazil Cyber Security in Insurance Industry Revenue (Million) Forecast, by Application 2019 & 2032
- Table 144: Brazil Cyber Security in Insurance Industry Volume (K Unit) Forecast, by Application 2019 & 2032
- Table 145: Argentina Cyber Security in Insurance Industry Revenue (Million) Forecast, by Application 2019 & 2032
- Table 146: Argentina Cyber Security in Insurance Industry Volume (K Unit) Forecast, by Application 2019 & 2032
- Table 147: Rest of South America Cyber Security in Insurance Industry Revenue (Million) Forecast, by Application 2019 & 2032
- Table 148: Rest of South America Cyber Security in Insurance Industry Volume (K Unit) Forecast, by Application 2019 & 2032
- Table 149: Global Cyber Security in Insurance Industry Revenue Million Forecast, by Organization Size 2019 & 2032
- Table 150: Global Cyber Security in Insurance Industry Volume K Unit Forecast, by Organization Size 2019 & 2032
- Table 151: Global Cyber Security in Insurance Industry Revenue Million Forecast, by End-user Industry 2019 & 2032
- Table 152: Global Cyber Security in Insurance Industry Volume K Unit Forecast, by End-user Industry 2019 & 2032
- Table 153: Global Cyber Security in Insurance Industry Revenue Million Forecast, by Country 2019 & 2032
- Table 154: Global Cyber Security in Insurance Industry Volume K Unit Forecast, by Country 2019 & 2032
- Table 155: UAE Cyber Security in Insurance Industry Revenue (Million) Forecast, by Application 2019 & 2032
- Table 156: UAE Cyber Security in Insurance Industry Volume (K Unit) Forecast, by Application 2019 & 2032
- Table 157: South Africa Cyber Security in Insurance Industry Revenue (Million) Forecast, by Application 2019 & 2032
- Table 158: South Africa Cyber Security in Insurance Industry Volume (K Unit) Forecast, by Application 2019 & 2032
- Table 159: Saudi Arabia Cyber Security in Insurance Industry Revenue (Million) Forecast, by Application 2019 & 2032
- Table 160: Saudi Arabia Cyber Security in Insurance Industry Volume (K Unit) Forecast, by Application 2019 & 2032
- Table 161: Rest Of MEA Cyber Security in Insurance Industry Revenue (Million) Forecast, by Application 2019 & 2032
- Table 162: Rest Of MEA Cyber Security in Insurance Industry Volume (K Unit) Forecast, by Application 2019 & 2032
Frequently Asked Questions
1. What is the projected Compound Annual Growth Rate (CAGR) of the Cyber Security in Insurance Industry?
The projected CAGR is approximately 19.72%.
2. Which companies are prominent players in the Cyber Security in Insurance Industry?
Key companies in the market include Munich Re Group, Insureon, Lockton Companies Inc, Allianz Global Corporate & Specialty (AGCS), Aon PLC, Security Scorecard Inc, American International Group Inc, Zurich Insurance Co Ltd, The Chubb Corporation, Berkshire Hathaway Inc, AXA XL.
3. What are the main segments of the Cyber Security in Insurance Industry?
The market segments include Organization Size, End-user Industry.
4. Can you provide details about the market size?
The market size is estimated to be USD 16.09 Million as of 2022.
5. What are some drivers contributing to market growth?
Increasing Adoption of Cloud-based Services; Rising Data Security Breaches.
6. What are the notable trends driving market growth?
The BFSI Segment is Estimated to Hold a Significant Share.
7. Are there any restraints impacting market growth?
Difficulties in Implementing Cyber Insurance and High Costs.
8. Can you provide examples of recent developments in the market?
September 2022 - The coalition, a cyber insurer with its headquarters in San Francisco, has been offering small and medium businesses solutions to manage cyber risk by integrating cybersecurity technologies, monitoring, access to digital forensics, incident response, and extensive insurance coverage in the USA. The company has increased its clientele and entered the UK market.
9. What pricing options are available for accessing the report?
Pricing options include single-user, multi-user, and enterprise licenses priced at USD 4750, USD 5250, and USD 8750 respectively.
10. Is the market size provided in terms of value or volume?
The market size is provided in terms of value, measured in Million and volume, measured in K Unit.
11. Are there any specific market keywords associated with the report?
Yes, the market keyword associated with the report is "Cyber Security in Insurance Industry," which aids in identifying and referencing the specific market segment covered.
12. How do I determine which pricing option suits my needs best?
The pricing options vary based on user requirements and access needs. Individual users may opt for single-user licenses, while businesses requiring broader access may choose multi-user or enterprise licenses for cost-effective access to the report.
13. Are there any additional resources or data provided in the Cyber Security in Insurance Industry report?
While the report offers comprehensive insights, it's advisable to review the specific contents or supplementary materials provided to ascertain if additional resources or data are available.
14. How can I stay updated on further developments or reports in the Cyber Security in Insurance Industry?
To stay informed about further developments, trends, and reports in the Cyber Security in Insurance Industry, consider subscribing to industry newsletters, following relevant companies and organizations, or regularly checking reputable industry news sources and publications.
Methodology
Step 1 - Identification of Relevant Samples Size from Population Database


Step 2 - Approaches for Defining Global Market Size (Value, Volume* & Price*)

Note*: In applicable scenarios
Step 3 - Data Sources
Primary Research
- Web Analytics
- Survey Reports
- Research Institute
- Latest Research Reports
- Opinion Leaders
Secondary Research
- Annual Reports
- White Paper
- Latest Press Release
- Industry Association
- Paid Database
- Investor Presentations

Step 4 - Data Triangulation
Involves using different sources of information in order to increase the validity of a study
These sources are likely to be stakeholders in a program - participants, other researchers, program staff, other community members, and so on.
Then we put all data in single framework & apply various statistical tools to find out the dynamic on the market.
During the analysis stage, feedback from the stakeholder groups would be compared to determine areas of agreement as well as areas of divergence


