
Key Insights
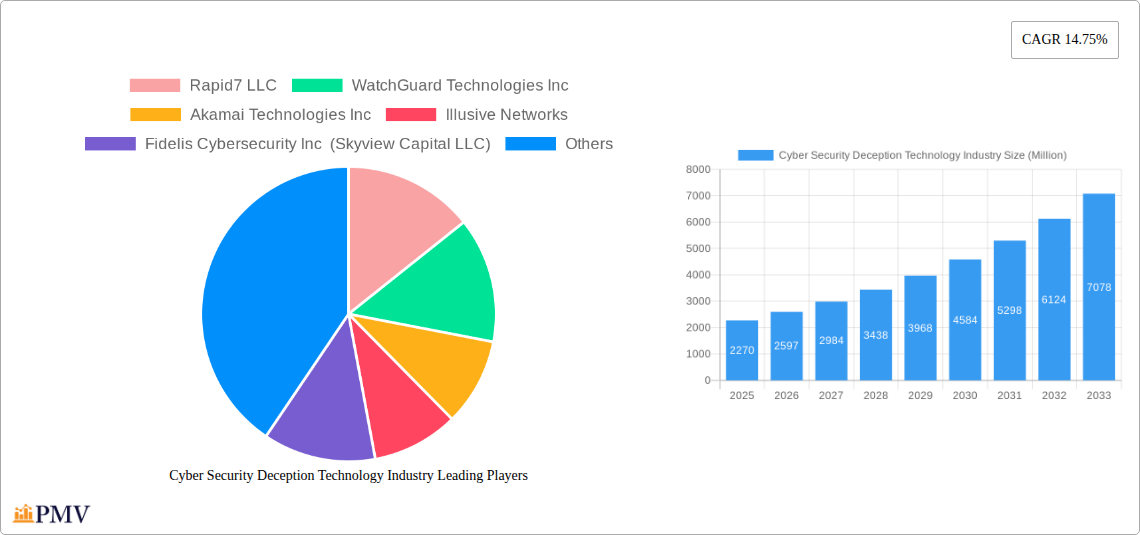
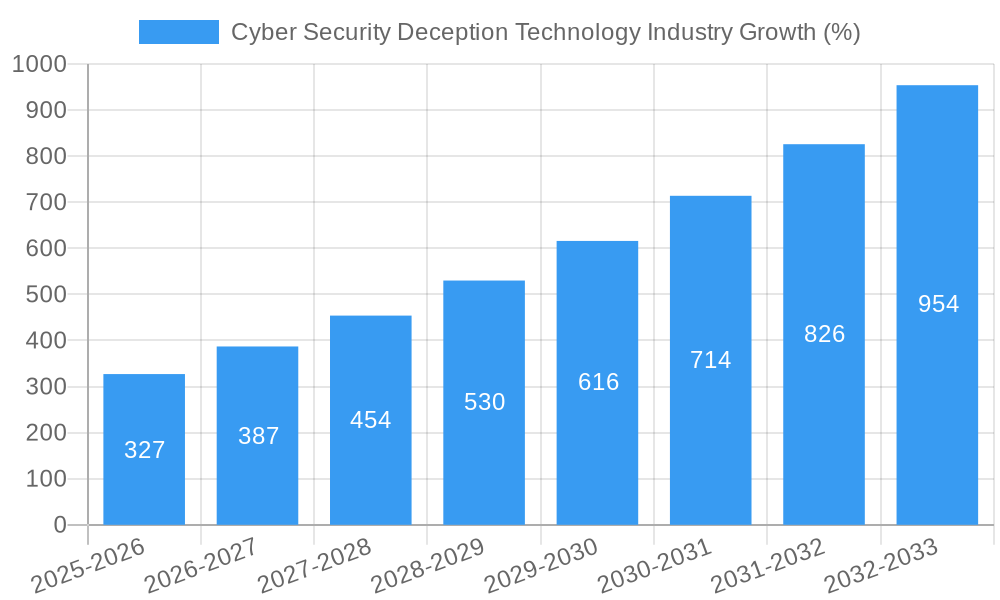
The Cyber Security Deception Technology market is experiencing robust growth, projected to reach \$2.27 billion in 2025 and exhibiting a Compound Annual Growth Rate (CAGR) of 14.75% from 2025 to 2033. This expansion is fueled by the escalating sophistication of cyberattacks and the increasing adoption of cloud-based infrastructure, making organizations more vulnerable. The rising frequency and severity of data breaches across various sectors—including government, BFSI (Banking, Financial Services, and Insurance), healthcare, and IT & Telecommunications—are driving demand for advanced security solutions. The market is segmented by organization size (SMEs and large enterprises), service type (managed and professional services), deception stack (data, application, endpoint, and network security), end-user industry, and deployment model (cloud and on-premise). Large enterprises are currently the dominant segment, investing heavily in comprehensive security infrastructure. However, the growing awareness of cybersecurity threats among SMEs is expected to fuel significant growth in this segment over the forecast period. The managed services segment is also predicted to witness considerable growth as organizations increasingly prefer outsourcing their cybersecurity needs for cost efficiency and expertise. The shift towards cloud-based deployments is another key trend, presenting both opportunities and challenges for vendors. While cloud-based deception technologies offer scalability and flexibility, ensuring seamless integration and data security within cloud environments remains a critical factor.
The competitive landscape is characterized by a mix of established players like Rapid7, WatchGuard, and Akamai, alongside emerging innovative companies like Illusive Networks and Attivo Networks. Successful players are focusing on developing comprehensive solutions that integrate various deception technologies across the security stack, offering robust threat detection, response capabilities, and advanced analytics. Furthermore, strategic partnerships and acquisitions are expected to play a crucial role in shaping market dynamics, driving innovation and broadening market reach. Geographic expansion, particularly in rapidly developing economies within the Asia-Pacific region, is also likely to contribute significantly to market growth over the next decade. Continuous advancements in deception technologies, particularly in areas like AI and machine learning for enhanced threat detection and automated response, will be critical drivers of future market expansion.
This comprehensive report provides a detailed analysis of the Cyber Security Deception Technology industry, offering invaluable insights for stakeholders seeking to navigate this rapidly evolving landscape. With a study period spanning 2019-2033, a base year of 2025, and a forecast period of 2025-2033, this report delivers actionable intelligence based on rigorous research and data analysis. The total market size is estimated at $XX Billion in 2025.
Cyber Security Deception Technology Industry Market Structure & Competitive Dynamics
The Cyber Security Deception Technology market exhibits a moderately consolidated structure, with a few dominant players and a growing number of niche players. Market concentration is influenced by factors such as technological innovation, mergers and acquisitions (M&A) activity, and regulatory frameworks. The industry is characterized by a dynamic innovation ecosystem, with continuous development of advanced deception techniques and platforms. Regulatory compliance requirements, particularly regarding data privacy and security, significantly influence market dynamics. Product substitutes, such as traditional security solutions, represent a competitive challenge, albeit one that is being mitigated by the increasing sophistication and effectiveness of deception technologies.
End-user trends are shifting towards the adoption of comprehensive cybersecurity strategies that integrate deception technologies. This is particularly evident in the BFSI, Government, and Defense sectors, which are highly susceptible to sophisticated cyberattacks. The prevalence of M&A activity underscores the industry's competitive intensity and the pursuit of strategic consolidation. Significant deals in recent years have involved valuations of $XX Million, indicating substantial investment in this sector. For example, Rapid7's acquisition of Minerva Labs reflects the growing recognition of anti-evasion and ransomware prevention technologies. The market share of the top 5 players is estimated to be xx% in 2025, with Rapid7 LLC, WatchGuard Technologies Inc., and Akamai Technologies Inc. among the leading companies.
Cyber Security Deception Technology Industry Industry Trends & Insights
The Cyber Security Deception Technology industry is experiencing robust growth, driven by the escalating frequency and sophistication of cyberattacks. The Compound Annual Growth Rate (CAGR) is projected to be xx% during the forecast period (2025-2033), fueled by factors such as increasing digital transformation, the expansion of cloud computing, and the growing adoption of Internet of Things (IoT) devices. Technological disruptions, including the emergence of artificial intelligence (AI) and machine learning (ML) in deception technologies, are further accelerating market expansion. Market penetration is expected to reach xx% by 2033. Consumer preferences are increasingly focused on solutions that offer enhanced threat detection, automated response capabilities, and seamless integration with existing security infrastructure. The competitive landscape is marked by intense innovation, strategic partnerships, and M&A activity, pushing companies to continuously enhance their offerings and expand their market reach.
Dominant Markets & Segments in Cyber Security Deception Technology Industry
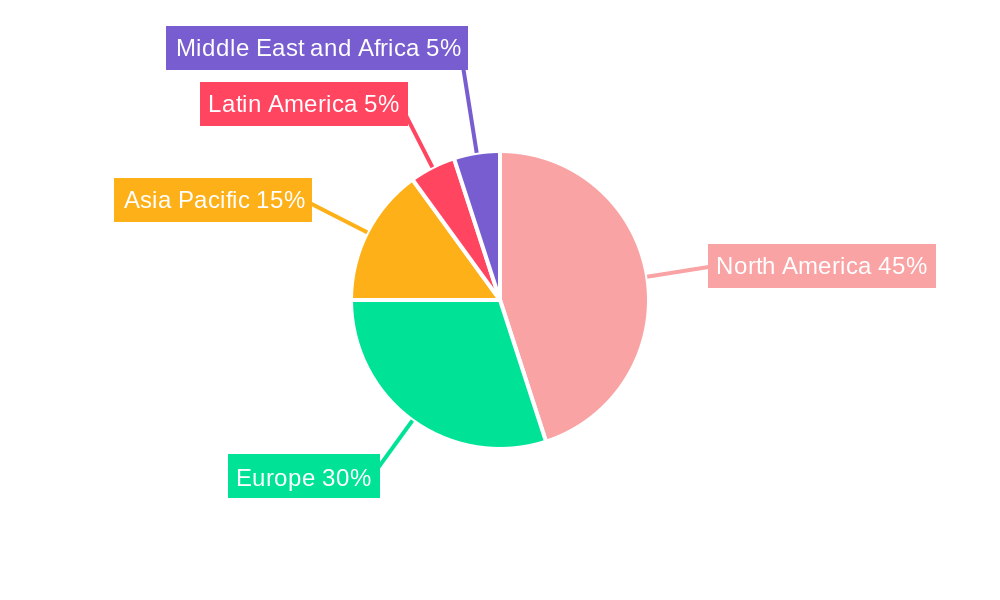
The North American region currently dominates the Cyber Security Deception Technology market, driven by factors such as high technological advancement, strong regulatory frameworks, and a large number of enterprise customers. Within this region, the United States holds the largest market share.
- By Organization Size: Large enterprises are currently the dominant segment, owing to their greater budgetary resources and susceptibility to complex cyber threats. However, Small and Medium Enterprises (SMEs) are exhibiting a rapidly increasing adoption rate.
- By Service: Managed services represent a significant portion of the market, driven by the increasing demand for outsourced cybersecurity expertise and cost-effective solutions. Professional services are also experiencing growth, particularly in areas such as consulting and implementation.
- By Deception Stack: Endpoint security holds the largest share of the market, reflecting the increasing vulnerability of endpoints to targeted attacks. Network security, however, is experiencing considerable growth due to the increasing complexity of network infrastructures.
- By End-User: The Government and BFSI sectors are the leading end-users, owing to their strict regulatory requirements and heightened risk of data breaches. The Defense sector is also a significant driver of growth due to its extensive IT infrastructure and critical data assets.
- By Deployment: Cloud deployment is gaining significant traction due to its scalability, cost-effectiveness, and accessibility. On-premise deployment remains prevalent in certain sectors owing to stringent data residency and security requirements.
Key drivers of dominance include robust IT infrastructure, supportive government policies encouraging cybersecurity investments, and a high concentration of cybersecurity vendors.
Cyber Security Deception Technology Industry Product Innovations
Recent product developments showcase the increasing sophistication of deception technologies, with a focus on AI-powered threat detection, automated response mechanisms, and enhanced integration with existing security infrastructures. These advancements enable organizations to effectively detect and mitigate advanced persistent threats (APTs) and ransomware attacks, offering a substantial competitive advantage. The market is witnessing a shift towards more proactive and adaptive security strategies, leveraging deception to lure attackers and gather valuable intelligence.
Report Segmentation & Scope
This report segments the Cyber Security Deception Technology market across various parameters:
By Organization Size: Small and Medium Enterprises (SMEs) and Large Enterprises, with projected growth rates of xx% and xx%, respectively, during the forecast period. The competitive landscape varies significantly between the two segments, with SMEs often prioritizing cost-effectiveness and scalability.
By Service: Managed Services and Professional Services. Managed services are expected to see higher growth due to cost efficiency, while professional services retain significance for complex deployments.
By Deception Stack: Data Security, Application Security, Endpoint Security, and Network Security. Each segment displays specific growth rates based on the evolving threat landscape, with Endpoint Security and Network Security currently dominating.
By End-User: Government, Medical, BFSI, Defense, IT and Telecommunication, and Other End-Users. Government and BFSI sectors exhibit high growth due to regulatory pressures and the value of their data.
By Deployment: Cloud and On-premise. Cloud deployments exhibit faster growth due to their flexibility and scalability, while on-premise remains significant in highly regulated sectors.
Key Drivers of Cyber Security Deception Technology Industry Growth
The Cyber Security Deception Technology market's growth is primarily fueled by factors such as:
- Increasing Cyberattacks: The rising frequency and sophistication of cyberattacks are driving the adoption of advanced security solutions.
- Data Privacy Regulations: Stringent data privacy regulations, such as GDPR and CCPA, are forcing organizations to invest in robust security measures.
- Cloud Adoption: The widespread adoption of cloud computing has expanded the attack surface, necessitating advanced security solutions.
- Technological Advancements: AI, ML, and automation are enabling more effective deception techniques.
Challenges in the Cyber Security Deception Technology Industry Sector
The Cyber Security Deception Technology industry faces several challenges, including:
- High Implementation Costs: The cost of deploying and maintaining deception technology can be substantial for some organizations.
- Skill Gaps: A shortage of skilled cybersecurity professionals hinders effective implementation and management of deception technologies.
- Integration Complexity: Integrating deception technologies with existing security infrastructure can be complex and time-consuming.
Leading Players in the Cyber Security Deception Technology Industry Market
- Rapid7 LLC
- WatchGuard Technologies Inc
- Akamai Technologies Inc
- Illusive Networks
- Fidelis Cybersecurity Inc (Skyview Capital LLC)
- Broadcom Inc (Symantec Corporation)
- Ridgeback Network Defense Inc
- Smokescreen Technologies Pvt Ltd
- LogRhythm Inc
- Attivo Networks Inc (Sentinelone Inc)
- NTT Security Limited (Nippon Telegraph and Telephone Corporation)
- Acalvio Technologies Inc
- CyberTrap Software GmbH
- CounterCraft SL
- Commvault Systems Inc
Key Developments in Cyber Security Deception Technology Industry Sector
- March 2023: Rapid7 announced the acquisition of Minerva Labs Ltd., enhancing its anti-evasion and ransomware prevention capabilities. This significantly strengthens Rapid7's market position.
- March 2023: Akamai Technologies announced an agreement to acquire Ondat, expanding its cloud storage and application deployment offerings. This move broadens Akamai's reach into the cloud security market.
- March 2023: Acalvio Technologies partnered with Carahsoft Technology Corp., expanding its reach into the public sector. This partnership opens significant new avenues for Acalvio's Active Defense Platform and ShadowPlex Advanced Threat Defense.
Strategic Cyber Security Deception Technology Industry Market Outlook
The Cyber Security Deception Technology market is poised for sustained growth, driven by the relentless evolution of cyber threats and the increasing reliance on digital technologies across all sectors. Strategic opportunities abound for companies that can effectively leverage AI, ML, and automation to enhance the effectiveness and scalability of their deception solutions. Furthermore, a focus on seamless integration with existing security infrastructure and the development of user-friendly platforms will be critical for market success. The increasing adoption of cloud-based security solutions presents a significant growth avenue, demanding innovation in areas such as multi-cloud security and the secure deployment of deception technologies in hybrid environments.
Cyber Security Deception Technology Industry Segmentation
-
1. Deployment
- 1.1. Cloud
- 1.2. On-premise
-
2. Organization Size
- 2.1. Small and Medium Enterprises
- 2.2. Large Enterprises
-
3. Service
- 3.1. Managed Services
- 3.2. Professional Services
-
4. Deception Stack
- 4.1. Data Security
- 4.2. Application Security
- 4.3. Endpoint Security
- 4.4. Network Security
-
5. End-User
- 5.1. Government
- 5.2. Medical
- 5.3. BFSI
- 5.4. Defense
- 5.5. IT and Telecommunication
- 5.6. Other End-Users
Cyber Security Deception Technology Industry Segmentation By Geography
- 1. North America
- 2. Europe
- 3. Asia Pacific
- 4. Latin America
- 5. Middle East and Africa
Cyber Security Deception Technology Industry REPORT HIGHLIGHTS
| Aspects | Details |
|---|---|
| Study Period | 2019-2033 |
| Base Year | 2024 |
| Estimated Year | 2025 |
| Forecast Period | 2025-2033 |
| Historical Period | 2019-2024 |
| Growth Rate | CAGR of 14.75% from 2019-2033 |
| Segmentation |
|
Table of Contents
- 1. Introduction
- 1.1. Research Scope
- 1.2. Market Segmentation
- 1.3. Research Methodology
- 1.4. Definitions and Assumptions
- 2. Executive Summary
- 2.1. Introduction
- 3. Market Dynamics
- 3.1. Introduction
- 3.2. Market Drivers
- 3.2.1. Growing Number of Zero-day and Targeted APT's; Need of Effective Solutions for Early Detection of Attackers
- 3.3. Market Restrains
- 3.3.1. High Usage of Legacy Honeypots
- 3.4. Market Trends
- 3.4.1. Network Security is expected to grow at a higher pace
- 4. Market Factor Analysis
- 4.1. Porters Five Forces
- 4.2. Supply/Value Chain
- 4.3. PESTEL analysis
- 4.4. Market Entropy
- 4.5. Patent/Trademark Analysis
- 5. Global Cyber Security Deception Technology Industry Analysis, Insights and Forecast, 2019-2031
- 5.1. Market Analysis, Insights and Forecast - by Deployment
- 5.1.1. Cloud
- 5.1.2. On-premise
- 5.2. Market Analysis, Insights and Forecast - by Organization Size
- 5.2.1. Small and Medium Enterprises
- 5.2.2. Large Enterprises
- 5.3. Market Analysis, Insights and Forecast - by Service
- 5.3.1. Managed Services
- 5.3.2. Professional Services
- 5.4. Market Analysis, Insights and Forecast - by Deception Stack
- 5.4.1. Data Security
- 5.4.2. Application Security
- 5.4.3. Endpoint Security
- 5.4.4. Network Security
- 5.5. Market Analysis, Insights and Forecast - by End-User
- 5.5.1. Government
- 5.5.2. Medical
- 5.5.3. BFSI
- 5.5.4. Defense
- 5.5.5. IT and Telecommunication
- 5.5.6. Other End-Users
- 5.6. Market Analysis, Insights and Forecast - by Region
- 5.6.1. North America
- 5.6.2. Europe
- 5.6.3. Asia Pacific
- 5.6.4. Latin America
- 5.6.5. Middle East and Africa
- 5.1. Market Analysis, Insights and Forecast - by Deployment
- 6. North America Cyber Security Deception Technology Industry Analysis, Insights and Forecast, 2019-2031
- 6.1. Market Analysis, Insights and Forecast - by Deployment
- 6.1.1. Cloud
- 6.1.2. On-premise
- 6.2. Market Analysis, Insights and Forecast - by Organization Size
- 6.2.1. Small and Medium Enterprises
- 6.2.2. Large Enterprises
- 6.3. Market Analysis, Insights and Forecast - by Service
- 6.3.1. Managed Services
- 6.3.2. Professional Services
- 6.4. Market Analysis, Insights and Forecast - by Deception Stack
- 6.4.1. Data Security
- 6.4.2. Application Security
- 6.4.3. Endpoint Security
- 6.4.4. Network Security
- 6.5. Market Analysis, Insights and Forecast - by End-User
- 6.5.1. Government
- 6.5.2. Medical
- 6.5.3. BFSI
- 6.5.4. Defense
- 6.5.5. IT and Telecommunication
- 6.5.6. Other End-Users
- 6.1. Market Analysis, Insights and Forecast - by Deployment
- 7. Europe Cyber Security Deception Technology Industry Analysis, Insights and Forecast, 2019-2031
- 7.1. Market Analysis, Insights and Forecast - by Deployment
- 7.1.1. Cloud
- 7.1.2. On-premise
- 7.2. Market Analysis, Insights and Forecast - by Organization Size
- 7.2.1. Small and Medium Enterprises
- 7.2.2. Large Enterprises
- 7.3. Market Analysis, Insights and Forecast - by Service
- 7.3.1. Managed Services
- 7.3.2. Professional Services
- 7.4. Market Analysis, Insights and Forecast - by Deception Stack
- 7.4.1. Data Security
- 7.4.2. Application Security
- 7.4.3. Endpoint Security
- 7.4.4. Network Security
- 7.5. Market Analysis, Insights and Forecast - by End-User
- 7.5.1. Government
- 7.5.2. Medical
- 7.5.3. BFSI
- 7.5.4. Defense
- 7.5.5. IT and Telecommunication
- 7.5.6. Other End-Users
- 7.1. Market Analysis, Insights and Forecast - by Deployment
- 8. Asia Pacific Cyber Security Deception Technology Industry Analysis, Insights and Forecast, 2019-2031
- 8.1. Market Analysis, Insights and Forecast - by Deployment
- 8.1.1. Cloud
- 8.1.2. On-premise
- 8.2. Market Analysis, Insights and Forecast - by Organization Size
- 8.2.1. Small and Medium Enterprises
- 8.2.2. Large Enterprises
- 8.3. Market Analysis, Insights and Forecast - by Service
- 8.3.1. Managed Services
- 8.3.2. Professional Services
- 8.4. Market Analysis, Insights and Forecast - by Deception Stack
- 8.4.1. Data Security
- 8.4.2. Application Security
- 8.4.3. Endpoint Security
- 8.4.4. Network Security
- 8.5. Market Analysis, Insights and Forecast - by End-User
- 8.5.1. Government
- 8.5.2. Medical
- 8.5.3. BFSI
- 8.5.4. Defense
- 8.5.5. IT and Telecommunication
- 8.5.6. Other End-Users
- 8.1. Market Analysis, Insights and Forecast - by Deployment
- 9. Latin America Cyber Security Deception Technology Industry Analysis, Insights and Forecast, 2019-2031
- 9.1. Market Analysis, Insights and Forecast - by Deployment
- 9.1.1. Cloud
- 9.1.2. On-premise
- 9.2. Market Analysis, Insights and Forecast - by Organization Size
- 9.2.1. Small and Medium Enterprises
- 9.2.2. Large Enterprises
- 9.3. Market Analysis, Insights and Forecast - by Service
- 9.3.1. Managed Services
- 9.3.2. Professional Services
- 9.4. Market Analysis, Insights and Forecast - by Deception Stack
- 9.4.1. Data Security
- 9.4.2. Application Security
- 9.4.3. Endpoint Security
- 9.4.4. Network Security
- 9.5. Market Analysis, Insights and Forecast - by End-User
- 9.5.1. Government
- 9.5.2. Medical
- 9.5.3. BFSI
- 9.5.4. Defense
- 9.5.5. IT and Telecommunication
- 9.5.6. Other End-Users
- 9.1. Market Analysis, Insights and Forecast - by Deployment
- 10. Middle East and Africa Cyber Security Deception Technology Industry Analysis, Insights and Forecast, 2019-2031
- 10.1. Market Analysis, Insights and Forecast - by Deployment
- 10.1.1. Cloud
- 10.1.2. On-premise
- 10.2. Market Analysis, Insights and Forecast - by Organization Size
- 10.2.1. Small and Medium Enterprises
- 10.2.2. Large Enterprises
- 10.3. Market Analysis, Insights and Forecast - by Service
- 10.3.1. Managed Services
- 10.3.2. Professional Services
- 10.4. Market Analysis, Insights and Forecast - by Deception Stack
- 10.4.1. Data Security
- 10.4.2. Application Security
- 10.4.3. Endpoint Security
- 10.4.4. Network Security
- 10.5. Market Analysis, Insights and Forecast - by End-User
- 10.5.1. Government
- 10.5.2. Medical
- 10.5.3. BFSI
- 10.5.4. Defense
- 10.5.5. IT and Telecommunication
- 10.5.6. Other End-Users
- 10.1. Market Analysis, Insights and Forecast - by Deployment
- 11. North America Cyber Security Deception Technology Industry Analysis, Insights and Forecast, 2019-2031
- 11.1. Market Analysis, Insights and Forecast - By Country/Sub-region
- 11.1.1.
- 12. Europe Cyber Security Deception Technology Industry Analysis, Insights and Forecast, 2019-2031
- 12.1. Market Analysis, Insights and Forecast - By Country/Sub-region
- 12.1.1.
- 13. Asia Pacific Cyber Security Deception Technology Industry Analysis, Insights and Forecast, 2019-2031
- 13.1. Market Analysis, Insights and Forecast - By Country/Sub-region
- 13.1.1.
- 14. Latin America Cyber Security Deception Technology Industry Analysis, Insights and Forecast, 2019-2031
- 14.1. Market Analysis, Insights and Forecast - By Country/Sub-region
- 14.1.1.
- 15. Middle East and Africa Cyber Security Deception Technology Industry Analysis, Insights and Forecast, 2019-2031
- 15.1. Market Analysis, Insights and Forecast - By Country/Sub-region
- 15.1.1.
- 16. Competitive Analysis
- 16.1. Global Market Share Analysis 2024
- 16.2. Company Profiles
- 16.2.1 Rapid7 LLC
- 16.2.1.1. Overview
- 16.2.1.2. Products
- 16.2.1.3. SWOT Analysis
- 16.2.1.4. Recent Developments
- 16.2.1.5. Financials (Based on Availability)
- 16.2.2 WatchGuard Technologies Inc
- 16.2.2.1. Overview
- 16.2.2.2. Products
- 16.2.2.3. SWOT Analysis
- 16.2.2.4. Recent Developments
- 16.2.2.5. Financials (Based on Availability)
- 16.2.3 Akamai Technologies Inc
- 16.2.3.1. Overview
- 16.2.3.2. Products
- 16.2.3.3. SWOT Analysis
- 16.2.3.4. Recent Developments
- 16.2.3.5. Financials (Based on Availability)
- 16.2.4 Illusive Networks
- 16.2.4.1. Overview
- 16.2.4.2. Products
- 16.2.4.3. SWOT Analysis
- 16.2.4.4. Recent Developments
- 16.2.4.5. Financials (Based on Availability)
- 16.2.5 Fidelis Cybersecurity Inc (Skyview Capital LLC)
- 16.2.5.1. Overview
- 16.2.5.2. Products
- 16.2.5.3. SWOT Analysis
- 16.2.5.4. Recent Developments
- 16.2.5.5. Financials (Based on Availability)
- 16.2.6 Broadcom Inc (Symantec Corporation
- 16.2.6.1. Overview
- 16.2.6.2. Products
- 16.2.6.3. SWOT Analysis
- 16.2.6.4. Recent Developments
- 16.2.6.5. Financials (Based on Availability)
- 16.2.7 Ridgeback Network Defense Inc
- 16.2.7.1. Overview
- 16.2.7.2. Products
- 16.2.7.3. SWOT Analysis
- 16.2.7.4. Recent Developments
- 16.2.7.5. Financials (Based on Availability)
- 16.2.8 Smokescreen Technologies Pvt Ltd
- 16.2.8.1. Overview
- 16.2.8.2. Products
- 16.2.8.3. SWOT Analysis
- 16.2.8.4. Recent Developments
- 16.2.8.5. Financials (Based on Availability)
- 16.2.9 LogRhythm Inc
- 16.2.9.1. Overview
- 16.2.9.2. Products
- 16.2.9.3. SWOT Analysis
- 16.2.9.4. Recent Developments
- 16.2.9.5. Financials (Based on Availability)
- 16.2.10 Attivo Networks Inc (Sentinelone Inc )
- 16.2.10.1. Overview
- 16.2.10.2. Products
- 16.2.10.3. SWOT Analysis
- 16.2.10.4. Recent Developments
- 16.2.10.5. Financials (Based on Availability)
- 16.2.11 NTT Security Limited (Nippon Telegraph and Telephone Corporation)
- 16.2.11.1. Overview
- 16.2.11.2. Products
- 16.2.11.3. SWOT Analysis
- 16.2.11.4. Recent Developments
- 16.2.11.5. Financials (Based on Availability)
- 16.2.12 Acalvio Technologies Inc
- 16.2.12.1. Overview
- 16.2.12.2. Products
- 16.2.12.3. SWOT Analysis
- 16.2.12.4. Recent Developments
- 16.2.12.5. Financials (Based on Availability)
- 16.2.13 CyberTrap Software GmbH
- 16.2.13.1. Overview
- 16.2.13.2. Products
- 16.2.13.3. SWOT Analysis
- 16.2.13.4. Recent Developments
- 16.2.13.5. Financials (Based on Availability)
- 16.2.14 CounterCraft SL
- 16.2.14.1. Overview
- 16.2.14.2. Products
- 16.2.14.3. SWOT Analysis
- 16.2.14.4. Recent Developments
- 16.2.14.5. Financials (Based on Availability)
- 16.2.15 Commvault Systems Inc
- 16.2.15.1. Overview
- 16.2.15.2. Products
- 16.2.15.3. SWOT Analysis
- 16.2.15.4. Recent Developments
- 16.2.15.5. Financials (Based on Availability)
- 16.2.1 Rapid7 LLC
List of Figures
- Figure 1: Global Cyber Security Deception Technology Industry Revenue Breakdown (Million, %) by Region 2024 & 2032
- Figure 2: North America Cyber Security Deception Technology Industry Revenue (Million), by Country 2024 & 2032
- Figure 3: North America Cyber Security Deception Technology Industry Revenue Share (%), by Country 2024 & 2032
- Figure 4: Europe Cyber Security Deception Technology Industry Revenue (Million), by Country 2024 & 2032
- Figure 5: Europe Cyber Security Deception Technology Industry Revenue Share (%), by Country 2024 & 2032
- Figure 6: Asia Pacific Cyber Security Deception Technology Industry Revenue (Million), by Country 2024 & 2032
- Figure 7: Asia Pacific Cyber Security Deception Technology Industry Revenue Share (%), by Country 2024 & 2032
- Figure 8: Latin America Cyber Security Deception Technology Industry Revenue (Million), by Country 2024 & 2032
- Figure 9: Latin America Cyber Security Deception Technology Industry Revenue Share (%), by Country 2024 & 2032
- Figure 10: Middle East and Africa Cyber Security Deception Technology Industry Revenue (Million), by Country 2024 & 2032
- Figure 11: Middle East and Africa Cyber Security Deception Technology Industry Revenue Share (%), by Country 2024 & 2032
- Figure 12: North America Cyber Security Deception Technology Industry Revenue (Million), by Deployment 2024 & 2032
- Figure 13: North America Cyber Security Deception Technology Industry Revenue Share (%), by Deployment 2024 & 2032
- Figure 14: North America Cyber Security Deception Technology Industry Revenue (Million), by Organization Size 2024 & 2032
- Figure 15: North America Cyber Security Deception Technology Industry Revenue Share (%), by Organization Size 2024 & 2032
- Figure 16: North America Cyber Security Deception Technology Industry Revenue (Million), by Service 2024 & 2032
- Figure 17: North America Cyber Security Deception Technology Industry Revenue Share (%), by Service 2024 & 2032
- Figure 18: North America Cyber Security Deception Technology Industry Revenue (Million), by Deception Stack 2024 & 2032
- Figure 19: North America Cyber Security Deception Technology Industry Revenue Share (%), by Deception Stack 2024 & 2032
- Figure 20: North America Cyber Security Deception Technology Industry Revenue (Million), by End-User 2024 & 2032
- Figure 21: North America Cyber Security Deception Technology Industry Revenue Share (%), by End-User 2024 & 2032
- Figure 22: North America Cyber Security Deception Technology Industry Revenue (Million), by Country 2024 & 2032
- Figure 23: North America Cyber Security Deception Technology Industry Revenue Share (%), by Country 2024 & 2032
- Figure 24: Europe Cyber Security Deception Technology Industry Revenue (Million), by Deployment 2024 & 2032
- Figure 25: Europe Cyber Security Deception Technology Industry Revenue Share (%), by Deployment 2024 & 2032
- Figure 26: Europe Cyber Security Deception Technology Industry Revenue (Million), by Organization Size 2024 & 2032
- Figure 27: Europe Cyber Security Deception Technology Industry Revenue Share (%), by Organization Size 2024 & 2032
- Figure 28: Europe Cyber Security Deception Technology Industry Revenue (Million), by Service 2024 & 2032
- Figure 29: Europe Cyber Security Deception Technology Industry Revenue Share (%), by Service 2024 & 2032
- Figure 30: Europe Cyber Security Deception Technology Industry Revenue (Million), by Deception Stack 2024 & 2032
- Figure 31: Europe Cyber Security Deception Technology Industry Revenue Share (%), by Deception Stack 2024 & 2032
- Figure 32: Europe Cyber Security Deception Technology Industry Revenue (Million), by End-User 2024 & 2032
- Figure 33: Europe Cyber Security Deception Technology Industry Revenue Share (%), by End-User 2024 & 2032
- Figure 34: Europe Cyber Security Deception Technology Industry Revenue (Million), by Country 2024 & 2032
- Figure 35: Europe Cyber Security Deception Technology Industry Revenue Share (%), by Country 2024 & 2032
- Figure 36: Asia Pacific Cyber Security Deception Technology Industry Revenue (Million), by Deployment 2024 & 2032
- Figure 37: Asia Pacific Cyber Security Deception Technology Industry Revenue Share (%), by Deployment 2024 & 2032
- Figure 38: Asia Pacific Cyber Security Deception Technology Industry Revenue (Million), by Organization Size 2024 & 2032
- Figure 39: Asia Pacific Cyber Security Deception Technology Industry Revenue Share (%), by Organization Size 2024 & 2032
- Figure 40: Asia Pacific Cyber Security Deception Technology Industry Revenue (Million), by Service 2024 & 2032
- Figure 41: Asia Pacific Cyber Security Deception Technology Industry Revenue Share (%), by Service 2024 & 2032
- Figure 42: Asia Pacific Cyber Security Deception Technology Industry Revenue (Million), by Deception Stack 2024 & 2032
- Figure 43: Asia Pacific Cyber Security Deception Technology Industry Revenue Share (%), by Deception Stack 2024 & 2032
- Figure 44: Asia Pacific Cyber Security Deception Technology Industry Revenue (Million), by End-User 2024 & 2032
- Figure 45: Asia Pacific Cyber Security Deception Technology Industry Revenue Share (%), by End-User 2024 & 2032
- Figure 46: Asia Pacific Cyber Security Deception Technology Industry Revenue (Million), by Country 2024 & 2032
- Figure 47: Asia Pacific Cyber Security Deception Technology Industry Revenue Share (%), by Country 2024 & 2032
- Figure 48: Latin America Cyber Security Deception Technology Industry Revenue (Million), by Deployment 2024 & 2032
- Figure 49: Latin America Cyber Security Deception Technology Industry Revenue Share (%), by Deployment 2024 & 2032
- Figure 50: Latin America Cyber Security Deception Technology Industry Revenue (Million), by Organization Size 2024 & 2032
- Figure 51: Latin America Cyber Security Deception Technology Industry Revenue Share (%), by Organization Size 2024 & 2032
- Figure 52: Latin America Cyber Security Deception Technology Industry Revenue (Million), by Service 2024 & 2032
- Figure 53: Latin America Cyber Security Deception Technology Industry Revenue Share (%), by Service 2024 & 2032
- Figure 54: Latin America Cyber Security Deception Technology Industry Revenue (Million), by Deception Stack 2024 & 2032
- Figure 55: Latin America Cyber Security Deception Technology Industry Revenue Share (%), by Deception Stack 2024 & 2032
- Figure 56: Latin America Cyber Security Deception Technology Industry Revenue (Million), by End-User 2024 & 2032
- Figure 57: Latin America Cyber Security Deception Technology Industry Revenue Share (%), by End-User 2024 & 2032
- Figure 58: Latin America Cyber Security Deception Technology Industry Revenue (Million), by Country 2024 & 2032
- Figure 59: Latin America Cyber Security Deception Technology Industry Revenue Share (%), by Country 2024 & 2032
- Figure 60: Middle East and Africa Cyber Security Deception Technology Industry Revenue (Million), by Deployment 2024 & 2032
- Figure 61: Middle East and Africa Cyber Security Deception Technology Industry Revenue Share (%), by Deployment 2024 & 2032
- Figure 62: Middle East and Africa Cyber Security Deception Technology Industry Revenue (Million), by Organization Size 2024 & 2032
- Figure 63: Middle East and Africa Cyber Security Deception Technology Industry Revenue Share (%), by Organization Size 2024 & 2032
- Figure 64: Middle East and Africa Cyber Security Deception Technology Industry Revenue (Million), by Service 2024 & 2032
- Figure 65: Middle East and Africa Cyber Security Deception Technology Industry Revenue Share (%), by Service 2024 & 2032
- Figure 66: Middle East and Africa Cyber Security Deception Technology Industry Revenue (Million), by Deception Stack 2024 & 2032
- Figure 67: Middle East and Africa Cyber Security Deception Technology Industry Revenue Share (%), by Deception Stack 2024 & 2032
- Figure 68: Middle East and Africa Cyber Security Deception Technology Industry Revenue (Million), by End-User 2024 & 2032
- Figure 69: Middle East and Africa Cyber Security Deception Technology Industry Revenue Share (%), by End-User 2024 & 2032
- Figure 70: Middle East and Africa Cyber Security Deception Technology Industry Revenue (Million), by Country 2024 & 2032
- Figure 71: Middle East and Africa Cyber Security Deception Technology Industry Revenue Share (%), by Country 2024 & 2032
List of Tables
- Table 1: Global Cyber Security Deception Technology Industry Revenue Million Forecast, by Region 2019 & 2032
- Table 2: Global Cyber Security Deception Technology Industry Revenue Million Forecast, by Deployment 2019 & 2032
- Table 3: Global Cyber Security Deception Technology Industry Revenue Million Forecast, by Organization Size 2019 & 2032
- Table 4: Global Cyber Security Deception Technology Industry Revenue Million Forecast, by Service 2019 & 2032
- Table 5: Global Cyber Security Deception Technology Industry Revenue Million Forecast, by Deception Stack 2019 & 2032
- Table 6: Global Cyber Security Deception Technology Industry Revenue Million Forecast, by End-User 2019 & 2032
- Table 7: Global Cyber Security Deception Technology Industry Revenue Million Forecast, by Region 2019 & 2032
- Table 8: Global Cyber Security Deception Technology Industry Revenue Million Forecast, by Country 2019 & 2032
- Table 9: Cyber Security Deception Technology Industry Revenue (Million) Forecast, by Application 2019 & 2032
- Table 10: Global Cyber Security Deception Technology Industry Revenue Million Forecast, by Country 2019 & 2032
- Table 11: Cyber Security Deception Technology Industry Revenue (Million) Forecast, by Application 2019 & 2032
- Table 12: Global Cyber Security Deception Technology Industry Revenue Million Forecast, by Country 2019 & 2032
- Table 13: Cyber Security Deception Technology Industry Revenue (Million) Forecast, by Application 2019 & 2032
- Table 14: Global Cyber Security Deception Technology Industry Revenue Million Forecast, by Country 2019 & 2032
- Table 15: Cyber Security Deception Technology Industry Revenue (Million) Forecast, by Application 2019 & 2032
- Table 16: Global Cyber Security Deception Technology Industry Revenue Million Forecast, by Country 2019 & 2032
- Table 17: Cyber Security Deception Technology Industry Revenue (Million) Forecast, by Application 2019 & 2032
- Table 18: Global Cyber Security Deception Technology Industry Revenue Million Forecast, by Deployment 2019 & 2032
- Table 19: Global Cyber Security Deception Technology Industry Revenue Million Forecast, by Organization Size 2019 & 2032
- Table 20: Global Cyber Security Deception Technology Industry Revenue Million Forecast, by Service 2019 & 2032
- Table 21: Global Cyber Security Deception Technology Industry Revenue Million Forecast, by Deception Stack 2019 & 2032
- Table 22: Global Cyber Security Deception Technology Industry Revenue Million Forecast, by End-User 2019 & 2032
- Table 23: Global Cyber Security Deception Technology Industry Revenue Million Forecast, by Country 2019 & 2032
- Table 24: Global Cyber Security Deception Technology Industry Revenue Million Forecast, by Deployment 2019 & 2032
- Table 25: Global Cyber Security Deception Technology Industry Revenue Million Forecast, by Organization Size 2019 & 2032
- Table 26: Global Cyber Security Deception Technology Industry Revenue Million Forecast, by Service 2019 & 2032
- Table 27: Global Cyber Security Deception Technology Industry Revenue Million Forecast, by Deception Stack 2019 & 2032
- Table 28: Global Cyber Security Deception Technology Industry Revenue Million Forecast, by End-User 2019 & 2032
- Table 29: Global Cyber Security Deception Technology Industry Revenue Million Forecast, by Country 2019 & 2032
- Table 30: Global Cyber Security Deception Technology Industry Revenue Million Forecast, by Deployment 2019 & 2032
- Table 31: Global Cyber Security Deception Technology Industry Revenue Million Forecast, by Organization Size 2019 & 2032
- Table 32: Global Cyber Security Deception Technology Industry Revenue Million Forecast, by Service 2019 & 2032
- Table 33: Global Cyber Security Deception Technology Industry Revenue Million Forecast, by Deception Stack 2019 & 2032
- Table 34: Global Cyber Security Deception Technology Industry Revenue Million Forecast, by End-User 2019 & 2032
- Table 35: Global Cyber Security Deception Technology Industry Revenue Million Forecast, by Country 2019 & 2032
- Table 36: Global Cyber Security Deception Technology Industry Revenue Million Forecast, by Deployment 2019 & 2032
- Table 37: Global Cyber Security Deception Technology Industry Revenue Million Forecast, by Organization Size 2019 & 2032
- Table 38: Global Cyber Security Deception Technology Industry Revenue Million Forecast, by Service 2019 & 2032
- Table 39: Global Cyber Security Deception Technology Industry Revenue Million Forecast, by Deception Stack 2019 & 2032
- Table 40: Global Cyber Security Deception Technology Industry Revenue Million Forecast, by End-User 2019 & 2032
- Table 41: Global Cyber Security Deception Technology Industry Revenue Million Forecast, by Country 2019 & 2032
- Table 42: Global Cyber Security Deception Technology Industry Revenue Million Forecast, by Deployment 2019 & 2032
- Table 43: Global Cyber Security Deception Technology Industry Revenue Million Forecast, by Organization Size 2019 & 2032
- Table 44: Global Cyber Security Deception Technology Industry Revenue Million Forecast, by Service 2019 & 2032
- Table 45: Global Cyber Security Deception Technology Industry Revenue Million Forecast, by Deception Stack 2019 & 2032
- Table 46: Global Cyber Security Deception Technology Industry Revenue Million Forecast, by End-User 2019 & 2032
- Table 47: Global Cyber Security Deception Technology Industry Revenue Million Forecast, by Country 2019 & 2032
Frequently Asked Questions
1. What is the projected Compound Annual Growth Rate (CAGR) of the Cyber Security Deception Technology Industry?
The projected CAGR is approximately 14.75%.
2. Which companies are prominent players in the Cyber Security Deception Technology Industry?
Key companies in the market include Rapid7 LLC, WatchGuard Technologies Inc, Akamai Technologies Inc, Illusive Networks, Fidelis Cybersecurity Inc (Skyview Capital LLC), Broadcom Inc (Symantec Corporation, Ridgeback Network Defense Inc, Smokescreen Technologies Pvt Ltd, LogRhythm Inc, Attivo Networks Inc (Sentinelone Inc ), NTT Security Limited (Nippon Telegraph and Telephone Corporation), Acalvio Technologies Inc, CyberTrap Software GmbH, CounterCraft SL, Commvault Systems Inc.
3. What are the main segments of the Cyber Security Deception Technology Industry?
The market segments include Deployment, Organization Size, Service, Deception Stack, End-User.
4. Can you provide details about the market size?
The market size is estimated to be USD 2.27 Million as of 2022.
5. What are some drivers contributing to market growth?
Growing Number of Zero-day and Targeted APT's; Need of Effective Solutions for Early Detection of Attackers.
6. What are the notable trends driving market growth?
Network Security is expected to grow at a higher pace.
7. Are there any restraints impacting market growth?
High Usage of Legacy Honeypots.
8. Can you provide examples of recent developments in the market?
March 2023: Rapid7 announced the acquisition of Minerva Labs Ltd., which is a leading provider of anti-evasion and ransomware prevention technology.
9. What pricing options are available for accessing the report?
Pricing options include single-user, multi-user, and enterprise licenses priced at USD 4750, USD 5250, and USD 8750 respectively.
10. Is the market size provided in terms of value or volume?
The market size is provided in terms of value, measured in Million.
11. Are there any specific market keywords associated with the report?
Yes, the market keyword associated with the report is "Cyber Security Deception Technology Industry," which aids in identifying and referencing the specific market segment covered.
12. How do I determine which pricing option suits my needs best?
The pricing options vary based on user requirements and access needs. Individual users may opt for single-user licenses, while businesses requiring broader access may choose multi-user or enterprise licenses for cost-effective access to the report.
13. Are there any additional resources or data provided in the Cyber Security Deception Technology Industry report?
While the report offers comprehensive insights, it's advisable to review the specific contents or supplementary materials provided to ascertain if additional resources or data are available.
14. How can I stay updated on further developments or reports in the Cyber Security Deception Technology Industry?
To stay informed about further developments, trends, and reports in the Cyber Security Deception Technology Industry, consider subscribing to industry newsletters, following relevant companies and organizations, or regularly checking reputable industry news sources and publications.
Methodology
Step 1 - Identification of Relevant Samples Size from Population Database


Step 2 - Approaches for Defining Global Market Size (Value, Volume* & Price*)

Note*: In applicable scenarios
Step 3 - Data Sources
Primary Research
- Web Analytics
- Survey Reports
- Research Institute
- Latest Research Reports
- Opinion Leaders
Secondary Research
- Annual Reports
- White Paper
- Latest Press Release
- Industry Association
- Paid Database
- Investor Presentations

Step 4 - Data Triangulation
Involves using different sources of information in order to increase the validity of a study
These sources are likely to be stakeholders in a program - participants, other researchers, program staff, other community members, and so on.
Then we put all data in single framework & apply various statistical tools to find out the dynamic on the market.
During the analysis stage, feedback from the stakeholder groups would be compared to determine areas of agreement as well as areas of divergence


