
Key Insights
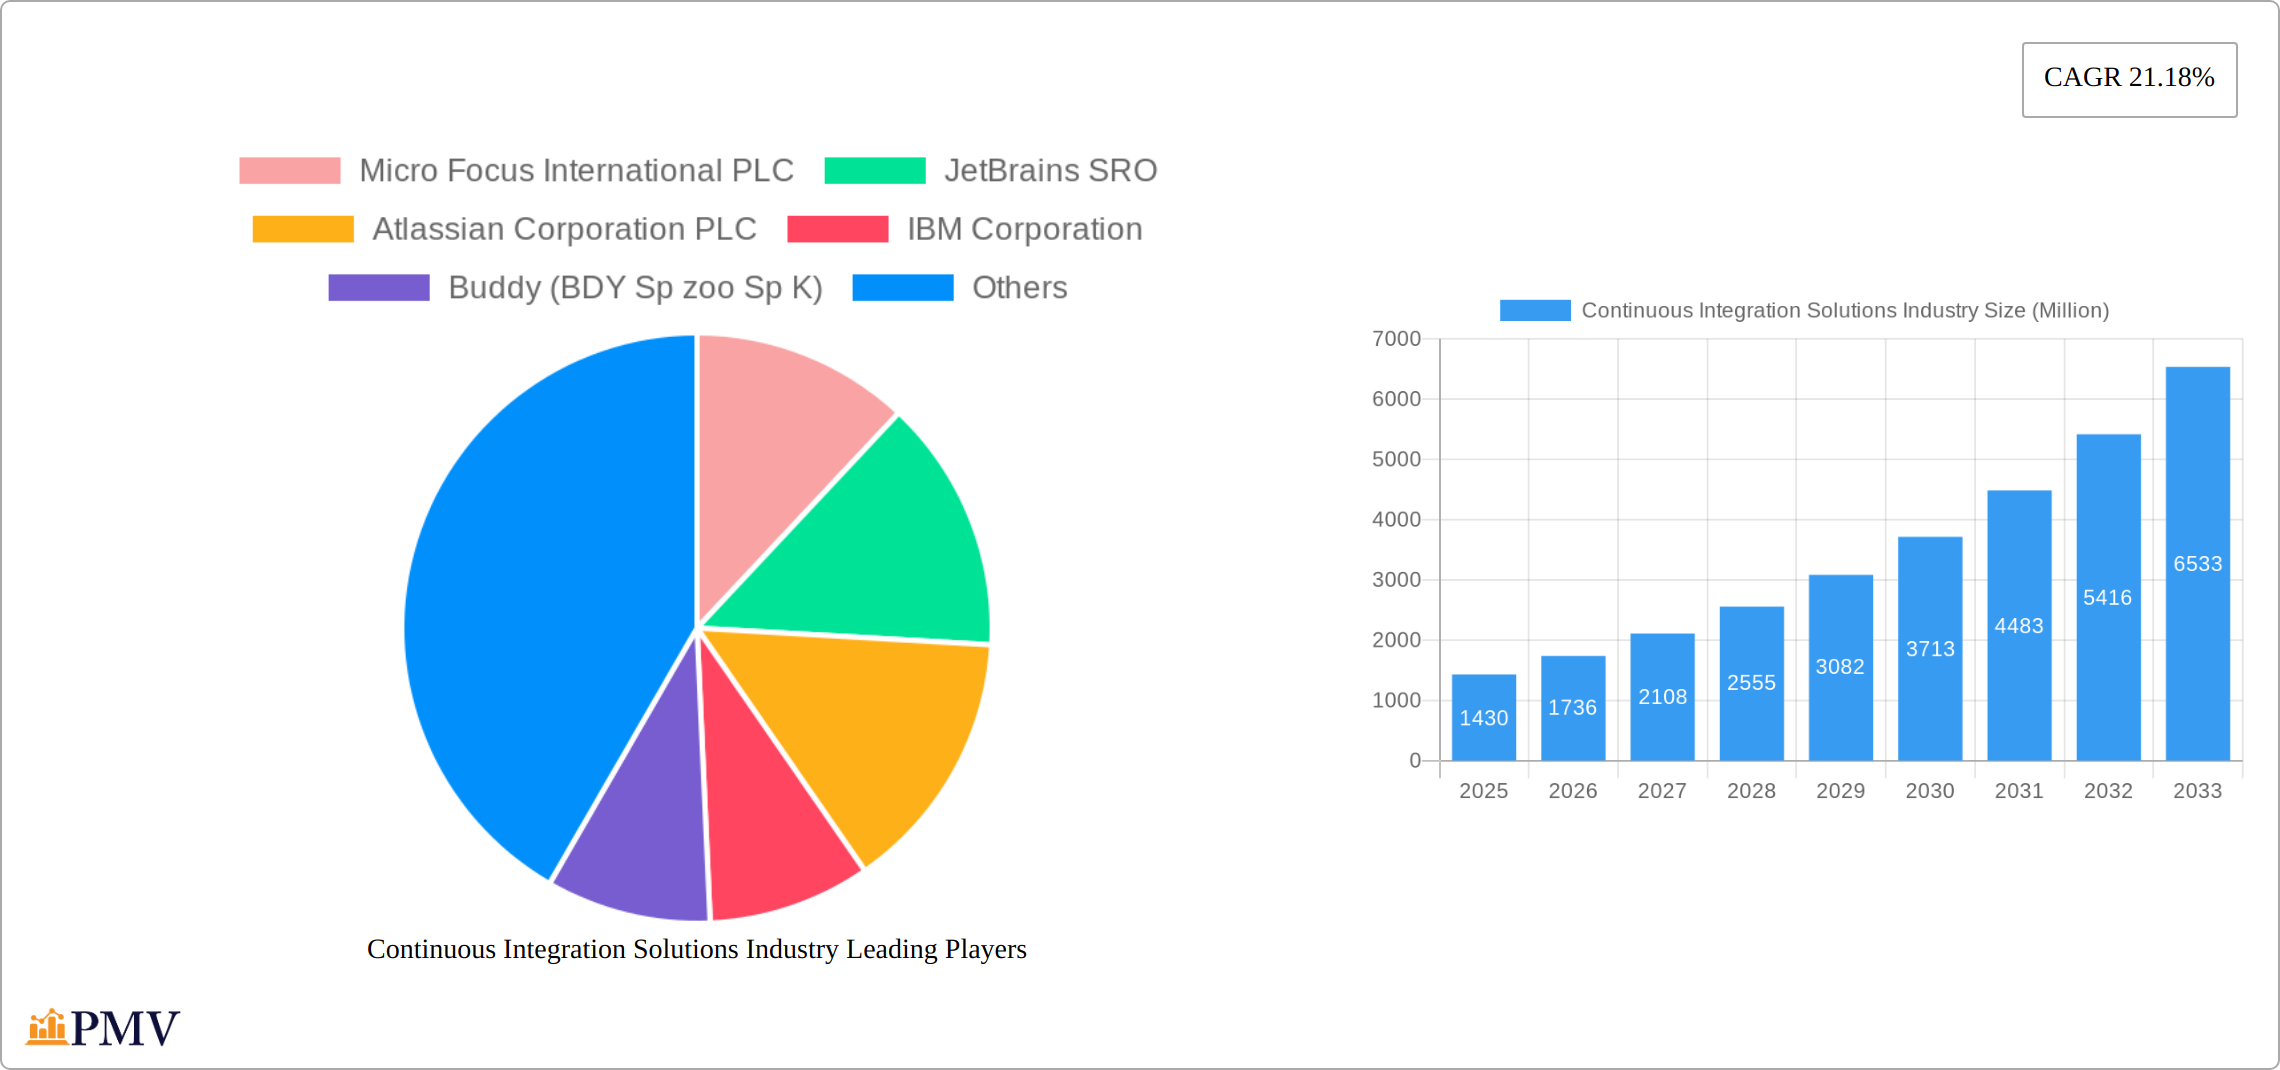
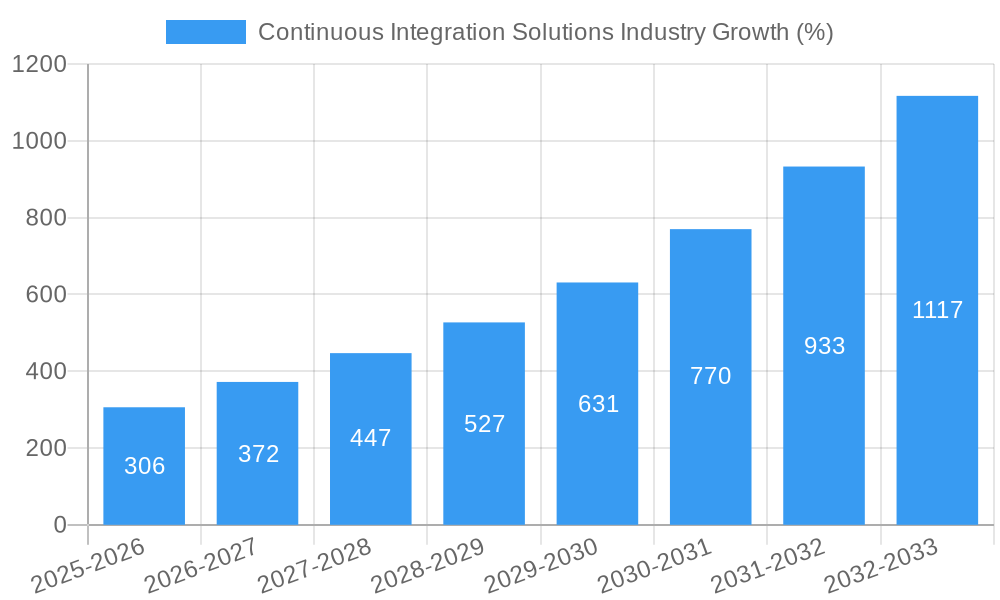
The Continuous Integration (CI) Solutions market is experiencing robust growth, projected to reach a value of $1.43 billion in 2025 and exhibiting a Compound Annual Growth Rate (CAGR) of 21.18% from 2025 to 2033. This expansion is fueled by several key factors. The increasing adoption of DevOps practices across diverse industries, including IT & Telecom, Retail & E-commerce, Healthcare & Life Sciences, BFSI, and Media & Entertainment, is a primary driver. Businesses are prioritizing faster release cycles, improved software quality, and enhanced collaboration, all of which CI solutions directly support. The shift towards cloud-based deployments further accelerates market growth, offering scalability, cost-effectiveness, and accessibility benefits compared to on-premise solutions. Growing complexity in software development and the need for automated testing and deployment pipelines also contribute to the rising demand for CI solutions. Competition among numerous vendors, including established players like Micro Focus, JetBrains, Atlassian, and IBM, alongside agile startups like Buddy and GitLab, ensures innovation and diverse offerings catering to various business needs and scales.
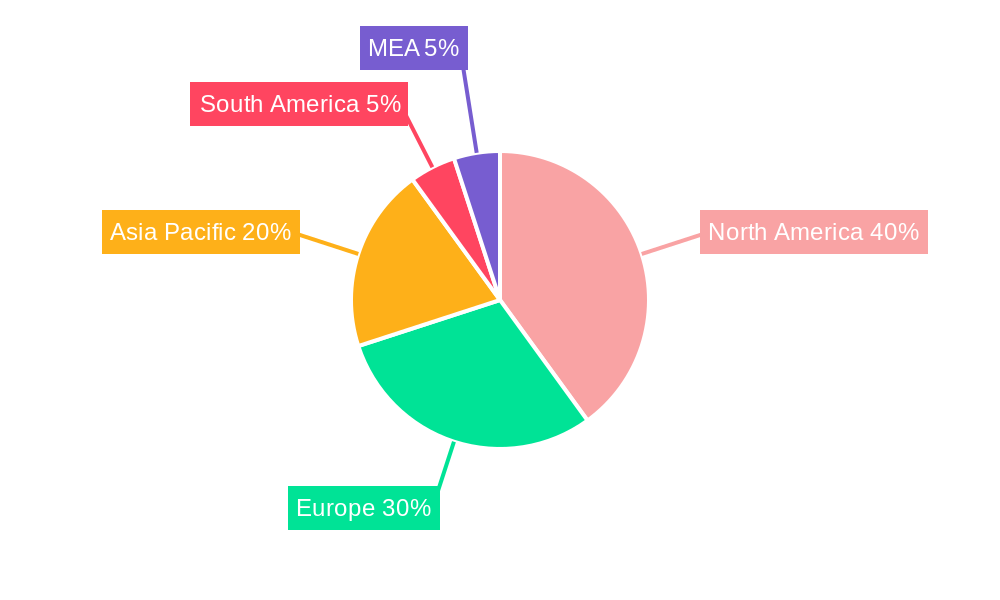
The market segmentation reveals a strong preference for cloud-based CI solutions, driven by the inherent advantages of cloud infrastructure. Geographically, North America and Europe currently hold significant market share, but the Asia-Pacific region is poised for rapid growth due to increasing digital transformation initiatives and a burgeoning technology sector. While some restraints such as initial implementation costs and the need for skilled personnel exist, the overall market outlook remains positive, driven by the undeniable benefits of CI for achieving efficient and high-quality software delivery. The market's continued expansion is likely to be shaped by advancements in artificial intelligence (AI) and machine learning (ML) integration within CI/CD pipelines, further automating and optimizing the software development lifecycle.
Continuous Integration Solutions Industry: A Comprehensive Market Report (2019-2033)
This comprehensive report provides an in-depth analysis of the Continuous Integration (CI) solutions market, offering valuable insights for businesses, investors, and stakeholders seeking to understand this rapidly evolving landscape. The report covers the period 2019-2033, with a focus on the 2025-2033 forecast period. The total market size is projected to reach $XX Million by 2033, exhibiting a CAGR of XX% during the forecast period.
Continuous Integration Solutions Industry Market Structure & Competitive Dynamics
The Continuous Integration solutions market is characterized by a dynamic competitive landscape with a mix of established players and emerging startups. Market concentration is moderate, with a few dominant players controlling a significant share, while numerous smaller companies compete for niche markets. The industry is highly innovative, driven by continuous advancements in DevOps practices and cloud technologies. Regulatory frameworks, while not overly restrictive, are evolving to address data security and privacy concerns, impacting vendor strategies. Product substitutes, primarily focused on streamlined in-house development solutions, present a competitive challenge, particularly for smaller players. End-user trends toward automation and agility are driving significant market growth. M&A activity is relatively high, with deals valued at approximately $XX Million in 2024, reflecting industry consolidation and expansion efforts.
- Market Share: The top five players—Micro Focus International PLC, JetBrains SRO, Atlassian Corporation PLC, IBM Corporation, and Amazon Web Services Inc.— collectively hold approximately XX% of the market share.
- M&A Activity: Key mergers and acquisitions involve strategic partnerships and technology integrations, fostering innovation and expansion into new markets.
Continuous Integration Solutions Industry Industry Trends & Insights
The CI solutions market is experiencing robust growth, propelled by several key factors. The increasing adoption of DevOps methodologies across various industries is a major driver, as organizations seek to accelerate software development cycles and enhance operational efficiency. The shift towards cloud-based CI/CD platforms offers scalability, cost-effectiveness, and improved collaboration, boosting market penetration. Technological advancements, such as AI-powered testing and automated deployment, are further fueling growth. The preference for agile development processes and continuous delivery practices significantly influences the market. Intense competition among established players and emerging startups drives innovation and competitive pricing, enhancing market dynamics. The market is expected to witness a CAGR of XX% between 2025 and 2033, reaching a projected market value of $XX Million by 2033. Market penetration in key segments such as IT and Telecom is expected to exceed XX% by 2033.
Dominant Markets & Segments in Continuous Integration Solutions Industry
The Cloud deployment segment dominates the CI solutions market, accounting for approximately XX% of the total market revenue in 2025. The IT and Telecom industry is the largest end-user segment, demonstrating significant adoption of CI/CD pipelines.
Key Drivers for Cloud Segment Dominance:
- Scalability and flexibility
- Cost-effectiveness
- Enhanced collaboration capabilities
- Easier integration with other cloud services
Key Drivers for IT and Telecom Industry Dominance:
- High software development intensity
- Need for rapid software updates and releases
- Focus on agility and efficiency
The dominance of the Cloud and IT and Telecom segments stems from the high adoption of DevOps methodologies, preference for cloud-based solutions, and the inherent need for rapid software development and deployment in this sector.
Continuous Integration Solutions Industry Product Innovations
Recent product innovations focus on AI-powered testing, enhanced security features, improved integration with DevOps tools, and serverless architectures. These advancements are designed to improve the efficiency, reliability, and security of CI/CD pipelines. Market fit is demonstrated through increased adoption rates and positive user reviews, underscoring the success of these product developments. The incorporation of advanced analytics and machine learning capabilities is a prominent trend, enabling automated issue detection and intelligent resource allocation.
Report Segmentation & Scope
This report segments the CI solutions market by deployment (on-premise, cloud) and end-user industry (IT and Telecom, Retail and E-commerce, Healthcare and Life Sciences, BFSI, Media and Entertainment, Other End-User Industries). Each segment’s growth projections, market size estimations, and competitive dynamics are analyzed.
- On-Premise Deployment: This segment is experiencing slower growth due to the increasing adoption of cloud-based solutions. It still holds a significant share, particularly in organizations with stringent security or regulatory requirements.
- Cloud Deployment: This segment shows robust growth, driven by its scalability, cost-efficiency, and accessibility.
- End-User Industries: Each industry segment shows varying growth rates depending on its digital transformation strategy, software development intensity, and technological adoption.
Key Drivers of Continuous Integration Solutions Industry Growth
The continuous integration solutions market's growth is fueled by several key drivers: the rising adoption of DevOps methodologies, the increasing shift toward cloud-based solutions, advancements in AI and machine learning technologies within CI/CD pipelines, and the growing demand for faster software development and deployment cycles. Stringent regulatory compliance requirements in specific industries also drive the demand for robust and secure CI/CD tools. Economic factors such as increased investments in digital transformation initiatives across various industries further contribute to the market growth.
Challenges in the Continuous Integration Solutions Industry Sector
The CI solutions industry faces challenges including the complexity of integrating various tools and technologies within the CI/CD pipeline, maintaining security and data privacy across the development process, and adapting to the rapid evolution of software development technologies. Competition from open-source solutions and the need for skilled professionals to manage complex CI/CD setups also pose considerable challenges. The cost of implementation and maintenance can be significant, particularly for smaller organizations, thus representing a barrier to entry. The total impact of these challenges on market growth is estimated to be approximately XX% reduction in the overall CAGR by 2033.
Leading Players in the Continuous Integration Solutions Industry Market
- Micro Focus International PLC
- JetBrains SRO
- Atlassian Corporation PLC
- IBM Corporation
- Buddy (BDY Sp zoo Sp K)
- Circle Internet Services Inc
- Thoughtworks Inc
- Microsoft Corporation
- Amazon Web Services Inc
- Travis CI GmbH
- GitLab Inc
- CodeShip Inc
Key Developments in Continuous Integration Solutions Industry Sector
- July 2022: CircleCI announced general availability of support for GitLab SaaS users, enhancing interoperability and access to CircleCI's advanced features. This significantly broadened CircleCI's user base and reinforced its position as a leading CI/CD platform.
- December 2022: Amazon launched Amazon CodeCatalyst, a unified software development and delivery service, streamlining the development lifecycle on AWS. This significantly enhanced the AWS ecosystem for CI/CD and boosted its competitive advantage in the market.
Strategic Continuous Integration Solutions Industry Market Outlook
The future of the CI solutions market is bright, with continued growth driven by increasing digital transformation initiatives across diverse industries. Strategic opportunities lie in expanding into niche markets, developing AI-powered CI/CD tools, and focusing on improving security and compliance features. Partnerships and collaborations will be crucial for driving innovation and expanding market reach. The focus on enhancing the user experience and providing comprehensive support services will also be key to market success.
Continuous Integration Solutions Industry Segmentation
-
1. Deployment
- 1.1. On-premise
- 1.2. Cloud
-
2. End-User Industry
- 2.1. IT and Telecom
- 2.2. Retail and E-commerce
- 2.3. Healthcare and Life Sciences
Continuous Integration Solutions Industry Segmentation By Geography
- 1. North America
- 2. Europe
- 3. Asia Pacific
- 4. Latin America
- 5. Middle East and Africa
Continuous Integration Solutions Industry REPORT HIGHLIGHTS
| Aspects | Details |
|---|---|
| Study Period | 2019-2033 |
| Base Year | 2024 |
| Estimated Year | 2025 |
| Forecast Period | 2025-2033 |
| Historical Period | 2019-2024 |
| Growth Rate | CAGR of 21.18% from 2019-2033 |
| Segmentation |
|
Table of Contents
- 1. Introduction
- 1.1. Research Scope
- 1.2. Market Segmentation
- 1.3. Research Methodology
- 1.4. Definitions and Assumptions
- 2. Executive Summary
- 2.1. Introduction
- 3. Market Dynamics
- 3.1. Introduction
- 3.2. Market Drivers
- 3.2.1. Increasing Adoption of Software-based Business Processes; Increasing Demand for Reduced Complexities in Software Development and Cost Optimization
- 3.3. Market Restrains
- 3.3.1. Environmental and Safe Use Concerns
- 3.4. Market Trends
- 3.4.1. Retail and E-commerce Industry Expected to Exhibit Significant Growth
- 4. Market Factor Analysis
- 4.1. Porters Five Forces
- 4.2. Supply/Value Chain
- 4.3. PESTEL analysis
- 4.4. Market Entropy
- 4.5. Patent/Trademark Analysis
- 5. Global Continuous Integration Solutions Industry Analysis, Insights and Forecast, 2019-2031
- 5.1. Market Analysis, Insights and Forecast - by Deployment
- 5.1.1. On-premise
- 5.1.2. Cloud
- 5.2. Market Analysis, Insights and Forecast - by End-User Industry
- 5.2.1. IT and Telecom
- 5.2.2. Retail and E-commerce
- 5.2.3. Healthcare and Life Sciences
- 5.3. Market Analysis, Insights and Forecast - by Region
- 5.3.1. North America
- 5.3.2. Europe
- 5.3.3. Asia Pacific
- 5.3.4. Latin America
- 5.3.5. Middle East and Africa
- 5.1. Market Analysis, Insights and Forecast - by Deployment
- 6. North America Continuous Integration Solutions Industry Analysis, Insights and Forecast, 2019-2031
- 6.1. Market Analysis, Insights and Forecast - by Deployment
- 6.1.1. On-premise
- 6.1.2. Cloud
- 6.2. Market Analysis, Insights and Forecast - by End-User Industry
- 6.2.1. IT and Telecom
- 6.2.2. Retail and E-commerce
- 6.2.3. Healthcare and Life Sciences
- 6.1. Market Analysis, Insights and Forecast - by Deployment
- 7. Europe Continuous Integration Solutions Industry Analysis, Insights and Forecast, 2019-2031
- 7.1. Market Analysis, Insights and Forecast - by Deployment
- 7.1.1. On-premise
- 7.1.2. Cloud
- 7.2. Market Analysis, Insights and Forecast - by End-User Industry
- 7.2.1. IT and Telecom
- 7.2.2. Retail and E-commerce
- 7.2.3. Healthcare and Life Sciences
- 7.1. Market Analysis, Insights and Forecast - by Deployment
- 8. Asia Pacific Continuous Integration Solutions Industry Analysis, Insights and Forecast, 2019-2031
- 8.1. Market Analysis, Insights and Forecast - by Deployment
- 8.1.1. On-premise
- 8.1.2. Cloud
- 8.2. Market Analysis, Insights and Forecast - by End-User Industry
- 8.2.1. IT and Telecom
- 8.2.2. Retail and E-commerce
- 8.2.3. Healthcare and Life Sciences
- 8.1. Market Analysis, Insights and Forecast - by Deployment
- 9. Latin America Continuous Integration Solutions Industry Analysis, Insights and Forecast, 2019-2031
- 9.1. Market Analysis, Insights and Forecast - by Deployment
- 9.1.1. On-premise
- 9.1.2. Cloud
- 9.2. Market Analysis, Insights and Forecast - by End-User Industry
- 9.2.1. IT and Telecom
- 9.2.2. Retail and E-commerce
- 9.2.3. Healthcare and Life Sciences
- 9.1. Market Analysis, Insights and Forecast - by Deployment
- 10. Middle East and Africa Continuous Integration Solutions Industry Analysis, Insights and Forecast, 2019-2031
- 10.1. Market Analysis, Insights and Forecast - by Deployment
- 10.1.1. On-premise
- 10.1.2. Cloud
- 10.2. Market Analysis, Insights and Forecast - by End-User Industry
- 10.2.1. IT and Telecom
- 10.2.2. Retail and E-commerce
- 10.2.3. Healthcare and Life Sciences
- 10.1. Market Analysis, Insights and Forecast - by Deployment
- 11. North America Continuous Integration Solutions Industry Analysis, Insights and Forecast, 2019-2031
- 11.1. Market Analysis, Insights and Forecast - By Country/Sub-region
- 11.1.1 United States
- 11.1.2 Canada
- 11.1.3 Mexico
- 12. Europe Continuous Integration Solutions Industry Analysis, Insights and Forecast, 2019-2031
- 12.1. Market Analysis, Insights and Forecast - By Country/Sub-region
- 12.1.1 Germany
- 12.1.2 United Kingdom
- 12.1.3 France
- 12.1.4 Spain
- 12.1.5 Italy
- 12.1.6 Spain
- 12.1.7 Belgium
- 12.1.8 Netherland
- 12.1.9 Nordics
- 12.1.10 Rest of Europe
- 13. Asia Pacific Continuous Integration Solutions Industry Analysis, Insights and Forecast, 2019-2031
- 13.1. Market Analysis, Insights and Forecast - By Country/Sub-region
- 13.1.1 China
- 13.1.2 Japan
- 13.1.3 India
- 13.1.4 South Korea
- 13.1.5 Southeast Asia
- 13.1.6 Australia
- 13.1.7 Indonesia
- 13.1.8 Phillipes
- 13.1.9 Singapore
- 13.1.10 Thailandc
- 13.1.11 Rest of Asia Pacific
- 14. South America Continuous Integration Solutions Industry Analysis, Insights and Forecast, 2019-2031
- 14.1. Market Analysis, Insights and Forecast - By Country/Sub-region
- 14.1.1 Brazil
- 14.1.2 Argentina
- 14.1.3 Peru
- 14.1.4 Chile
- 14.1.5 Colombia
- 14.1.6 Ecuador
- 14.1.7 Venezuela
- 14.1.8 Rest of South America
- 15. North America Continuous Integration Solutions Industry Analysis, Insights and Forecast, 2019-2031
- 15.1. Market Analysis, Insights and Forecast - By Country/Sub-region
- 15.1.1 United States
- 15.1.2 Canada
- 15.1.3 Mexico
- 16. MEA Continuous Integration Solutions Industry Analysis, Insights and Forecast, 2019-2031
- 16.1. Market Analysis, Insights and Forecast - By Country/Sub-region
- 16.1.1 United Arab Emirates
- 16.1.2 Saudi Arabia
- 16.1.3 South Africa
- 16.1.4 Rest of Middle East and Africa
- 17. Competitive Analysis
- 17.1. Global Market Share Analysis 2024
- 17.2. Company Profiles
- 17.2.1 Micro Focus International PLC
- 17.2.1.1. Overview
- 17.2.1.2. Products
- 17.2.1.3. SWOT Analysis
- 17.2.1.4. Recent Developments
- 17.2.1.5. Financials (Based on Availability)
- 17.2.2 JetBrains SRO
- 17.2.2.1. Overview
- 17.2.2.2. Products
- 17.2.2.3. SWOT Analysis
- 17.2.2.4. Recent Developments
- 17.2.2.5. Financials (Based on Availability)
- 17.2.3 Atlassian Corporation PLC
- 17.2.3.1. Overview
- 17.2.3.2. Products
- 17.2.3.3. SWOT Analysis
- 17.2.3.4. Recent Developments
- 17.2.3.5. Financials (Based on Availability)
- 17.2.4 IBM Corporation
- 17.2.4.1. Overview
- 17.2.4.2. Products
- 17.2.4.3. SWOT Analysis
- 17.2.4.4. Recent Developments
- 17.2.4.5. Financials (Based on Availability)
- 17.2.5 Buddy (BDY Sp zoo Sp K)
- 17.2.5.1. Overview
- 17.2.5.2. Products
- 17.2.5.3. SWOT Analysis
- 17.2.5.4. Recent Developments
- 17.2.5.5. Financials (Based on Availability)
- 17.2.6 Circle Internet Services Inc
- 17.2.6.1. Overview
- 17.2.6.2. Products
- 17.2.6.3. SWOT Analysis
- 17.2.6.4. Recent Developments
- 17.2.6.5. Financials (Based on Availability)
- 17.2.7 Thoughtworks Inc
- 17.2.7.1. Overview
- 17.2.7.2. Products
- 17.2.7.3. SWOT Analysis
- 17.2.7.4. Recent Developments
- 17.2.7.5. Financials (Based on Availability)
- 17.2.8 Microsoft Corporation
- 17.2.8.1. Overview
- 17.2.8.2. Products
- 17.2.8.3. SWOT Analysis
- 17.2.8.4. Recent Developments
- 17.2.8.5. Financials (Based on Availability)
- 17.2.9 Amazon Web Services Inc
- 17.2.9.1. Overview
- 17.2.9.2. Products
- 17.2.9.3. SWOT Analysis
- 17.2.9.4. Recent Developments
- 17.2.9.5. Financials (Based on Availability)
- 17.2.10 Travis CI GmbH
- 17.2.10.1. Overview
- 17.2.10.2. Products
- 17.2.10.3. SWOT Analysis
- 17.2.10.4. Recent Developments
- 17.2.10.5. Financials (Based on Availability)
- 17.2.11 GitLab Inc
- 17.2.11.1. Overview
- 17.2.11.2. Products
- 17.2.11.3. SWOT Analysis
- 17.2.11.4. Recent Developments
- 17.2.11.5. Financials (Based on Availability)
- 17.2.12 CodeShip Inc
- 17.2.12.1. Overview
- 17.2.12.2. Products
- 17.2.12.3. SWOT Analysis
- 17.2.12.4. Recent Developments
- 17.2.12.5. Financials (Based on Availability)
- 17.2.1 Micro Focus International PLC
List of Figures
- Figure 1: Global Continuous Integration Solutions Industry Revenue Breakdown (Million, %) by Region 2024 & 2032
- Figure 2: Global Continuous Integration Solutions Industry Volume Breakdown (K Unit, %) by Region 2024 & 2032
- Figure 3: North America Continuous Integration Solutions Industry Revenue (Million), by Country 2024 & 2032
- Figure 4: North America Continuous Integration Solutions Industry Volume (K Unit), by Country 2024 & 2032
- Figure 5: North America Continuous Integration Solutions Industry Revenue Share (%), by Country 2024 & 2032
- Figure 6: North America Continuous Integration Solutions Industry Volume Share (%), by Country 2024 & 2032
- Figure 7: Europe Continuous Integration Solutions Industry Revenue (Million), by Country 2024 & 2032
- Figure 8: Europe Continuous Integration Solutions Industry Volume (K Unit), by Country 2024 & 2032
- Figure 9: Europe Continuous Integration Solutions Industry Revenue Share (%), by Country 2024 & 2032
- Figure 10: Europe Continuous Integration Solutions Industry Volume Share (%), by Country 2024 & 2032
- Figure 11: Asia Pacific Continuous Integration Solutions Industry Revenue (Million), by Country 2024 & 2032
- Figure 12: Asia Pacific Continuous Integration Solutions Industry Volume (K Unit), by Country 2024 & 2032
- Figure 13: Asia Pacific Continuous Integration Solutions Industry Revenue Share (%), by Country 2024 & 2032
- Figure 14: Asia Pacific Continuous Integration Solutions Industry Volume Share (%), by Country 2024 & 2032
- Figure 15: South America Continuous Integration Solutions Industry Revenue (Million), by Country 2024 & 2032
- Figure 16: South America Continuous Integration Solutions Industry Volume (K Unit), by Country 2024 & 2032
- Figure 17: South America Continuous Integration Solutions Industry Revenue Share (%), by Country 2024 & 2032
- Figure 18: South America Continuous Integration Solutions Industry Volume Share (%), by Country 2024 & 2032
- Figure 19: North America Continuous Integration Solutions Industry Revenue (Million), by Country 2024 & 2032
- Figure 20: North America Continuous Integration Solutions Industry Volume (K Unit), by Country 2024 & 2032
- Figure 21: North America Continuous Integration Solutions Industry Revenue Share (%), by Country 2024 & 2032
- Figure 22: North America Continuous Integration Solutions Industry Volume Share (%), by Country 2024 & 2032
- Figure 23: MEA Continuous Integration Solutions Industry Revenue (Million), by Country 2024 & 2032
- Figure 24: MEA Continuous Integration Solutions Industry Volume (K Unit), by Country 2024 & 2032
- Figure 25: MEA Continuous Integration Solutions Industry Revenue Share (%), by Country 2024 & 2032
- Figure 26: MEA Continuous Integration Solutions Industry Volume Share (%), by Country 2024 & 2032
- Figure 27: North America Continuous Integration Solutions Industry Revenue (Million), by Deployment 2024 & 2032
- Figure 28: North America Continuous Integration Solutions Industry Volume (K Unit), by Deployment 2024 & 2032
- Figure 29: North America Continuous Integration Solutions Industry Revenue Share (%), by Deployment 2024 & 2032
- Figure 30: North America Continuous Integration Solutions Industry Volume Share (%), by Deployment 2024 & 2032
- Figure 31: North America Continuous Integration Solutions Industry Revenue (Million), by End-User Industry 2024 & 2032
- Figure 32: North America Continuous Integration Solutions Industry Volume (K Unit), by End-User Industry 2024 & 2032
- Figure 33: North America Continuous Integration Solutions Industry Revenue Share (%), by End-User Industry 2024 & 2032
- Figure 34: North America Continuous Integration Solutions Industry Volume Share (%), by End-User Industry 2024 & 2032
- Figure 35: North America Continuous Integration Solutions Industry Revenue (Million), by Country 2024 & 2032
- Figure 36: North America Continuous Integration Solutions Industry Volume (K Unit), by Country 2024 & 2032
- Figure 37: North America Continuous Integration Solutions Industry Revenue Share (%), by Country 2024 & 2032
- Figure 38: North America Continuous Integration Solutions Industry Volume Share (%), by Country 2024 & 2032
- Figure 39: Europe Continuous Integration Solutions Industry Revenue (Million), by Deployment 2024 & 2032
- Figure 40: Europe Continuous Integration Solutions Industry Volume (K Unit), by Deployment 2024 & 2032
- Figure 41: Europe Continuous Integration Solutions Industry Revenue Share (%), by Deployment 2024 & 2032
- Figure 42: Europe Continuous Integration Solutions Industry Volume Share (%), by Deployment 2024 & 2032
- Figure 43: Europe Continuous Integration Solutions Industry Revenue (Million), by End-User Industry 2024 & 2032
- Figure 44: Europe Continuous Integration Solutions Industry Volume (K Unit), by End-User Industry 2024 & 2032
- Figure 45: Europe Continuous Integration Solutions Industry Revenue Share (%), by End-User Industry 2024 & 2032
- Figure 46: Europe Continuous Integration Solutions Industry Volume Share (%), by End-User Industry 2024 & 2032
- Figure 47: Europe Continuous Integration Solutions Industry Revenue (Million), by Country 2024 & 2032
- Figure 48: Europe Continuous Integration Solutions Industry Volume (K Unit), by Country 2024 & 2032
- Figure 49: Europe Continuous Integration Solutions Industry Revenue Share (%), by Country 2024 & 2032
- Figure 50: Europe Continuous Integration Solutions Industry Volume Share (%), by Country 2024 & 2032
- Figure 51: Asia Pacific Continuous Integration Solutions Industry Revenue (Million), by Deployment 2024 & 2032
- Figure 52: Asia Pacific Continuous Integration Solutions Industry Volume (K Unit), by Deployment 2024 & 2032
- Figure 53: Asia Pacific Continuous Integration Solutions Industry Revenue Share (%), by Deployment 2024 & 2032
- Figure 54: Asia Pacific Continuous Integration Solutions Industry Volume Share (%), by Deployment 2024 & 2032
- Figure 55: Asia Pacific Continuous Integration Solutions Industry Revenue (Million), by End-User Industry 2024 & 2032
- Figure 56: Asia Pacific Continuous Integration Solutions Industry Volume (K Unit), by End-User Industry 2024 & 2032
- Figure 57: Asia Pacific Continuous Integration Solutions Industry Revenue Share (%), by End-User Industry 2024 & 2032
- Figure 58: Asia Pacific Continuous Integration Solutions Industry Volume Share (%), by End-User Industry 2024 & 2032
- Figure 59: Asia Pacific Continuous Integration Solutions Industry Revenue (Million), by Country 2024 & 2032
- Figure 60: Asia Pacific Continuous Integration Solutions Industry Volume (K Unit), by Country 2024 & 2032
- Figure 61: Asia Pacific Continuous Integration Solutions Industry Revenue Share (%), by Country 2024 & 2032
- Figure 62: Asia Pacific Continuous Integration Solutions Industry Volume Share (%), by Country 2024 & 2032
- Figure 63: Latin America Continuous Integration Solutions Industry Revenue (Million), by Deployment 2024 & 2032
- Figure 64: Latin America Continuous Integration Solutions Industry Volume (K Unit), by Deployment 2024 & 2032
- Figure 65: Latin America Continuous Integration Solutions Industry Revenue Share (%), by Deployment 2024 & 2032
- Figure 66: Latin America Continuous Integration Solutions Industry Volume Share (%), by Deployment 2024 & 2032
- Figure 67: Latin America Continuous Integration Solutions Industry Revenue (Million), by End-User Industry 2024 & 2032
- Figure 68: Latin America Continuous Integration Solutions Industry Volume (K Unit), by End-User Industry 2024 & 2032
- Figure 69: Latin America Continuous Integration Solutions Industry Revenue Share (%), by End-User Industry 2024 & 2032
- Figure 70: Latin America Continuous Integration Solutions Industry Volume Share (%), by End-User Industry 2024 & 2032
- Figure 71: Latin America Continuous Integration Solutions Industry Revenue (Million), by Country 2024 & 2032
- Figure 72: Latin America Continuous Integration Solutions Industry Volume (K Unit), by Country 2024 & 2032
- Figure 73: Latin America Continuous Integration Solutions Industry Revenue Share (%), by Country 2024 & 2032
- Figure 74: Latin America Continuous Integration Solutions Industry Volume Share (%), by Country 2024 & 2032
- Figure 75: Middle East and Africa Continuous Integration Solutions Industry Revenue (Million), by Deployment 2024 & 2032
- Figure 76: Middle East and Africa Continuous Integration Solutions Industry Volume (K Unit), by Deployment 2024 & 2032
- Figure 77: Middle East and Africa Continuous Integration Solutions Industry Revenue Share (%), by Deployment 2024 & 2032
- Figure 78: Middle East and Africa Continuous Integration Solutions Industry Volume Share (%), by Deployment 2024 & 2032
- Figure 79: Middle East and Africa Continuous Integration Solutions Industry Revenue (Million), by End-User Industry 2024 & 2032
- Figure 80: Middle East and Africa Continuous Integration Solutions Industry Volume (K Unit), by End-User Industry 2024 & 2032
- Figure 81: Middle East and Africa Continuous Integration Solutions Industry Revenue Share (%), by End-User Industry 2024 & 2032
- Figure 82: Middle East and Africa Continuous Integration Solutions Industry Volume Share (%), by End-User Industry 2024 & 2032
- Figure 83: Middle East and Africa Continuous Integration Solutions Industry Revenue (Million), by Country 2024 & 2032
- Figure 84: Middle East and Africa Continuous Integration Solutions Industry Volume (K Unit), by Country 2024 & 2032
- Figure 85: Middle East and Africa Continuous Integration Solutions Industry Revenue Share (%), by Country 2024 & 2032
- Figure 86: Middle East and Africa Continuous Integration Solutions Industry Volume Share (%), by Country 2024 & 2032
List of Tables
- Table 1: Global Continuous Integration Solutions Industry Revenue Million Forecast, by Region 2019 & 2032
- Table 2: Global Continuous Integration Solutions Industry Volume K Unit Forecast, by Region 2019 & 2032
- Table 3: Global Continuous Integration Solutions Industry Revenue Million Forecast, by Deployment 2019 & 2032
- Table 4: Global Continuous Integration Solutions Industry Volume K Unit Forecast, by Deployment 2019 & 2032
- Table 5: Global Continuous Integration Solutions Industry Revenue Million Forecast, by End-User Industry 2019 & 2032
- Table 6: Global Continuous Integration Solutions Industry Volume K Unit Forecast, by End-User Industry 2019 & 2032
- Table 7: Global Continuous Integration Solutions Industry Revenue Million Forecast, by Region 2019 & 2032
- Table 8: Global Continuous Integration Solutions Industry Volume K Unit Forecast, by Region 2019 & 2032
- Table 9: Global Continuous Integration Solutions Industry Revenue Million Forecast, by Country 2019 & 2032
- Table 10: Global Continuous Integration Solutions Industry Volume K Unit Forecast, by Country 2019 & 2032
- Table 11: United States Continuous Integration Solutions Industry Revenue (Million) Forecast, by Application 2019 & 2032
- Table 12: United States Continuous Integration Solutions Industry Volume (K Unit) Forecast, by Application 2019 & 2032
- Table 13: Canada Continuous Integration Solutions Industry Revenue (Million) Forecast, by Application 2019 & 2032
- Table 14: Canada Continuous Integration Solutions Industry Volume (K Unit) Forecast, by Application 2019 & 2032
- Table 15: Mexico Continuous Integration Solutions Industry Revenue (Million) Forecast, by Application 2019 & 2032
- Table 16: Mexico Continuous Integration Solutions Industry Volume (K Unit) Forecast, by Application 2019 & 2032
- Table 17: Global Continuous Integration Solutions Industry Revenue Million Forecast, by Country 2019 & 2032
- Table 18: Global Continuous Integration Solutions Industry Volume K Unit Forecast, by Country 2019 & 2032
- Table 19: Germany Continuous Integration Solutions Industry Revenue (Million) Forecast, by Application 2019 & 2032
- Table 20: Germany Continuous Integration Solutions Industry Volume (K Unit) Forecast, by Application 2019 & 2032
- Table 21: United Kingdom Continuous Integration Solutions Industry Revenue (Million) Forecast, by Application 2019 & 2032
- Table 22: United Kingdom Continuous Integration Solutions Industry Volume (K Unit) Forecast, by Application 2019 & 2032
- Table 23: France Continuous Integration Solutions Industry Revenue (Million) Forecast, by Application 2019 & 2032
- Table 24: France Continuous Integration Solutions Industry Volume (K Unit) Forecast, by Application 2019 & 2032
- Table 25: Spain Continuous Integration Solutions Industry Revenue (Million) Forecast, by Application 2019 & 2032
- Table 26: Spain Continuous Integration Solutions Industry Volume (K Unit) Forecast, by Application 2019 & 2032
- Table 27: Italy Continuous Integration Solutions Industry Revenue (Million) Forecast, by Application 2019 & 2032
- Table 28: Italy Continuous Integration Solutions Industry Volume (K Unit) Forecast, by Application 2019 & 2032
- Table 29: Spain Continuous Integration Solutions Industry Revenue (Million) Forecast, by Application 2019 & 2032
- Table 30: Spain Continuous Integration Solutions Industry Volume (K Unit) Forecast, by Application 2019 & 2032
- Table 31: Belgium Continuous Integration Solutions Industry Revenue (Million) Forecast, by Application 2019 & 2032
- Table 32: Belgium Continuous Integration Solutions Industry Volume (K Unit) Forecast, by Application 2019 & 2032
- Table 33: Netherland Continuous Integration Solutions Industry Revenue (Million) Forecast, by Application 2019 & 2032
- Table 34: Netherland Continuous Integration Solutions Industry Volume (K Unit) Forecast, by Application 2019 & 2032
- Table 35: Nordics Continuous Integration Solutions Industry Revenue (Million) Forecast, by Application 2019 & 2032
- Table 36: Nordics Continuous Integration Solutions Industry Volume (K Unit) Forecast, by Application 2019 & 2032
- Table 37: Rest of Europe Continuous Integration Solutions Industry Revenue (Million) Forecast, by Application 2019 & 2032
- Table 38: Rest of Europe Continuous Integration Solutions Industry Volume (K Unit) Forecast, by Application 2019 & 2032
- Table 39: Global Continuous Integration Solutions Industry Revenue Million Forecast, by Country 2019 & 2032
- Table 40: Global Continuous Integration Solutions Industry Volume K Unit Forecast, by Country 2019 & 2032
- Table 41: China Continuous Integration Solutions Industry Revenue (Million) Forecast, by Application 2019 & 2032
- Table 42: China Continuous Integration Solutions Industry Volume (K Unit) Forecast, by Application 2019 & 2032
- Table 43: Japan Continuous Integration Solutions Industry Revenue (Million) Forecast, by Application 2019 & 2032
- Table 44: Japan Continuous Integration Solutions Industry Volume (K Unit) Forecast, by Application 2019 & 2032
- Table 45: India Continuous Integration Solutions Industry Revenue (Million) Forecast, by Application 2019 & 2032
- Table 46: India Continuous Integration Solutions Industry Volume (K Unit) Forecast, by Application 2019 & 2032
- Table 47: South Korea Continuous Integration Solutions Industry Revenue (Million) Forecast, by Application 2019 & 2032
- Table 48: South Korea Continuous Integration Solutions Industry Volume (K Unit) Forecast, by Application 2019 & 2032
- Table 49: Southeast Asia Continuous Integration Solutions Industry Revenue (Million) Forecast, by Application 2019 & 2032
- Table 50: Southeast Asia Continuous Integration Solutions Industry Volume (K Unit) Forecast, by Application 2019 & 2032
- Table 51: Australia Continuous Integration Solutions Industry Revenue (Million) Forecast, by Application 2019 & 2032
- Table 52: Australia Continuous Integration Solutions Industry Volume (K Unit) Forecast, by Application 2019 & 2032
- Table 53: Indonesia Continuous Integration Solutions Industry Revenue (Million) Forecast, by Application 2019 & 2032
- Table 54: Indonesia Continuous Integration Solutions Industry Volume (K Unit) Forecast, by Application 2019 & 2032
- Table 55: Phillipes Continuous Integration Solutions Industry Revenue (Million) Forecast, by Application 2019 & 2032
- Table 56: Phillipes Continuous Integration Solutions Industry Volume (K Unit) Forecast, by Application 2019 & 2032
- Table 57: Singapore Continuous Integration Solutions Industry Revenue (Million) Forecast, by Application 2019 & 2032
- Table 58: Singapore Continuous Integration Solutions Industry Volume (K Unit) Forecast, by Application 2019 & 2032
- Table 59: Thailandc Continuous Integration Solutions Industry Revenue (Million) Forecast, by Application 2019 & 2032
- Table 60: Thailandc Continuous Integration Solutions Industry Volume (K Unit) Forecast, by Application 2019 & 2032
- Table 61: Rest of Asia Pacific Continuous Integration Solutions Industry Revenue (Million) Forecast, by Application 2019 & 2032
- Table 62: Rest of Asia Pacific Continuous Integration Solutions Industry Volume (K Unit) Forecast, by Application 2019 & 2032
- Table 63: Global Continuous Integration Solutions Industry Revenue Million Forecast, by Country 2019 & 2032
- Table 64: Global Continuous Integration Solutions Industry Volume K Unit Forecast, by Country 2019 & 2032
- Table 65: Brazil Continuous Integration Solutions Industry Revenue (Million) Forecast, by Application 2019 & 2032
- Table 66: Brazil Continuous Integration Solutions Industry Volume (K Unit) Forecast, by Application 2019 & 2032
- Table 67: Argentina Continuous Integration Solutions Industry Revenue (Million) Forecast, by Application 2019 & 2032
- Table 68: Argentina Continuous Integration Solutions Industry Volume (K Unit) Forecast, by Application 2019 & 2032
- Table 69: Peru Continuous Integration Solutions Industry Revenue (Million) Forecast, by Application 2019 & 2032
- Table 70: Peru Continuous Integration Solutions Industry Volume (K Unit) Forecast, by Application 2019 & 2032
- Table 71: Chile Continuous Integration Solutions Industry Revenue (Million) Forecast, by Application 2019 & 2032
- Table 72: Chile Continuous Integration Solutions Industry Volume (K Unit) Forecast, by Application 2019 & 2032
- Table 73: Colombia Continuous Integration Solutions Industry Revenue (Million) Forecast, by Application 2019 & 2032
- Table 74: Colombia Continuous Integration Solutions Industry Volume (K Unit) Forecast, by Application 2019 & 2032
- Table 75: Ecuador Continuous Integration Solutions Industry Revenue (Million) Forecast, by Application 2019 & 2032
- Table 76: Ecuador Continuous Integration Solutions Industry Volume (K Unit) Forecast, by Application 2019 & 2032
- Table 77: Venezuela Continuous Integration Solutions Industry Revenue (Million) Forecast, by Application 2019 & 2032
- Table 78: Venezuela Continuous Integration Solutions Industry Volume (K Unit) Forecast, by Application 2019 & 2032
- Table 79: Rest of South America Continuous Integration Solutions Industry Revenue (Million) Forecast, by Application 2019 & 2032
- Table 80: Rest of South America Continuous Integration Solutions Industry Volume (K Unit) Forecast, by Application 2019 & 2032
- Table 81: Global Continuous Integration Solutions Industry Revenue Million Forecast, by Country 2019 & 2032
- Table 82: Global Continuous Integration Solutions Industry Volume K Unit Forecast, by Country 2019 & 2032
- Table 83: United States Continuous Integration Solutions Industry Revenue (Million) Forecast, by Application 2019 & 2032
- Table 84: United States Continuous Integration Solutions Industry Volume (K Unit) Forecast, by Application 2019 & 2032
- Table 85: Canada Continuous Integration Solutions Industry Revenue (Million) Forecast, by Application 2019 & 2032
- Table 86: Canada Continuous Integration Solutions Industry Volume (K Unit) Forecast, by Application 2019 & 2032
- Table 87: Mexico Continuous Integration Solutions Industry Revenue (Million) Forecast, by Application 2019 & 2032
- Table 88: Mexico Continuous Integration Solutions Industry Volume (K Unit) Forecast, by Application 2019 & 2032
- Table 89: Global Continuous Integration Solutions Industry Revenue Million Forecast, by Country 2019 & 2032
- Table 90: Global Continuous Integration Solutions Industry Volume K Unit Forecast, by Country 2019 & 2032
- Table 91: United Arab Emirates Continuous Integration Solutions Industry Revenue (Million) Forecast, by Application 2019 & 2032
- Table 92: United Arab Emirates Continuous Integration Solutions Industry Volume (K Unit) Forecast, by Application 2019 & 2032
- Table 93: Saudi Arabia Continuous Integration Solutions Industry Revenue (Million) Forecast, by Application 2019 & 2032
- Table 94: Saudi Arabia Continuous Integration Solutions Industry Volume (K Unit) Forecast, by Application 2019 & 2032
- Table 95: South Africa Continuous Integration Solutions Industry Revenue (Million) Forecast, by Application 2019 & 2032
- Table 96: South Africa Continuous Integration Solutions Industry Volume (K Unit) Forecast, by Application 2019 & 2032
- Table 97: Rest of Middle East and Africa Continuous Integration Solutions Industry Revenue (Million) Forecast, by Application 2019 & 2032
- Table 98: Rest of Middle East and Africa Continuous Integration Solutions Industry Volume (K Unit) Forecast, by Application 2019 & 2032
- Table 99: Global Continuous Integration Solutions Industry Revenue Million Forecast, by Deployment 2019 & 2032
- Table 100: Global Continuous Integration Solutions Industry Volume K Unit Forecast, by Deployment 2019 & 2032
- Table 101: Global Continuous Integration Solutions Industry Revenue Million Forecast, by End-User Industry 2019 & 2032
- Table 102: Global Continuous Integration Solutions Industry Volume K Unit Forecast, by End-User Industry 2019 & 2032
- Table 103: Global Continuous Integration Solutions Industry Revenue Million Forecast, by Country 2019 & 2032
- Table 104: Global Continuous Integration Solutions Industry Volume K Unit Forecast, by Country 2019 & 2032
- Table 105: Global Continuous Integration Solutions Industry Revenue Million Forecast, by Deployment 2019 & 2032
- Table 106: Global Continuous Integration Solutions Industry Volume K Unit Forecast, by Deployment 2019 & 2032
- Table 107: Global Continuous Integration Solutions Industry Revenue Million Forecast, by End-User Industry 2019 & 2032
- Table 108: Global Continuous Integration Solutions Industry Volume K Unit Forecast, by End-User Industry 2019 & 2032
- Table 109: Global Continuous Integration Solutions Industry Revenue Million Forecast, by Country 2019 & 2032
- Table 110: Global Continuous Integration Solutions Industry Volume K Unit Forecast, by Country 2019 & 2032
- Table 111: Global Continuous Integration Solutions Industry Revenue Million Forecast, by Deployment 2019 & 2032
- Table 112: Global Continuous Integration Solutions Industry Volume K Unit Forecast, by Deployment 2019 & 2032
- Table 113: Global Continuous Integration Solutions Industry Revenue Million Forecast, by End-User Industry 2019 & 2032
- Table 114: Global Continuous Integration Solutions Industry Volume K Unit Forecast, by End-User Industry 2019 & 2032
- Table 115: Global Continuous Integration Solutions Industry Revenue Million Forecast, by Country 2019 & 2032
- Table 116: Global Continuous Integration Solutions Industry Volume K Unit Forecast, by Country 2019 & 2032
- Table 117: Global Continuous Integration Solutions Industry Revenue Million Forecast, by Deployment 2019 & 2032
- Table 118: Global Continuous Integration Solutions Industry Volume K Unit Forecast, by Deployment 2019 & 2032
- Table 119: Global Continuous Integration Solutions Industry Revenue Million Forecast, by End-User Industry 2019 & 2032
- Table 120: Global Continuous Integration Solutions Industry Volume K Unit Forecast, by End-User Industry 2019 & 2032
- Table 121: Global Continuous Integration Solutions Industry Revenue Million Forecast, by Country 2019 & 2032
- Table 122: Global Continuous Integration Solutions Industry Volume K Unit Forecast, by Country 2019 & 2032
- Table 123: Global Continuous Integration Solutions Industry Revenue Million Forecast, by Deployment 2019 & 2032
- Table 124: Global Continuous Integration Solutions Industry Volume K Unit Forecast, by Deployment 2019 & 2032
- Table 125: Global Continuous Integration Solutions Industry Revenue Million Forecast, by End-User Industry 2019 & 2032
- Table 126: Global Continuous Integration Solutions Industry Volume K Unit Forecast, by End-User Industry 2019 & 2032
- Table 127: Global Continuous Integration Solutions Industry Revenue Million Forecast, by Country 2019 & 2032
- Table 128: Global Continuous Integration Solutions Industry Volume K Unit Forecast, by Country 2019 & 2032
Frequently Asked Questions
1. What is the projected Compound Annual Growth Rate (CAGR) of the Continuous Integration Solutions Industry?
The projected CAGR is approximately 21.18%.
2. Which companies are prominent players in the Continuous Integration Solutions Industry?
Key companies in the market include Micro Focus International PLC, JetBrains SRO, Atlassian Corporation PLC, IBM Corporation, Buddy (BDY Sp zoo Sp K), Circle Internet Services Inc, Thoughtworks Inc, Microsoft Corporation, Amazon Web Services Inc, Travis CI GmbH, GitLab Inc, CodeShip Inc.
3. What are the main segments of the Continuous Integration Solutions Industry?
The market segments include Deployment, End-User Industry.
4. Can you provide details about the market size?
The market size is estimated to be USD 1.43 Million as of 2022.
5. What are some drivers contributing to market growth?
Increasing Adoption of Software-based Business Processes; Increasing Demand for Reduced Complexities in Software Development and Cost Optimization.
6. What are the notable trends driving market growth?
Retail and E-commerce Industry Expected to Exhibit Significant Growth.
7. Are there any restraints impacting market growth?
Environmental and Safe Use Concerns.
8. Can you provide examples of recent developments in the market?
July 2022: The top continuous integration and continuous delivery (CI/CD) platform, CircleCI, declared support for GitLab SaaS users to be generally available. Joint customers can now utilize the interoperability between CircleCI, The One DevOps Platform for Software Innovation, and GitLab Inc. technologies. GitLab-based software development teams now have access to CircleCI's industry-leading speed, intelligent test splitting, and the broadest selection of resource classes and compute options.
9. What pricing options are available for accessing the report?
Pricing options include single-user, multi-user, and enterprise licenses priced at USD 4750, USD 5250, and USD 8750 respectively.
10. Is the market size provided in terms of value or volume?
The market size is provided in terms of value, measured in Million and volume, measured in K Unit.
11. Are there any specific market keywords associated with the report?
Yes, the market keyword associated with the report is "Continuous Integration Solutions Industry," which aids in identifying and referencing the specific market segment covered.
12. How do I determine which pricing option suits my needs best?
The pricing options vary based on user requirements and access needs. Individual users may opt for single-user licenses, while businesses requiring broader access may choose multi-user or enterprise licenses for cost-effective access to the report.
13. Are there any additional resources or data provided in the Continuous Integration Solutions Industry report?
While the report offers comprehensive insights, it's advisable to review the specific contents or supplementary materials provided to ascertain if additional resources or data are available.
14. How can I stay updated on further developments or reports in the Continuous Integration Solutions Industry?
To stay informed about further developments, trends, and reports in the Continuous Integration Solutions Industry, consider subscribing to industry newsletters, following relevant companies and organizations, or regularly checking reputable industry news sources and publications.
Methodology
Step 1 - Identification of Relevant Samples Size from Population Database


Step 2 - Approaches for Defining Global Market Size (Value, Volume* & Price*)

Note*: In applicable scenarios
Step 3 - Data Sources
Primary Research
- Web Analytics
- Survey Reports
- Research Institute
- Latest Research Reports
- Opinion Leaders
Secondary Research
- Annual Reports
- White Paper
- Latest Press Release
- Industry Association
- Paid Database
- Investor Presentations

Step 4 - Data Triangulation
Involves using different sources of information in order to increase the validity of a study
These sources are likely to be stakeholders in a program - participants, other researchers, program staff, other community members, and so on.
Then we put all data in single framework & apply various statistical tools to find out the dynamic on the market.
During the analysis stage, feedback from the stakeholder groups would be compared to determine areas of agreement as well as areas of divergence


