
Key Insights
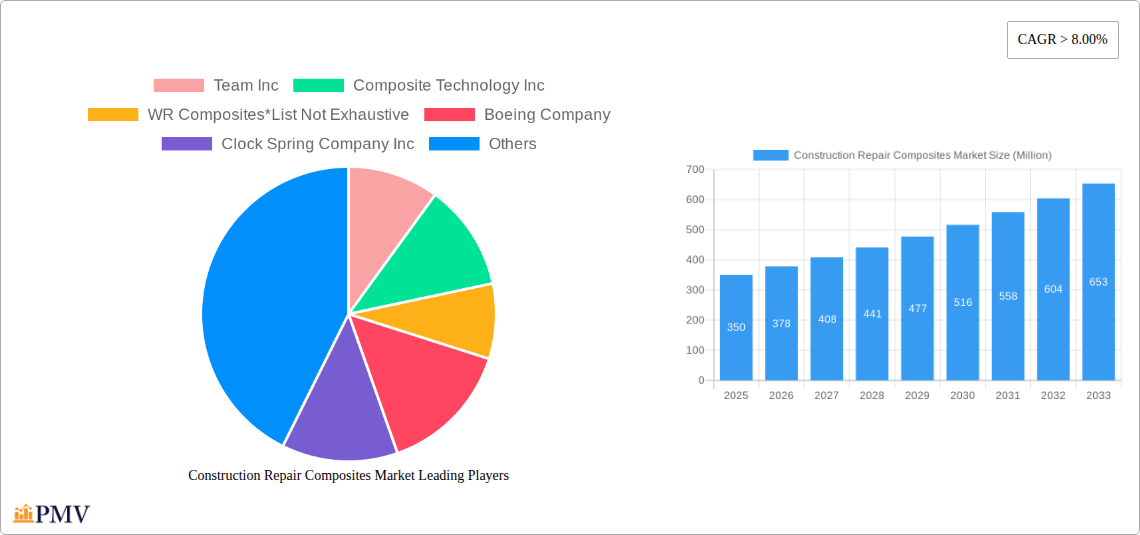
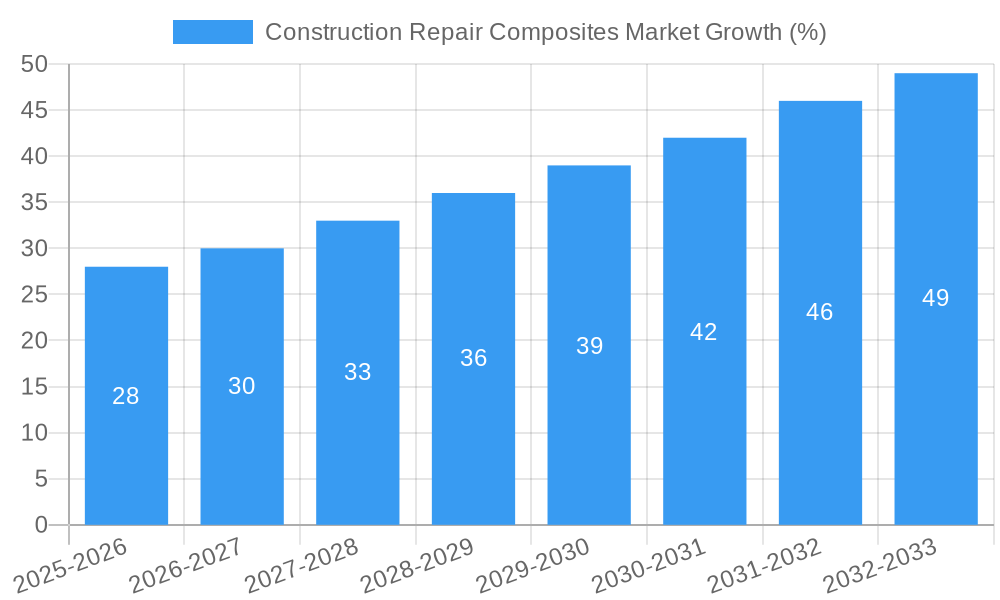
The Construction Repair Composites market, valued at $350 million in 2025, is experiencing robust growth, projected to expand at a CAGR exceeding 8% from 2025 to 2033. This growth is driven by several factors. Increasing infrastructure development globally necessitates frequent repairs and maintenance, creating a significant demand for durable and efficient composite repair solutions. The inherent lightweight yet high-strength properties of composites offer significant advantages over traditional repair materials, leading to faster repair times, reduced labor costs, and improved structural integrity. Furthermore, advancements in composite materials and manufacturing techniques, such as improved resin systems and automated processes like vacuum infusion, are enhancing the performance and affordability of composite repairs. The rising adoption of sustainable construction practices further fuels market growth, as composite repairs often involve less material waste and energy consumption compared to traditional methods. Key segments within the market include structural, semi-structural, and cosmetic repairs, utilizing various processes like hand lay-up, vacuum infusion, and autoclave techniques. The aerospace and defense, wind energy, and automotive industries are significant end-users, but the construction sector itself represents a rapidly growing market segment driving demand for durable and long-lasting repair solutions.
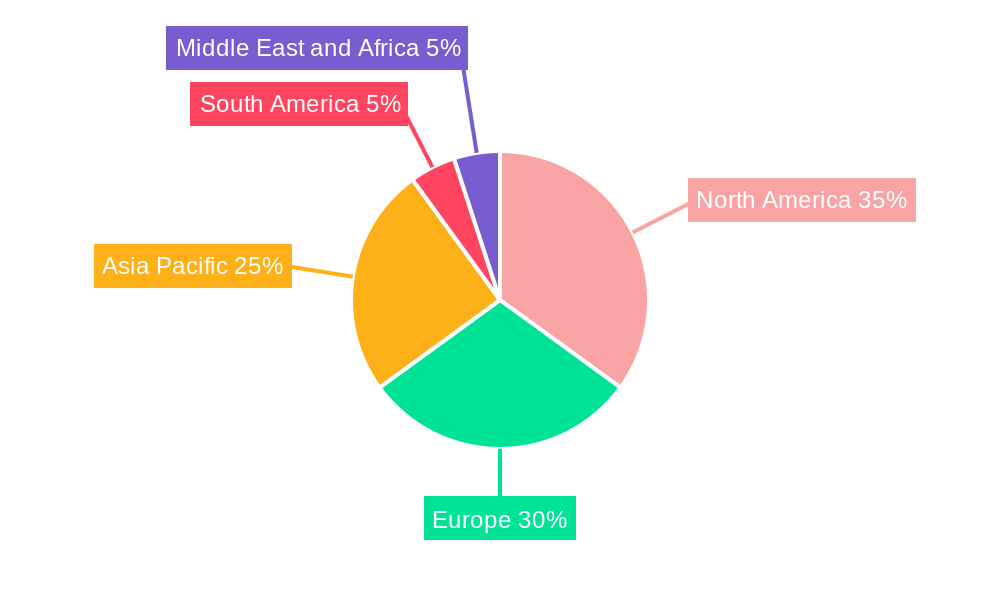
The geographic distribution of the market reflects global infrastructure investment patterns. North America and Europe currently hold significant market share, driven by established construction industries and stringent regulations. However, the Asia-Pacific region is expected to witness the fastest growth due to rapid urbanization and substantial infrastructure development projects in countries like China and India. The market faces some restraints, including the relatively high initial cost of composite materials compared to traditional options and the specialized skills required for proper installation. However, these challenges are being mitigated by technological advancements, increasing awareness of the long-term cost-effectiveness of composite repairs, and the growth of specialized training programs. Companies like Team Inc, Composite Technology Inc, and Boeing are key players, contributing to innovation and market expansion through the development of advanced materials and efficient repair solutions. The continued growth of the construction industry and the increasing adoption of sustainable building practices will further propel the Construction Repair Composites market in the coming years.
Construction Repair Composites Market: A Comprehensive Report (2019-2033)
This in-depth report provides a comprehensive analysis of the Construction Repair Composites Market, offering valuable insights into market dynamics, competitive landscape, and future growth opportunities. Covering the period from 2019 to 2033, with a focus on 2025, this report is an essential resource for industry stakeholders, investors, and strategic decision-makers seeking to navigate this evolving market. The study period covers the historical period (2019-2024), the base year (2025), and the forecast period (2025-2033). The total market size in 2025 is estimated at xx Million.
Construction Repair Composites Market Market Structure & Competitive Dynamics
The Construction Repair Composites market exhibits a moderately concentrated structure, with key players such as Team Inc, Composite Technology Inc, WR Composites, Boeing Company, Clock Spring Company Inc, The IKM Group, TD Williamson Inc, Air France KLM Group, Milliken Infrastructure Solutions LLC, Lufthansa Technik AG, Hong Kong Aircraft Engineering Company Limited (HAECO), and Crawford Composites LLC holding significant market share. However, the market also features several smaller players, contributing to a dynamic competitive landscape. Innovation is crucial, with companies investing in research and development to improve material properties, processing techniques, and application methods. Regulatory frameworks concerning material safety and environmental impact are significant factors shaping market dynamics. Product substitutes, such as traditional repair methods, present ongoing competitive pressure, while end-user trends toward lightweighting and durability drive demand for advanced composites. M&A activity has been moderate, with deal values fluctuating based on market conditions; a notable example was the xx Million acquisition of X Company by Y Company in 2023 (xx is the predicted value).
- Market Concentration: Moderately concentrated.
- Innovation: High, driven by advancements in material science and manufacturing processes.
- Regulatory Landscape: Stringent safety and environmental standards influence market growth.
- M&A Activity: Moderate, with deal values ranging from xx Million to xx Million in recent years.
- Market Share: Top players hold approximately xx% of the market share collectively.
Construction Repair Composites Market Industry Trends & Insights
The Construction Repair Composites market is projected to experience significant growth during the forecast period (2025-2033), driven by several key factors. The increasing demand for durable and lightweight structures in various end-user industries, such as aerospace and construction, fuels market expansion. Technological advancements in composite materials, processing techniques (like Vacuum Infusion and Autoclave), and repair methodologies are further contributing to growth. A notable trend is the increasing adoption of sustainable and recyclable composite materials, reflecting growing environmental concerns. However, high initial investment costs and the need for specialized skills to handle composite materials can hinder market penetration in certain segments. The Compound Annual Growth Rate (CAGR) is projected to be xx% during the forecast period. Market penetration is highest in the aerospace and defense sectors, with steady growth anticipated in the construction and wind energy sectors.
Dominant Markets & Segments in Construction Repair Composites Market
Dominant Region: North America currently holds the largest market share, driven by robust infrastructure spending and a strong aerospace & defense sector. Europe and Asia Pacific follow closely, showing significant growth potential.
Dominant Product Type: Structural composites hold the largest market share due to their high strength-to-weight ratio. The demand for semi-structural composites is also increasing steadily.
Dominant Process: Vacuum Infusion is gaining popularity due to its cost-effectiveness and ability to produce high-quality parts. Autoclave processes remain dominant in high-performance applications.
- Key Drivers for North America: Strong aerospace and defense industry, high infrastructure investment, and favorable government policies.
- Key Drivers for Europe: Growing renewable energy sector (wind energy), investment in infrastructure modernization, and stringent environmental regulations.
- Key Drivers for Asia Pacific: Rapid industrialization, rising disposable income, and increasing construction activities.
Dominant End-User Industry: The aerospace and defense sector currently dominates, followed by the wind energy sector due to the extensive use of composites in wind turbine blades. Construction is emerging as a key growth area due to its increasing demand for durable and lightweight materials.
Construction Repair Composites Market Product Innovations
Recent product innovations focus on developing high-performance, lightweight composites with enhanced durability and repairability. The incorporation of nanomaterials and advanced fiber architectures is improving mechanical properties and reducing weight. New processing techniques enable the production of complex shapes and intricate designs, thus widening the applications of repair composites. This is improving market fit across various end-user sectors, particularly in aerospace, automotive, and infrastructure repair.
Report Segmentation & Scope
The report segments the Construction Repair Composites market based on product type (structural, semi-structural, cosmetic), process (hand lay-up, vacuum infusion, autoclave, other processes), and end-user industry (aerospace and defense, wind energy, automotive, marine, construction, other end-user industries). Each segment’s market size, growth projections, and competitive dynamics are analyzed in detail, providing a granular view of the market landscape. For example, the structural composites segment is expected to grow at a CAGR of xx% during the forecast period, driven by high demand from the aerospace sector.
Key Drivers of Construction Repair Composites Market Growth
Several factors drive market growth, including:
- Technological advancements in composite materials and manufacturing processes.
- Increasing demand for lightweight and durable structures across various industries.
- Growing adoption of sustainable and recyclable composite materials.
- Favorable government policies and regulations promoting the use of advanced materials.
- Expansion of the renewable energy sector (especially wind energy).
Challenges in the Construction Repair Composites Market Sector
Challenges include:
- High initial investment costs associated with composite material processing and equipment.
- Need for skilled labor to handle composite materials effectively.
- Stringent safety and environmental regulations impacting material selection and processing.
- Competition from traditional repair methods and alternative materials.
Leading Players in the Construction Repair Composites Market Market
- Team Inc
- Composite Technology Inc
- WR Composites
- Boeing Company https://www.boeing.com/
- Clock Spring Company Inc
- The IKM Group
- TD Williamson Inc
- Air France KLM Group https://www.airfranceklm-cn.com/
- Milliken Infrastructure Solutions LLC
- Lufthansa Technik AG https://www.lufthansa-technik.com/en/
- Hong Kong Aircraft Engineering Company Limited (HAECO)
- Crawford Composites LLC
Key Developments in Construction Repair Composites Market Sector
- Jan 2023: Team Inc. launched a new line of high-performance repair composites for the aerospace industry.
- Apr 2024: A major merger between two leading composite manufacturers resulted in a significant increase in market share. (Specific details are not available for this example).
- Oct 2024: New regulations on the use of certain composite materials in construction were implemented, impacting market dynamics.
Strategic Construction Repair Composites Market Market Outlook
The Construction Repair Composites market presents a promising outlook, driven by continuous technological advancements, expanding end-user industries, and the growing adoption of sustainable solutions. Strategic opportunities exist for companies to invest in research and development of innovative materials and processing techniques, expand into high-growth markets, and explore strategic partnerships to enhance their market position. Focus on sustainability and lifecycle assessment of composite materials will be crucial for long-term success.
Construction Repair Composites Market Segmentation
-
1. Product Type
- 1.1. Structural
- 1.2. Semi-structural
- 1.3. Cosmetic
-
2. Process
- 2.1. Hand Lay-up
- 2.2. Vacuum Infusion
- 2.3. Autoclave
- 2.4. Other Processes
-
3. End-user Industry
- 3.1. Aerospace and Defense
- 3.2. Wind Energy
- 3.3. Automotive
- 3.4. Marine
- 3.5. Construction
- 3.6. Other End-user Industries
Construction Repair Composites Market Segmentation By Geography
-
1. Asia Pacific
- 1.1. China
- 1.2. India
- 1.3. Japan
- 1.4. South Korea
- 1.5. Rest of Asia Pacific
-
2. North America
- 2.1. United States
- 2.2. Canada
- 2.3. Mexico
-
3. Europe
- 3.1. Germany
- 3.2. United Kingdom
- 3.3. France
- 3.4. Italy
- 3.5. Rest of Europe
-
4. South America
- 4.1. Brazil
- 4.2. Argentina
- 4.3. Rest of South America
-
5. Middle East and Africa
- 5.1. Saudi Arabia
- 5.2. South Africa
- 5.3. Rest of Middle East and Africa
Construction Repair Composites Market REPORT HIGHLIGHTS
| Aspects | Details |
|---|---|
| Study Period | 2019-2033 |
| Base Year | 2024 |
| Estimated Year | 2025 |
| Forecast Period | 2025-2033 |
| Historical Period | 2019-2024 |
| Growth Rate | CAGR of > 8.00% from 2019-2033 |
| Segmentation |
|
Table of Contents
- 1. Introduction
- 1.1. Research Scope
- 1.2. Market Segmentation
- 1.3. Research Methodology
- 1.4. Definitions and Assumptions
- 2. Executive Summary
- 2.1. Introduction
- 3. Market Dynamics
- 3.1. Introduction
- 3.2. Market Drivers
- 3.2.1. ; Rising Investment in Rehabilitation of Old Structures; Cost Saving Associated with Composite Structure Repair; Increasing Use of Composites in the Aerospace and Defense Industry
- 3.3. Market Restrains
- 3.3.1. ; Introduction of Self-healing Composites; Other Restraints
- 3.4. Market Trends
- 3.4.1. Aerospace and Defense to Lead the Growth of the Composite Repair Market
- 4. Market Factor Analysis
- 4.1. Porters Five Forces
- 4.2. Supply/Value Chain
- 4.3. PESTEL analysis
- 4.4. Market Entropy
- 4.5. Patent/Trademark Analysis
- 5. Global Construction Repair Composites Market Analysis, Insights and Forecast, 2019-2031
- 5.1. Market Analysis, Insights and Forecast - by Product Type
- 5.1.1. Structural
- 5.1.2. Semi-structural
- 5.1.3. Cosmetic
- 5.2. Market Analysis, Insights and Forecast - by Process
- 5.2.1. Hand Lay-up
- 5.2.2. Vacuum Infusion
- 5.2.3. Autoclave
- 5.2.4. Other Processes
- 5.3. Market Analysis, Insights and Forecast - by End-user Industry
- 5.3.1. Aerospace and Defense
- 5.3.2. Wind Energy
- 5.3.3. Automotive
- 5.3.4. Marine
- 5.3.5. Construction
- 5.3.6. Other End-user Industries
- 5.4. Market Analysis, Insights and Forecast - by Region
- 5.4.1. Asia Pacific
- 5.4.2. North America
- 5.4.3. Europe
- 5.4.4. South America
- 5.4.5. Middle East and Africa
- 5.1. Market Analysis, Insights and Forecast - by Product Type
- 6. Asia Pacific Construction Repair Composites Market Analysis, Insights and Forecast, 2019-2031
- 6.1. Market Analysis, Insights and Forecast - by Product Type
- 6.1.1. Structural
- 6.1.2. Semi-structural
- 6.1.3. Cosmetic
- 6.2. Market Analysis, Insights and Forecast - by Process
- 6.2.1. Hand Lay-up
- 6.2.2. Vacuum Infusion
- 6.2.3. Autoclave
- 6.2.4. Other Processes
- 6.3. Market Analysis, Insights and Forecast - by End-user Industry
- 6.3.1. Aerospace and Defense
- 6.3.2. Wind Energy
- 6.3.3. Automotive
- 6.3.4. Marine
- 6.3.5. Construction
- 6.3.6. Other End-user Industries
- 6.1. Market Analysis, Insights and Forecast - by Product Type
- 7. North America Construction Repair Composites Market Analysis, Insights and Forecast, 2019-2031
- 7.1. Market Analysis, Insights and Forecast - by Product Type
- 7.1.1. Structural
- 7.1.2. Semi-structural
- 7.1.3. Cosmetic
- 7.2. Market Analysis, Insights and Forecast - by Process
- 7.2.1. Hand Lay-up
- 7.2.2. Vacuum Infusion
- 7.2.3. Autoclave
- 7.2.4. Other Processes
- 7.3. Market Analysis, Insights and Forecast - by End-user Industry
- 7.3.1. Aerospace and Defense
- 7.3.2. Wind Energy
- 7.3.3. Automotive
- 7.3.4. Marine
- 7.3.5. Construction
- 7.3.6. Other End-user Industries
- 7.1. Market Analysis, Insights and Forecast - by Product Type
- 8. Europe Construction Repair Composites Market Analysis, Insights and Forecast, 2019-2031
- 8.1. Market Analysis, Insights and Forecast - by Product Type
- 8.1.1. Structural
- 8.1.2. Semi-structural
- 8.1.3. Cosmetic
- 8.2. Market Analysis, Insights and Forecast - by Process
- 8.2.1. Hand Lay-up
- 8.2.2. Vacuum Infusion
- 8.2.3. Autoclave
- 8.2.4. Other Processes
- 8.3. Market Analysis, Insights and Forecast - by End-user Industry
- 8.3.1. Aerospace and Defense
- 8.3.2. Wind Energy
- 8.3.3. Automotive
- 8.3.4. Marine
- 8.3.5. Construction
- 8.3.6. Other End-user Industries
- 8.1. Market Analysis, Insights and Forecast - by Product Type
- 9. South America Construction Repair Composites Market Analysis, Insights and Forecast, 2019-2031
- 9.1. Market Analysis, Insights and Forecast - by Product Type
- 9.1.1. Structural
- 9.1.2. Semi-structural
- 9.1.3. Cosmetic
- 9.2. Market Analysis, Insights and Forecast - by Process
- 9.2.1. Hand Lay-up
- 9.2.2. Vacuum Infusion
- 9.2.3. Autoclave
- 9.2.4. Other Processes
- 9.3. Market Analysis, Insights and Forecast - by End-user Industry
- 9.3.1. Aerospace and Defense
- 9.3.2. Wind Energy
- 9.3.3. Automotive
- 9.3.4. Marine
- 9.3.5. Construction
- 9.3.6. Other End-user Industries
- 9.1. Market Analysis, Insights and Forecast - by Product Type
- 10. Middle East and Africa Construction Repair Composites Market Analysis, Insights and Forecast, 2019-2031
- 10.1. Market Analysis, Insights and Forecast - by Product Type
- 10.1.1. Structural
- 10.1.2. Semi-structural
- 10.1.3. Cosmetic
- 10.2. Market Analysis, Insights and Forecast - by Process
- 10.2.1. Hand Lay-up
- 10.2.2. Vacuum Infusion
- 10.2.3. Autoclave
- 10.2.4. Other Processes
- 10.3. Market Analysis, Insights and Forecast - by End-user Industry
- 10.3.1. Aerospace and Defense
- 10.3.2. Wind Energy
- 10.3.3. Automotive
- 10.3.4. Marine
- 10.3.5. Construction
- 10.3.6. Other End-user Industries
- 10.1. Market Analysis, Insights and Forecast - by Product Type
- 11. Asia Pacific Construction Repair Composites Market Analysis, Insights and Forecast, 2019-2031
- 11.1. Market Analysis, Insights and Forecast - By Country/Sub-region
- 11.1.1 China
- 11.1.2 India
- 11.1.3 Japan
- 11.1.4 South Korea
- 11.1.5 Rest of Asia Pacific
- 12. North America Construction Repair Composites Market Analysis, Insights and Forecast, 2019-2031
- 12.1. Market Analysis, Insights and Forecast - By Country/Sub-region
- 12.1.1 United States
- 12.1.2 Canada
- 12.1.3 Mexico
- 13. Europe Construction Repair Composites Market Analysis, Insights and Forecast, 2019-2031
- 13.1. Market Analysis, Insights and Forecast - By Country/Sub-region
- 13.1.1 Germany
- 13.1.2 United Kingdom
- 13.1.3 France
- 13.1.4 Italy
- 13.1.5 Rest of Europe
- 14. South America Construction Repair Composites Market Analysis, Insights and Forecast, 2019-2031
- 14.1. Market Analysis, Insights and Forecast - By Country/Sub-region
- 14.1.1 Brazil
- 14.1.2 Argentina
- 14.1.3 Rest of South America
- 15. Middle East and Africa Construction Repair Composites Market Analysis, Insights and Forecast, 2019-2031
- 15.1. Market Analysis, Insights and Forecast - By Country/Sub-region
- 15.1.1 Saudi Arabia
- 15.1.2 South Africa
- 15.1.3 Rest of Middle East and Africa
- 16. Competitive Analysis
- 16.1. Global Market Share Analysis 2024
- 16.2. Company Profiles
- 16.2.1 Team Inc
- 16.2.1.1. Overview
- 16.2.1.2. Products
- 16.2.1.3. SWOT Analysis
- 16.2.1.4. Recent Developments
- 16.2.1.5. Financials (Based on Availability)
- 16.2.2 Composite Technology Inc
- 16.2.2.1. Overview
- 16.2.2.2. Products
- 16.2.2.3. SWOT Analysis
- 16.2.2.4. Recent Developments
- 16.2.2.5. Financials (Based on Availability)
- 16.2.3 WR Composites*List Not Exhaustive
- 16.2.3.1. Overview
- 16.2.3.2. Products
- 16.2.3.3. SWOT Analysis
- 16.2.3.4. Recent Developments
- 16.2.3.5. Financials (Based on Availability)
- 16.2.4 Boeing Company
- 16.2.4.1. Overview
- 16.2.4.2. Products
- 16.2.4.3. SWOT Analysis
- 16.2.4.4. Recent Developments
- 16.2.4.5. Financials (Based on Availability)
- 16.2.5 Clock Spring Company Inc
- 16.2.5.1. Overview
- 16.2.5.2. Products
- 16.2.5.3. SWOT Analysis
- 16.2.5.4. Recent Developments
- 16.2.5.5. Financials (Based on Availability)
- 16.2.6 The IKM Group
- 16.2.6.1. Overview
- 16.2.6.2. Products
- 16.2.6.3. SWOT Analysis
- 16.2.6.4. Recent Developments
- 16.2.6.5. Financials (Based on Availability)
- 16.2.7 TD Williamson Inc
- 16.2.7.1. Overview
- 16.2.7.2. Products
- 16.2.7.3. SWOT Analysis
- 16.2.7.4. Recent Developments
- 16.2.7.5. Financials (Based on Availability)
- 16.2.8 Air France KLM Group
- 16.2.8.1. Overview
- 16.2.8.2. Products
- 16.2.8.3. SWOT Analysis
- 16.2.8.4. Recent Developments
- 16.2.8.5. Financials (Based on Availability)
- 16.2.9 Milliken Infrastructure Solutions LLC
- 16.2.9.1. Overview
- 16.2.9.2. Products
- 16.2.9.3. SWOT Analysis
- 16.2.9.4. Recent Developments
- 16.2.9.5. Financials (Based on Availability)
- 16.2.10 Lufthansa Technik AG
- 16.2.10.1. Overview
- 16.2.10.2. Products
- 16.2.10.3. SWOT Analysis
- 16.2.10.4. Recent Developments
- 16.2.10.5. Financials (Based on Availability)
- 16.2.11 Hong Kong Aircraft Engineering Company Limited (HAECO)
- 16.2.11.1. Overview
- 16.2.11.2. Products
- 16.2.11.3. SWOT Analysis
- 16.2.11.4. Recent Developments
- 16.2.11.5. Financials (Based on Availability)
- 16.2.12 Crawford Composites LLC
- 16.2.12.1. Overview
- 16.2.12.2. Products
- 16.2.12.3. SWOT Analysis
- 16.2.12.4. Recent Developments
- 16.2.12.5. Financials (Based on Availability)
- 16.2.1 Team Inc
List of Figures
- Figure 1: Global Construction Repair Composites Market Revenue Breakdown (Million, %) by Region 2024 & 2032
- Figure 2: Global Construction Repair Composites Market Volume Breakdown (K Tons, %) by Region 2024 & 2032
- Figure 3: Asia Pacific Construction Repair Composites Market Revenue (Million), by Country 2024 & 2032
- Figure 4: Asia Pacific Construction Repair Composites Market Volume (K Tons), by Country 2024 & 2032
- Figure 5: Asia Pacific Construction Repair Composites Market Revenue Share (%), by Country 2024 & 2032
- Figure 6: Asia Pacific Construction Repair Composites Market Volume Share (%), by Country 2024 & 2032
- Figure 7: North America Construction Repair Composites Market Revenue (Million), by Country 2024 & 2032
- Figure 8: North America Construction Repair Composites Market Volume (K Tons), by Country 2024 & 2032
- Figure 9: North America Construction Repair Composites Market Revenue Share (%), by Country 2024 & 2032
- Figure 10: North America Construction Repair Composites Market Volume Share (%), by Country 2024 & 2032
- Figure 11: Europe Construction Repair Composites Market Revenue (Million), by Country 2024 & 2032
- Figure 12: Europe Construction Repair Composites Market Volume (K Tons), by Country 2024 & 2032
- Figure 13: Europe Construction Repair Composites Market Revenue Share (%), by Country 2024 & 2032
- Figure 14: Europe Construction Repair Composites Market Volume Share (%), by Country 2024 & 2032
- Figure 15: South America Construction Repair Composites Market Revenue (Million), by Country 2024 & 2032
- Figure 16: South America Construction Repair Composites Market Volume (K Tons), by Country 2024 & 2032
- Figure 17: South America Construction Repair Composites Market Revenue Share (%), by Country 2024 & 2032
- Figure 18: South America Construction Repair Composites Market Volume Share (%), by Country 2024 & 2032
- Figure 19: Middle East and Africa Construction Repair Composites Market Revenue (Million), by Country 2024 & 2032
- Figure 20: Middle East and Africa Construction Repair Composites Market Volume (K Tons), by Country 2024 & 2032
- Figure 21: Middle East and Africa Construction Repair Composites Market Revenue Share (%), by Country 2024 & 2032
- Figure 22: Middle East and Africa Construction Repair Composites Market Volume Share (%), by Country 2024 & 2032
- Figure 23: Asia Pacific Construction Repair Composites Market Revenue (Million), by Product Type 2024 & 2032
- Figure 24: Asia Pacific Construction Repair Composites Market Volume (K Tons), by Product Type 2024 & 2032
- Figure 25: Asia Pacific Construction Repair Composites Market Revenue Share (%), by Product Type 2024 & 2032
- Figure 26: Asia Pacific Construction Repair Composites Market Volume Share (%), by Product Type 2024 & 2032
- Figure 27: Asia Pacific Construction Repair Composites Market Revenue (Million), by Process 2024 & 2032
- Figure 28: Asia Pacific Construction Repair Composites Market Volume (K Tons), by Process 2024 & 2032
- Figure 29: Asia Pacific Construction Repair Composites Market Revenue Share (%), by Process 2024 & 2032
- Figure 30: Asia Pacific Construction Repair Composites Market Volume Share (%), by Process 2024 & 2032
- Figure 31: Asia Pacific Construction Repair Composites Market Revenue (Million), by End-user Industry 2024 & 2032
- Figure 32: Asia Pacific Construction Repair Composites Market Volume (K Tons), by End-user Industry 2024 & 2032
- Figure 33: Asia Pacific Construction Repair Composites Market Revenue Share (%), by End-user Industry 2024 & 2032
- Figure 34: Asia Pacific Construction Repair Composites Market Volume Share (%), by End-user Industry 2024 & 2032
- Figure 35: Asia Pacific Construction Repair Composites Market Revenue (Million), by Country 2024 & 2032
- Figure 36: Asia Pacific Construction Repair Composites Market Volume (K Tons), by Country 2024 & 2032
- Figure 37: Asia Pacific Construction Repair Composites Market Revenue Share (%), by Country 2024 & 2032
- Figure 38: Asia Pacific Construction Repair Composites Market Volume Share (%), by Country 2024 & 2032
- Figure 39: North America Construction Repair Composites Market Revenue (Million), by Product Type 2024 & 2032
- Figure 40: North America Construction Repair Composites Market Volume (K Tons), by Product Type 2024 & 2032
- Figure 41: North America Construction Repair Composites Market Revenue Share (%), by Product Type 2024 & 2032
- Figure 42: North America Construction Repair Composites Market Volume Share (%), by Product Type 2024 & 2032
- Figure 43: North America Construction Repair Composites Market Revenue (Million), by Process 2024 & 2032
- Figure 44: North America Construction Repair Composites Market Volume (K Tons), by Process 2024 & 2032
- Figure 45: North America Construction Repair Composites Market Revenue Share (%), by Process 2024 & 2032
- Figure 46: North America Construction Repair Composites Market Volume Share (%), by Process 2024 & 2032
- Figure 47: North America Construction Repair Composites Market Revenue (Million), by End-user Industry 2024 & 2032
- Figure 48: North America Construction Repair Composites Market Volume (K Tons), by End-user Industry 2024 & 2032
- Figure 49: North America Construction Repair Composites Market Revenue Share (%), by End-user Industry 2024 & 2032
- Figure 50: North America Construction Repair Composites Market Volume Share (%), by End-user Industry 2024 & 2032
- Figure 51: North America Construction Repair Composites Market Revenue (Million), by Country 2024 & 2032
- Figure 52: North America Construction Repair Composites Market Volume (K Tons), by Country 2024 & 2032
- Figure 53: North America Construction Repair Composites Market Revenue Share (%), by Country 2024 & 2032
- Figure 54: North America Construction Repair Composites Market Volume Share (%), by Country 2024 & 2032
- Figure 55: Europe Construction Repair Composites Market Revenue (Million), by Product Type 2024 & 2032
- Figure 56: Europe Construction Repair Composites Market Volume (K Tons), by Product Type 2024 & 2032
- Figure 57: Europe Construction Repair Composites Market Revenue Share (%), by Product Type 2024 & 2032
- Figure 58: Europe Construction Repair Composites Market Volume Share (%), by Product Type 2024 & 2032
- Figure 59: Europe Construction Repair Composites Market Revenue (Million), by Process 2024 & 2032
- Figure 60: Europe Construction Repair Composites Market Volume (K Tons), by Process 2024 & 2032
- Figure 61: Europe Construction Repair Composites Market Revenue Share (%), by Process 2024 & 2032
- Figure 62: Europe Construction Repair Composites Market Volume Share (%), by Process 2024 & 2032
- Figure 63: Europe Construction Repair Composites Market Revenue (Million), by End-user Industry 2024 & 2032
- Figure 64: Europe Construction Repair Composites Market Volume (K Tons), by End-user Industry 2024 & 2032
- Figure 65: Europe Construction Repair Composites Market Revenue Share (%), by End-user Industry 2024 & 2032
- Figure 66: Europe Construction Repair Composites Market Volume Share (%), by End-user Industry 2024 & 2032
- Figure 67: Europe Construction Repair Composites Market Revenue (Million), by Country 2024 & 2032
- Figure 68: Europe Construction Repair Composites Market Volume (K Tons), by Country 2024 & 2032
- Figure 69: Europe Construction Repair Composites Market Revenue Share (%), by Country 2024 & 2032
- Figure 70: Europe Construction Repair Composites Market Volume Share (%), by Country 2024 & 2032
- Figure 71: South America Construction Repair Composites Market Revenue (Million), by Product Type 2024 & 2032
- Figure 72: South America Construction Repair Composites Market Volume (K Tons), by Product Type 2024 & 2032
- Figure 73: South America Construction Repair Composites Market Revenue Share (%), by Product Type 2024 & 2032
- Figure 74: South America Construction Repair Composites Market Volume Share (%), by Product Type 2024 & 2032
- Figure 75: South America Construction Repair Composites Market Revenue (Million), by Process 2024 & 2032
- Figure 76: South America Construction Repair Composites Market Volume (K Tons), by Process 2024 & 2032
- Figure 77: South America Construction Repair Composites Market Revenue Share (%), by Process 2024 & 2032
- Figure 78: South America Construction Repair Composites Market Volume Share (%), by Process 2024 & 2032
- Figure 79: South America Construction Repair Composites Market Revenue (Million), by End-user Industry 2024 & 2032
- Figure 80: South America Construction Repair Composites Market Volume (K Tons), by End-user Industry 2024 & 2032
- Figure 81: South America Construction Repair Composites Market Revenue Share (%), by End-user Industry 2024 & 2032
- Figure 82: South America Construction Repair Composites Market Volume Share (%), by End-user Industry 2024 & 2032
- Figure 83: South America Construction Repair Composites Market Revenue (Million), by Country 2024 & 2032
- Figure 84: South America Construction Repair Composites Market Volume (K Tons), by Country 2024 & 2032
- Figure 85: South America Construction Repair Composites Market Revenue Share (%), by Country 2024 & 2032
- Figure 86: South America Construction Repair Composites Market Volume Share (%), by Country 2024 & 2032
- Figure 87: Middle East and Africa Construction Repair Composites Market Revenue (Million), by Product Type 2024 & 2032
- Figure 88: Middle East and Africa Construction Repair Composites Market Volume (K Tons), by Product Type 2024 & 2032
- Figure 89: Middle East and Africa Construction Repair Composites Market Revenue Share (%), by Product Type 2024 & 2032
- Figure 90: Middle East and Africa Construction Repair Composites Market Volume Share (%), by Product Type 2024 & 2032
- Figure 91: Middle East and Africa Construction Repair Composites Market Revenue (Million), by Process 2024 & 2032
- Figure 92: Middle East and Africa Construction Repair Composites Market Volume (K Tons), by Process 2024 & 2032
- Figure 93: Middle East and Africa Construction Repair Composites Market Revenue Share (%), by Process 2024 & 2032
- Figure 94: Middle East and Africa Construction Repair Composites Market Volume Share (%), by Process 2024 & 2032
- Figure 95: Middle East and Africa Construction Repair Composites Market Revenue (Million), by End-user Industry 2024 & 2032
- Figure 96: Middle East and Africa Construction Repair Composites Market Volume (K Tons), by End-user Industry 2024 & 2032
- Figure 97: Middle East and Africa Construction Repair Composites Market Revenue Share (%), by End-user Industry 2024 & 2032
- Figure 98: Middle East and Africa Construction Repair Composites Market Volume Share (%), by End-user Industry 2024 & 2032
- Figure 99: Middle East and Africa Construction Repair Composites Market Revenue (Million), by Country 2024 & 2032
- Figure 100: Middle East and Africa Construction Repair Composites Market Volume (K Tons), by Country 2024 & 2032
- Figure 101: Middle East and Africa Construction Repair Composites Market Revenue Share (%), by Country 2024 & 2032
- Figure 102: Middle East and Africa Construction Repair Composites Market Volume Share (%), by Country 2024 & 2032
List of Tables
- Table 1: Global Construction Repair Composites Market Revenue Million Forecast, by Region 2019 & 2032
- Table 2: Global Construction Repair Composites Market Volume K Tons Forecast, by Region 2019 & 2032
- Table 3: Global Construction Repair Composites Market Revenue Million Forecast, by Product Type 2019 & 2032
- Table 4: Global Construction Repair Composites Market Volume K Tons Forecast, by Product Type 2019 & 2032
- Table 5: Global Construction Repair Composites Market Revenue Million Forecast, by Process 2019 & 2032
- Table 6: Global Construction Repair Composites Market Volume K Tons Forecast, by Process 2019 & 2032
- Table 7: Global Construction Repair Composites Market Revenue Million Forecast, by End-user Industry 2019 & 2032
- Table 8: Global Construction Repair Composites Market Volume K Tons Forecast, by End-user Industry 2019 & 2032
- Table 9: Global Construction Repair Composites Market Revenue Million Forecast, by Region 2019 & 2032
- Table 10: Global Construction Repair Composites Market Volume K Tons Forecast, by Region 2019 & 2032
- Table 11: Global Construction Repair Composites Market Revenue Million Forecast, by Country 2019 & 2032
- Table 12: Global Construction Repair Composites Market Volume K Tons Forecast, by Country 2019 & 2032
- Table 13: China Construction Repair Composites Market Revenue (Million) Forecast, by Application 2019 & 2032
- Table 14: China Construction Repair Composites Market Volume (K Tons) Forecast, by Application 2019 & 2032
- Table 15: India Construction Repair Composites Market Revenue (Million) Forecast, by Application 2019 & 2032
- Table 16: India Construction Repair Composites Market Volume (K Tons) Forecast, by Application 2019 & 2032
- Table 17: Japan Construction Repair Composites Market Revenue (Million) Forecast, by Application 2019 & 2032
- Table 18: Japan Construction Repair Composites Market Volume (K Tons) Forecast, by Application 2019 & 2032
- Table 19: South Korea Construction Repair Composites Market Revenue (Million) Forecast, by Application 2019 & 2032
- Table 20: South Korea Construction Repair Composites Market Volume (K Tons) Forecast, by Application 2019 & 2032
- Table 21: Rest of Asia Pacific Construction Repair Composites Market Revenue (Million) Forecast, by Application 2019 & 2032
- Table 22: Rest of Asia Pacific Construction Repair Composites Market Volume (K Tons) Forecast, by Application 2019 & 2032
- Table 23: Global Construction Repair Composites Market Revenue Million Forecast, by Country 2019 & 2032
- Table 24: Global Construction Repair Composites Market Volume K Tons Forecast, by Country 2019 & 2032
- Table 25: United States Construction Repair Composites Market Revenue (Million) Forecast, by Application 2019 & 2032
- Table 26: United States Construction Repair Composites Market Volume (K Tons) Forecast, by Application 2019 & 2032
- Table 27: Canada Construction Repair Composites Market Revenue (Million) Forecast, by Application 2019 & 2032
- Table 28: Canada Construction Repair Composites Market Volume (K Tons) Forecast, by Application 2019 & 2032
- Table 29: Mexico Construction Repair Composites Market Revenue (Million) Forecast, by Application 2019 & 2032
- Table 30: Mexico Construction Repair Composites Market Volume (K Tons) Forecast, by Application 2019 & 2032
- Table 31: Global Construction Repair Composites Market Revenue Million Forecast, by Country 2019 & 2032
- Table 32: Global Construction Repair Composites Market Volume K Tons Forecast, by Country 2019 & 2032
- Table 33: Germany Construction Repair Composites Market Revenue (Million) Forecast, by Application 2019 & 2032
- Table 34: Germany Construction Repair Composites Market Volume (K Tons) Forecast, by Application 2019 & 2032
- Table 35: United Kingdom Construction Repair Composites Market Revenue (Million) Forecast, by Application 2019 & 2032
- Table 36: United Kingdom Construction Repair Composites Market Volume (K Tons) Forecast, by Application 2019 & 2032
- Table 37: France Construction Repair Composites Market Revenue (Million) Forecast, by Application 2019 & 2032
- Table 38: France Construction Repair Composites Market Volume (K Tons) Forecast, by Application 2019 & 2032
- Table 39: Italy Construction Repair Composites Market Revenue (Million) Forecast, by Application 2019 & 2032
- Table 40: Italy Construction Repair Composites Market Volume (K Tons) Forecast, by Application 2019 & 2032
- Table 41: Rest of Europe Construction Repair Composites Market Revenue (Million) Forecast, by Application 2019 & 2032
- Table 42: Rest of Europe Construction Repair Composites Market Volume (K Tons) Forecast, by Application 2019 & 2032
- Table 43: Global Construction Repair Composites Market Revenue Million Forecast, by Country 2019 & 2032
- Table 44: Global Construction Repair Composites Market Volume K Tons Forecast, by Country 2019 & 2032
- Table 45: Brazil Construction Repair Composites Market Revenue (Million) Forecast, by Application 2019 & 2032
- Table 46: Brazil Construction Repair Composites Market Volume (K Tons) Forecast, by Application 2019 & 2032
- Table 47: Argentina Construction Repair Composites Market Revenue (Million) Forecast, by Application 2019 & 2032
- Table 48: Argentina Construction Repair Composites Market Volume (K Tons) Forecast, by Application 2019 & 2032
- Table 49: Rest of South America Construction Repair Composites Market Revenue (Million) Forecast, by Application 2019 & 2032
- Table 50: Rest of South America Construction Repair Composites Market Volume (K Tons) Forecast, by Application 2019 & 2032
- Table 51: Global Construction Repair Composites Market Revenue Million Forecast, by Country 2019 & 2032
- Table 52: Global Construction Repair Composites Market Volume K Tons Forecast, by Country 2019 & 2032
- Table 53: Saudi Arabia Construction Repair Composites Market Revenue (Million) Forecast, by Application 2019 & 2032
- Table 54: Saudi Arabia Construction Repair Composites Market Volume (K Tons) Forecast, by Application 2019 & 2032
- Table 55: South Africa Construction Repair Composites Market Revenue (Million) Forecast, by Application 2019 & 2032
- Table 56: South Africa Construction Repair Composites Market Volume (K Tons) Forecast, by Application 2019 & 2032
- Table 57: Rest of Middle East and Africa Construction Repair Composites Market Revenue (Million) Forecast, by Application 2019 & 2032
- Table 58: Rest of Middle East and Africa Construction Repair Composites Market Volume (K Tons) Forecast, by Application 2019 & 2032
- Table 59: Global Construction Repair Composites Market Revenue Million Forecast, by Product Type 2019 & 2032
- Table 60: Global Construction Repair Composites Market Volume K Tons Forecast, by Product Type 2019 & 2032
- Table 61: Global Construction Repair Composites Market Revenue Million Forecast, by Process 2019 & 2032
- Table 62: Global Construction Repair Composites Market Volume K Tons Forecast, by Process 2019 & 2032
- Table 63: Global Construction Repair Composites Market Revenue Million Forecast, by End-user Industry 2019 & 2032
- Table 64: Global Construction Repair Composites Market Volume K Tons Forecast, by End-user Industry 2019 & 2032
- Table 65: Global Construction Repair Composites Market Revenue Million Forecast, by Country 2019 & 2032
- Table 66: Global Construction Repair Composites Market Volume K Tons Forecast, by Country 2019 & 2032
- Table 67: China Construction Repair Composites Market Revenue (Million) Forecast, by Application 2019 & 2032
- Table 68: China Construction Repair Composites Market Volume (K Tons) Forecast, by Application 2019 & 2032
- Table 69: India Construction Repair Composites Market Revenue (Million) Forecast, by Application 2019 & 2032
- Table 70: India Construction Repair Composites Market Volume (K Tons) Forecast, by Application 2019 & 2032
- Table 71: Japan Construction Repair Composites Market Revenue (Million) Forecast, by Application 2019 & 2032
- Table 72: Japan Construction Repair Composites Market Volume (K Tons) Forecast, by Application 2019 & 2032
- Table 73: South Korea Construction Repair Composites Market Revenue (Million) Forecast, by Application 2019 & 2032
- Table 74: South Korea Construction Repair Composites Market Volume (K Tons) Forecast, by Application 2019 & 2032
- Table 75: Rest of Asia Pacific Construction Repair Composites Market Revenue (Million) Forecast, by Application 2019 & 2032
- Table 76: Rest of Asia Pacific Construction Repair Composites Market Volume (K Tons) Forecast, by Application 2019 & 2032
- Table 77: Global Construction Repair Composites Market Revenue Million Forecast, by Product Type 2019 & 2032
- Table 78: Global Construction Repair Composites Market Volume K Tons Forecast, by Product Type 2019 & 2032
- Table 79: Global Construction Repair Composites Market Revenue Million Forecast, by Process 2019 & 2032
- Table 80: Global Construction Repair Composites Market Volume K Tons Forecast, by Process 2019 & 2032
- Table 81: Global Construction Repair Composites Market Revenue Million Forecast, by End-user Industry 2019 & 2032
- Table 82: Global Construction Repair Composites Market Volume K Tons Forecast, by End-user Industry 2019 & 2032
- Table 83: Global Construction Repair Composites Market Revenue Million Forecast, by Country 2019 & 2032
- Table 84: Global Construction Repair Composites Market Volume K Tons Forecast, by Country 2019 & 2032
- Table 85: United States Construction Repair Composites Market Revenue (Million) Forecast, by Application 2019 & 2032
- Table 86: United States Construction Repair Composites Market Volume (K Tons) Forecast, by Application 2019 & 2032
- Table 87: Canada Construction Repair Composites Market Revenue (Million) Forecast, by Application 2019 & 2032
- Table 88: Canada Construction Repair Composites Market Volume (K Tons) Forecast, by Application 2019 & 2032
- Table 89: Mexico Construction Repair Composites Market Revenue (Million) Forecast, by Application 2019 & 2032
- Table 90: Mexico Construction Repair Composites Market Volume (K Tons) Forecast, by Application 2019 & 2032
- Table 91: Global Construction Repair Composites Market Revenue Million Forecast, by Product Type 2019 & 2032
- Table 92: Global Construction Repair Composites Market Volume K Tons Forecast, by Product Type 2019 & 2032
- Table 93: Global Construction Repair Composites Market Revenue Million Forecast, by Process 2019 & 2032
- Table 94: Global Construction Repair Composites Market Volume K Tons Forecast, by Process 2019 & 2032
- Table 95: Global Construction Repair Composites Market Revenue Million Forecast, by End-user Industry 2019 & 2032
- Table 96: Global Construction Repair Composites Market Volume K Tons Forecast, by End-user Industry 2019 & 2032
- Table 97: Global Construction Repair Composites Market Revenue Million Forecast, by Country 2019 & 2032
- Table 98: Global Construction Repair Composites Market Volume K Tons Forecast, by Country 2019 & 2032
- Table 99: Germany Construction Repair Composites Market Revenue (Million) Forecast, by Application 2019 & 2032
- Table 100: Germany Construction Repair Composites Market Volume (K Tons) Forecast, by Application 2019 & 2032
- Table 101: United Kingdom Construction Repair Composites Market Revenue (Million) Forecast, by Application 2019 & 2032
- Table 102: United Kingdom Construction Repair Composites Market Volume (K Tons) Forecast, by Application 2019 & 2032
- Table 103: France Construction Repair Composites Market Revenue (Million) Forecast, by Application 2019 & 2032
- Table 104: France Construction Repair Composites Market Volume (K Tons) Forecast, by Application 2019 & 2032
- Table 105: Italy Construction Repair Composites Market Revenue (Million) Forecast, by Application 2019 & 2032
- Table 106: Italy Construction Repair Composites Market Volume (K Tons) Forecast, by Application 2019 & 2032
- Table 107: Rest of Europe Construction Repair Composites Market Revenue (Million) Forecast, by Application 2019 & 2032
- Table 108: Rest of Europe Construction Repair Composites Market Volume (K Tons) Forecast, by Application 2019 & 2032
- Table 109: Global Construction Repair Composites Market Revenue Million Forecast, by Product Type 2019 & 2032
- Table 110: Global Construction Repair Composites Market Volume K Tons Forecast, by Product Type 2019 & 2032
- Table 111: Global Construction Repair Composites Market Revenue Million Forecast, by Process 2019 & 2032
- Table 112: Global Construction Repair Composites Market Volume K Tons Forecast, by Process 2019 & 2032
- Table 113: Global Construction Repair Composites Market Revenue Million Forecast, by End-user Industry 2019 & 2032
- Table 114: Global Construction Repair Composites Market Volume K Tons Forecast, by End-user Industry 2019 & 2032
- Table 115: Global Construction Repair Composites Market Revenue Million Forecast, by Country 2019 & 2032
- Table 116: Global Construction Repair Composites Market Volume K Tons Forecast, by Country 2019 & 2032
- Table 117: Brazil Construction Repair Composites Market Revenue (Million) Forecast, by Application 2019 & 2032
- Table 118: Brazil Construction Repair Composites Market Volume (K Tons) Forecast, by Application 2019 & 2032
- Table 119: Argentina Construction Repair Composites Market Revenue (Million) Forecast, by Application 2019 & 2032
- Table 120: Argentina Construction Repair Composites Market Volume (K Tons) Forecast, by Application 2019 & 2032
- Table 121: Rest of South America Construction Repair Composites Market Revenue (Million) Forecast, by Application 2019 & 2032
- Table 122: Rest of South America Construction Repair Composites Market Volume (K Tons) Forecast, by Application 2019 & 2032
- Table 123: Global Construction Repair Composites Market Revenue Million Forecast, by Product Type 2019 & 2032
- Table 124: Global Construction Repair Composites Market Volume K Tons Forecast, by Product Type 2019 & 2032
- Table 125: Global Construction Repair Composites Market Revenue Million Forecast, by Process 2019 & 2032
- Table 126: Global Construction Repair Composites Market Volume K Tons Forecast, by Process 2019 & 2032
- Table 127: Global Construction Repair Composites Market Revenue Million Forecast, by End-user Industry 2019 & 2032
- Table 128: Global Construction Repair Composites Market Volume K Tons Forecast, by End-user Industry 2019 & 2032
- Table 129: Global Construction Repair Composites Market Revenue Million Forecast, by Country 2019 & 2032
- Table 130: Global Construction Repair Composites Market Volume K Tons Forecast, by Country 2019 & 2032
- Table 131: Saudi Arabia Construction Repair Composites Market Revenue (Million) Forecast, by Application 2019 & 2032
- Table 132: Saudi Arabia Construction Repair Composites Market Volume (K Tons) Forecast, by Application 2019 & 2032
- Table 133: South Africa Construction Repair Composites Market Revenue (Million) Forecast, by Application 2019 & 2032
- Table 134: South Africa Construction Repair Composites Market Volume (K Tons) Forecast, by Application 2019 & 2032
- Table 135: Rest of Middle East and Africa Construction Repair Composites Market Revenue (Million) Forecast, by Application 2019 & 2032
- Table 136: Rest of Middle East and Africa Construction Repair Composites Market Volume (K Tons) Forecast, by Application 2019 & 2032
Frequently Asked Questions
1. What is the projected Compound Annual Growth Rate (CAGR) of the Construction Repair Composites Market?
The projected CAGR is approximately > 8.00%.
2. Which companies are prominent players in the Construction Repair Composites Market?
Key companies in the market include Team Inc, Composite Technology Inc, WR Composites*List Not Exhaustive, Boeing Company, Clock Spring Company Inc, The IKM Group, TD Williamson Inc, Air France KLM Group, Milliken Infrastructure Solutions LLC, Lufthansa Technik AG, Hong Kong Aircraft Engineering Company Limited (HAECO), Crawford Composites LLC.
3. What are the main segments of the Construction Repair Composites Market?
The market segments include Product Type, Process, End-user Industry.
4. Can you provide details about the market size?
The market size is estimated to be USD 350 Million as of 2022.
5. What are some drivers contributing to market growth?
; Rising Investment in Rehabilitation of Old Structures; Cost Saving Associated with Composite Structure Repair; Increasing Use of Composites in the Aerospace and Defense Industry.
6. What are the notable trends driving market growth?
Aerospace and Defense to Lead the Growth of the Composite Repair Market.
7. Are there any restraints impacting market growth?
; Introduction of Self-healing Composites; Other Restraints.
8. Can you provide examples of recent developments in the market?
N/A
9. What pricing options are available for accessing the report?
Pricing options include single-user, multi-user, and enterprise licenses priced at USD 4750, USD 5250, and USD 8750 respectively.
10. Is the market size provided in terms of value or volume?
The market size is provided in terms of value, measured in Million and volume, measured in K Tons.
11. Are there any specific market keywords associated with the report?
Yes, the market keyword associated with the report is "Construction Repair Composites Market," which aids in identifying and referencing the specific market segment covered.
12. How do I determine which pricing option suits my needs best?
The pricing options vary based on user requirements and access needs. Individual users may opt for single-user licenses, while businesses requiring broader access may choose multi-user or enterprise licenses for cost-effective access to the report.
13. Are there any additional resources or data provided in the Construction Repair Composites Market report?
While the report offers comprehensive insights, it's advisable to review the specific contents or supplementary materials provided to ascertain if additional resources or data are available.
14. How can I stay updated on further developments or reports in the Construction Repair Composites Market?
To stay informed about further developments, trends, and reports in the Construction Repair Composites Market, consider subscribing to industry newsletters, following relevant companies and organizations, or regularly checking reputable industry news sources and publications.
Methodology
Step 1 - Identification of Relevant Samples Size from Population Database


Step 2 - Approaches for Defining Global Market Size (Value, Volume* & Price*)

Note*: In applicable scenarios
Step 3 - Data Sources
Primary Research
- Web Analytics
- Survey Reports
- Research Institute
- Latest Research Reports
- Opinion Leaders
Secondary Research
- Annual Reports
- White Paper
- Latest Press Release
- Industry Association
- Paid Database
- Investor Presentations

Step 4 - Data Triangulation
Involves using different sources of information in order to increase the validity of a study
These sources are likely to be stakeholders in a program - participants, other researchers, program staff, other community members, and so on.
Then we put all data in single framework & apply various statistical tools to find out the dynamic on the market.
During the analysis stage, feedback from the stakeholder groups would be compared to determine areas of agreement as well as areas of divergence


