
Key Insights
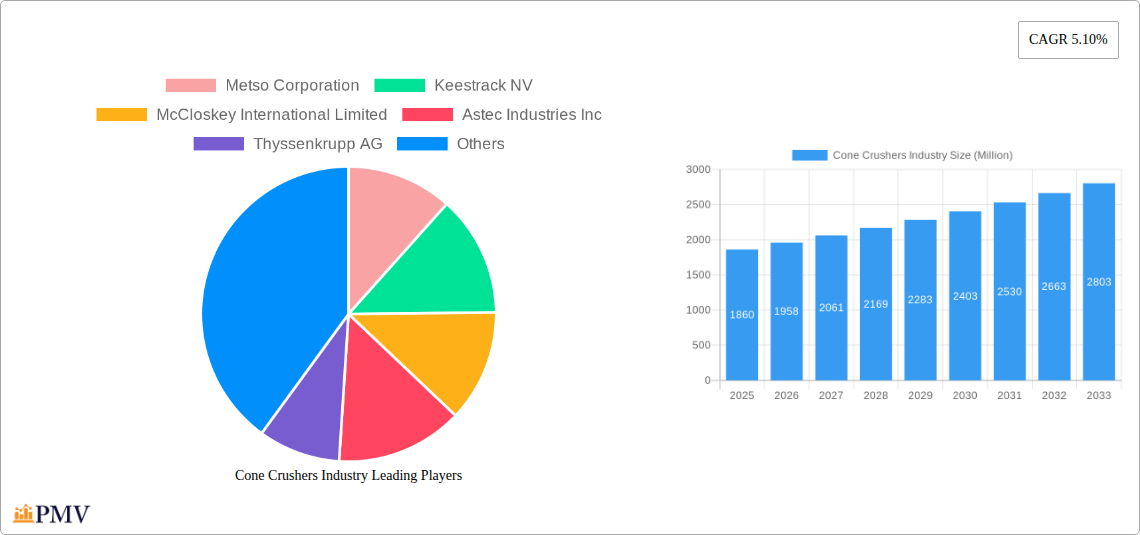
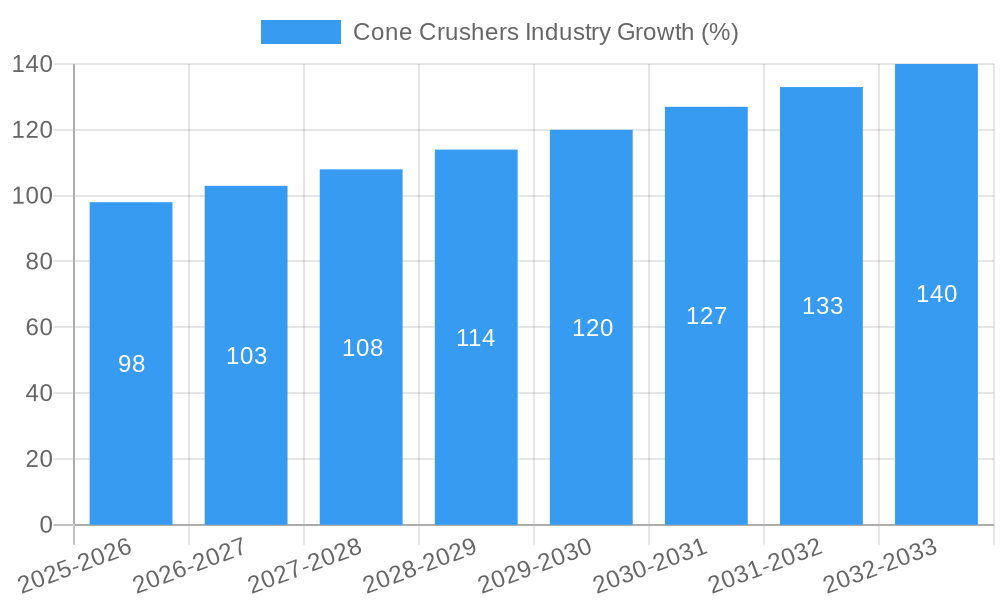
The global cone crusher market, valued at $1.86 billion in 2025, is projected to experience robust growth, driven by a Compound Annual Growth Rate (CAGR) of 5.10% from 2025 to 2033. This expansion is fueled by the increasing demand for infrastructure development across various sectors, particularly mining, construction, and aggregate processing. The mining industry's continuous need for efficient and high-capacity crushing solutions for ore processing is a significant driver. Furthermore, the growth of construction activities globally, particularly in developing economies, is boosting demand for cone crushers. Technological advancements, such as the development of more efficient and durable crusher designs, incorporating automation and improved material handling systems, are enhancing productivity and lowering operational costs, further contributing to market growth. The preference for mobile and portable crushers is also rising due to their flexibility and suitability for various project sites. However, fluctuating raw material prices, stringent environmental regulations, and potential economic downturns pose challenges to the market's sustained growth. The market is segmented by end-user application (mining, construction, aggregate processing, demolition, and others), type (Symons, hydraulic, gyratory, and others), offering (mobile, portable, and stationary crushers), and power source (electric, diesel, and dual). Competitive dynamics are shaped by established players like Metso Outotec, McCloskey International, and Astec Industries, among others, who are constantly innovating and expanding their product portfolios to meet evolving market demands.
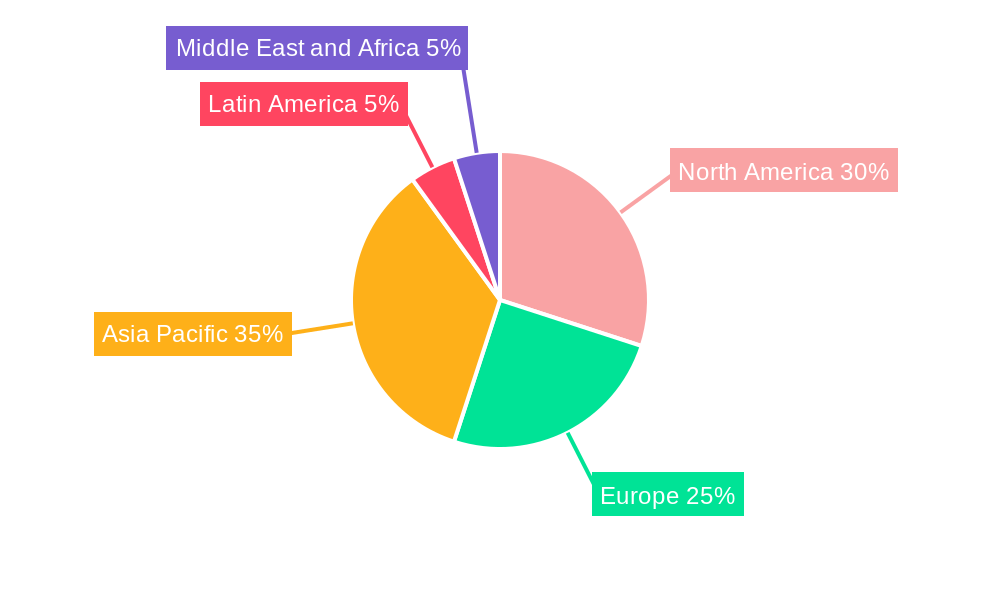
The market's regional distribution reflects global infrastructure development patterns. North America and Europe currently hold significant market shares, driven by established infrastructure and ongoing construction projects. However, the Asia-Pacific region, particularly India and China, is anticipated to witness substantial growth in the coming years, fueled by rapid urbanization and industrialization initiatives. Latin America and the Middle East & Africa are also showing promising growth potential. The ongoing focus on sustainable mining practices and the increasing adoption of environmentally friendly technologies within the cone crusher segment are expected to influence market growth trajectories. The market is likely to see consolidation among key players, with mergers and acquisitions as strategies for expansion and technological advancement. The emphasis on enhancing operational efficiency, reducing energy consumption, and improving safety standards will continue to shape the cone crusher industry's future.
Cone Crushers Industry Market Report: 2019-2033
This comprehensive report provides a detailed analysis of the global cone crushers industry, offering valuable insights into market dynamics, competitive landscapes, and future growth prospects. Covering the period from 2019 to 2033, with a focus on 2025, this report is an essential resource for industry professionals, investors, and strategic decision-makers. The market is valued at xx Million in 2025 and is projected to reach xx Million by 2033, exhibiting a CAGR of xx%.
Cone Crushers Industry Market Structure & Competitive Dynamics
The cone crushers industry is characterized by a moderately concentrated market structure, with several major players holding significant market share. Metso Corporation, Sandvik AB, FLSmidth & Co A/S, and Terex Corporation are among the leading companies, each employing diverse strategies to maintain their positions. Innovation plays a crucial role, with companies continuously investing in Research & Development to improve crusher efficiency, durability, and automation. The industry is subject to various regulatory frameworks concerning safety, environmental impact, and emissions. Product substitutes, such as jaw crushers and impact crushers, exist but offer different performance characteristics, limiting their direct substitution. End-user trends towards automation, increased productivity, and sustainability are driving demand for advanced cone crusher technologies. Mergers and acquisitions (M&A) activity has been moderate in recent years, with deal values ranging from xx Million to xx Million, reflecting consolidation efforts within the industry.
- Market Concentration: Moderately concentrated, with top 5 players holding approximately xx% market share in 2025.
- Innovation Ecosystems: Strong R&D investment focused on automation, energy efficiency, and reduced emissions.
- Regulatory Frameworks: Stringent safety and environmental regulations impact design and operation.
- M&A Activity: Moderate activity, with deals focused on expanding geographic reach and technology portfolios. Examples include (but are not exhaustive) deals valued at an estimated xx Million in 2022 and xx Million in 2023.
Cone Crushers Industry Industry Trends & Insights
The global cone crushers market is experiencing robust growth, driven by expanding infrastructure development, particularly in emerging economies. Increased mining activities and the rising demand for aggregates for construction projects are major growth catalysts. Technological advancements, such as the adoption of electric-powered crushers and advanced control systems, are improving efficiency and reducing operational costs. Consumer preferences are shifting towards environmentally friendly and sustainable solutions, pushing manufacturers to develop more efficient and less emission-intensive crushers. The competitive landscape is dynamic, with established players focusing on innovation and expansion, while new entrants explore niche market segments. Market penetration of electric-powered cone crushers is increasing at a CAGR of xx% from 2025 to 2033. The market is also witnessing increased adoption of IoT and AI-driven predictive maintenance systems, enabling improved operational efficiency and minimizing downtime. The overall market growth is estimated to be xx% CAGR from 2025 to 2033.
Dominant Markets & Segments in Cone Crushers Industry
The Mining and Metallurgy segment dominates the cone crushers market, accounting for approximately xx% of the total revenue in 2025, driven by the increasing demand for crushed ores and minerals. Within the types of crushers, Hydraulic Cone Crushers hold a significant market share due to their versatility and higher productivity compared to other types. Mobile crushers are preferred by construction and aggregate processing companies due to their portability and reduced site setup time. The regions of North America and Asia-Pacific are leading consumers, fueled by robust infrastructure projects and mining activities.
- Key Drivers for Mining and Metallurgy: Growth in mining activities, increasing demand for metals, and technological advancements in ore processing.
- Key Drivers for Construction: Infrastructure development, urbanization, and government investments in construction projects.
- Key Drivers for Aggregate Processing: Rising construction activity, expanding road networks, and the need for high-quality aggregates.
- Dominant Regions: North America and Asia-Pacific, driven by strong economic growth and infrastructure spending.
The electric connection power source segment is also witnessing strong growth due to increasing concerns about environmental sustainability and potential cost savings associated with electricity compared to diesel.
Cone Crushers Industry Product Innovations
Recent innovations in cone crushers focus on enhancing efficiency, reducing operating costs, and minimizing environmental impact. Electric-driven models, improved automation systems, and advanced materials are key areas of development. Manufacturers are also integrating advanced technologies like IoT and predictive maintenance for optimized performance and reduced downtime. These innovations are improving the market fit of cone crushers by addressing the growing demand for sustainable and high-performance crushing solutions.
Report Segmentation & Scope
This report segments the cone crushers market by:
- End-user Application: Mining and Metallurgy, Construction, Aggregate Processing, Demolition, Other End-user Applications (each segment showing xx% market share in 2025 and projected growth).
- Type: Symons, Hydraulics, Gyratory, Other Types (market share and growth projections for each type provided).
- Offering: Mobile Crushers, Portable Crushers, Stationary Crushers (market size and competitive analysis for each offering).
- Power Source: Electric Connection, Diesel Connection, Dual Connection (growth projections and market dynamics for each power source).
Each segment includes detailed market size estimations, growth projections, and competitive analysis.
Key Drivers of Cone Crushers Industry Growth
Several factors drive growth in the cone crushers industry:
- Increased Mining and Construction Activity: Global infrastructure development and mining projects fuel demand.
- Technological Advancements: Electric-driven models, automation, and advanced materials enhance efficiency and reduce costs.
- Favorable Government Policies: Investments in infrastructure and mining sectors stimulate market growth.
These drivers create opportunities for growth and innovation within the cone crusher market.
Challenges in the Cone Crushers Industry Sector
The industry faces challenges including:
- Fluctuating Raw Material Prices: Impacts production costs and profitability.
- Stringent Environmental Regulations: Compliance costs and limitations on emissions.
- Intense Competition: Pressure on pricing and margins.
These challenges necessitate strategic adaptation and innovation for sustained success.
Leading Players in the Cone Crushers Industry Market
- Metso Corporation
- Keestrack NV
- McCloskey International Limited
- Astec Industries Inc
- Thyssenkrupp AG
- Puzzolana Machinery Fabricators LLP
- Tesab Engineering Ltd
- SANDVIK AB
- WESTPRO Machinery Inc
- FLSmidth & Co A/S
- Terex Corporation
Key Developments in Cone Crushers Industry Sector
- April 2022: FLSmidth secured a DKK 270 Million order for equipment including Raptor Cone Crushers for Sabina Gold & Silver Corp.'s Goose gold mine. This highlights the demand for cone crushers in large-scale mining projects.
- March 2022: Sandvik launched its UK373 wheeled cone crusher and CH440 cone crusher, showcasing advancements in electrically-driven solutions and high-capacity crushing technology. These launches reflect the industry's focus on efficiency and high-volume applications.
Strategic Cone Crushers Industry Market Outlook
The future of the cone crushers industry is promising, with continued growth expected across various segments. Strategic opportunities exist in developing sustainable, highly efficient, and automated crushing solutions. Focus on emerging markets and technological advancements will be key for companies seeking to capitalize on the expanding market potential. The increasing demand for aggregates coupled with advancements in technology will ensure a positive trajectory for the cone crushers industry in the coming years.
Cone Crushers Industry Segmentation
-
1. Type
- 1.1. Symons
- 1.2. Hydraulics
- 1.3. Gyratory
- 1.4. Other Types
-
2. Offering
- 2.1. Mobile Crushers
- 2.2. Portable Crushers
- 2.3. Stationary Crushers
-
3. Power Source
- 3.1. Electric Connection
- 3.2. Diesel Connection
- 3.3. Dual Connection
-
4. End-user Application
- 4.1. Mining and Metallurgy
- 4.2. Construction
- 4.3. Aggregate Processing
- 4.4. Demolition
- 4.5. Other End-user Applications
Cone Crushers Industry Segmentation By Geography
-
1. North America
- 1.1. United States
- 1.2. Canada
-
2. Europe
- 2.1. United Kingdom
- 2.2. Germany
- 2.3. France
- 2.4. Rest of Europe
-
3. Asia Pacific
- 3.1. India
- 3.2. China
- 3.3. Japan
- 3.4. Rest of Asia Pacific
-
4. Latin America
- 4.1. Brazil
- 4.2. Argentina
- 4.3. Mexico
- 4.4. Rest of Latin America
-
5. Middle East and Africa
- 5.1. United Arab Emirates
- 5.2. Saudi Arabia
- 5.3. South Africa
- 5.4. Rest of Middle East and Africa
Cone Crushers Industry REPORT HIGHLIGHTS
| Aspects | Details |
|---|---|
| Study Period | 2019-2033 |
| Base Year | 2024 |
| Estimated Year | 2025 |
| Forecast Period | 2025-2033 |
| Historical Period | 2019-2024 |
| Growth Rate | CAGR of 5.10% from 2019-2033 |
| Segmentation |
|
Table of Contents
- 1. Introduction
- 1.1. Research Scope
- 1.2. Market Segmentation
- 1.3. Research Methodology
- 1.4. Definitions and Assumptions
- 2. Executive Summary
- 2.1. Introduction
- 3. Market Dynamics
- 3.1. Introduction
- 3.2. Market Drivers
- 3.2.1. Increased Demand in the Mining Sector in the Emerging Market; Growth of the Construction Industry
- 3.3. Market Restrains
- 3.3.1. Effects of Carbon Emission from Machinery
- 3.4. Market Trends
- 3.4.1. The Construction Segment is Expected to Hold a Major Market Share
- 4. Market Factor Analysis
- 4.1. Porters Five Forces
- 4.2. Supply/Value Chain
- 4.3. PESTEL analysis
- 4.4. Market Entropy
- 4.5. Patent/Trademark Analysis
- 5. Global Cone Crushers Industry Analysis, Insights and Forecast, 2019-2031
- 5.1. Market Analysis, Insights and Forecast - by Type
- 5.1.1. Symons
- 5.1.2. Hydraulics
- 5.1.3. Gyratory
- 5.1.4. Other Types
- 5.2. Market Analysis, Insights and Forecast - by Offering
- 5.2.1. Mobile Crushers
- 5.2.2. Portable Crushers
- 5.2.3. Stationary Crushers
- 5.3. Market Analysis, Insights and Forecast - by Power Source
- 5.3.1. Electric Connection
- 5.3.2. Diesel Connection
- 5.3.3. Dual Connection
- 5.4. Market Analysis, Insights and Forecast - by End-user Application
- 5.4.1. Mining and Metallurgy
- 5.4.2. Construction
- 5.4.3. Aggregate Processing
- 5.4.4. Demolition
- 5.4.5. Other End-user Applications
- 5.5. Market Analysis, Insights and Forecast - by Region
- 5.5.1. North America
- 5.5.2. Europe
- 5.5.3. Asia Pacific
- 5.5.4. Latin America
- 5.5.5. Middle East and Africa
- 5.1. Market Analysis, Insights and Forecast - by Type
- 6. North America Cone Crushers Industry Analysis, Insights and Forecast, 2019-2031
- 6.1. Market Analysis, Insights and Forecast - by Type
- 6.1.1. Symons
- 6.1.2. Hydraulics
- 6.1.3. Gyratory
- 6.1.4. Other Types
- 6.2. Market Analysis, Insights and Forecast - by Offering
- 6.2.1. Mobile Crushers
- 6.2.2. Portable Crushers
- 6.2.3. Stationary Crushers
- 6.3. Market Analysis, Insights and Forecast - by Power Source
- 6.3.1. Electric Connection
- 6.3.2. Diesel Connection
- 6.3.3. Dual Connection
- 6.4. Market Analysis, Insights and Forecast - by End-user Application
- 6.4.1. Mining and Metallurgy
- 6.4.2. Construction
- 6.4.3. Aggregate Processing
- 6.4.4. Demolition
- 6.4.5. Other End-user Applications
- 6.1. Market Analysis, Insights and Forecast - by Type
- 7. Europe Cone Crushers Industry Analysis, Insights and Forecast, 2019-2031
- 7.1. Market Analysis, Insights and Forecast - by Type
- 7.1.1. Symons
- 7.1.2. Hydraulics
- 7.1.3. Gyratory
- 7.1.4. Other Types
- 7.2. Market Analysis, Insights and Forecast - by Offering
- 7.2.1. Mobile Crushers
- 7.2.2. Portable Crushers
- 7.2.3. Stationary Crushers
- 7.3. Market Analysis, Insights and Forecast - by Power Source
- 7.3.1. Electric Connection
- 7.3.2. Diesel Connection
- 7.3.3. Dual Connection
- 7.4. Market Analysis, Insights and Forecast - by End-user Application
- 7.4.1. Mining and Metallurgy
- 7.4.2. Construction
- 7.4.3. Aggregate Processing
- 7.4.4. Demolition
- 7.4.5. Other End-user Applications
- 7.1. Market Analysis, Insights and Forecast - by Type
- 8. Asia Pacific Cone Crushers Industry Analysis, Insights and Forecast, 2019-2031
- 8.1. Market Analysis, Insights and Forecast - by Type
- 8.1.1. Symons
- 8.1.2. Hydraulics
- 8.1.3. Gyratory
- 8.1.4. Other Types
- 8.2. Market Analysis, Insights and Forecast - by Offering
- 8.2.1. Mobile Crushers
- 8.2.2. Portable Crushers
- 8.2.3. Stationary Crushers
- 8.3. Market Analysis, Insights and Forecast - by Power Source
- 8.3.1. Electric Connection
- 8.3.2. Diesel Connection
- 8.3.3. Dual Connection
- 8.4. Market Analysis, Insights and Forecast - by End-user Application
- 8.4.1. Mining and Metallurgy
- 8.4.2. Construction
- 8.4.3. Aggregate Processing
- 8.4.4. Demolition
- 8.4.5. Other End-user Applications
- 8.1. Market Analysis, Insights and Forecast - by Type
- 9. Latin America Cone Crushers Industry Analysis, Insights and Forecast, 2019-2031
- 9.1. Market Analysis, Insights and Forecast - by Type
- 9.1.1. Symons
- 9.1.2. Hydraulics
- 9.1.3. Gyratory
- 9.1.4. Other Types
- 9.2. Market Analysis, Insights and Forecast - by Offering
- 9.2.1. Mobile Crushers
- 9.2.2. Portable Crushers
- 9.2.3. Stationary Crushers
- 9.3. Market Analysis, Insights and Forecast - by Power Source
- 9.3.1. Electric Connection
- 9.3.2. Diesel Connection
- 9.3.3. Dual Connection
- 9.4. Market Analysis, Insights and Forecast - by End-user Application
- 9.4.1. Mining and Metallurgy
- 9.4.2. Construction
- 9.4.3. Aggregate Processing
- 9.4.4. Demolition
- 9.4.5. Other End-user Applications
- 9.1. Market Analysis, Insights and Forecast - by Type
- 10. Middle East and Africa Cone Crushers Industry Analysis, Insights and Forecast, 2019-2031
- 10.1. Market Analysis, Insights and Forecast - by Type
- 10.1.1. Symons
- 10.1.2. Hydraulics
- 10.1.3. Gyratory
- 10.1.4. Other Types
- 10.2. Market Analysis, Insights and Forecast - by Offering
- 10.2.1. Mobile Crushers
- 10.2.2. Portable Crushers
- 10.2.3. Stationary Crushers
- 10.3. Market Analysis, Insights and Forecast - by Power Source
- 10.3.1. Electric Connection
- 10.3.2. Diesel Connection
- 10.3.3. Dual Connection
- 10.4. Market Analysis, Insights and Forecast - by End-user Application
- 10.4.1. Mining and Metallurgy
- 10.4.2. Construction
- 10.4.3. Aggregate Processing
- 10.4.4. Demolition
- 10.4.5. Other End-user Applications
- 10.1. Market Analysis, Insights and Forecast - by Type
- 11. North America Cone Crushers Industry Analysis, Insights and Forecast, 2019-2031
- 11.1. Market Analysis, Insights and Forecast - By Country/Sub-region
- 11.1.1 United States
- 11.1.2 Canada
- 12. Europe Cone Crushers Industry Analysis, Insights and Forecast, 2019-2031
- 12.1. Market Analysis, Insights and Forecast - By Country/Sub-region
- 12.1.1 United Kingdom
- 12.1.2 Germany
- 12.1.3 France
- 12.1.4 Rest of Europe
- 13. Asia Pacific Cone Crushers Industry Analysis, Insights and Forecast, 2019-2031
- 13.1. Market Analysis, Insights and Forecast - By Country/Sub-region
- 13.1.1 India
- 13.1.2 China
- 13.1.3 Japan
- 13.1.4 Rest of Asia Pacific
- 14. Latin America Cone Crushers Industry Analysis, Insights and Forecast, 2019-2031
- 14.1. Market Analysis, Insights and Forecast - By Country/Sub-region
- 14.1.1 Brazil
- 14.1.2 Argentina
- 14.1.3 Mexico
- 14.1.4 Rest of Latin America
- 15. Middle East and Africa Cone Crushers Industry Analysis, Insights and Forecast, 2019-2031
- 15.1. Market Analysis, Insights and Forecast - By Country/Sub-region
- 15.1.1 United Arab Emirates
- 15.1.2 Saudi Arabia
- 15.1.3 South Africa
- 15.1.4 Rest of Middle East and Africa
- 16. Competitive Analysis
- 16.1. Global Market Share Analysis 2024
- 16.2. Company Profiles
- 16.2.1 Metso Corporation
- 16.2.1.1. Overview
- 16.2.1.2. Products
- 16.2.1.3. SWOT Analysis
- 16.2.1.4. Recent Developments
- 16.2.1.5. Financials (Based on Availability)
- 16.2.2 Keestrack NV
- 16.2.2.1. Overview
- 16.2.2.2. Products
- 16.2.2.3. SWOT Analysis
- 16.2.2.4. Recent Developments
- 16.2.2.5. Financials (Based on Availability)
- 16.2.3 McCloskey International Limited
- 16.2.3.1. Overview
- 16.2.3.2. Products
- 16.2.3.3. SWOT Analysis
- 16.2.3.4. Recent Developments
- 16.2.3.5. Financials (Based on Availability)
- 16.2.4 Astec Industries Inc
- 16.2.4.1. Overview
- 16.2.4.2. Products
- 16.2.4.3. SWOT Analysis
- 16.2.4.4. Recent Developments
- 16.2.4.5. Financials (Based on Availability)
- 16.2.5 Thyssenkrupp AG
- 16.2.5.1. Overview
- 16.2.5.2. Products
- 16.2.5.3. SWOT Analysis
- 16.2.5.4. Recent Developments
- 16.2.5.5. Financials (Based on Availability)
- 16.2.6 Puzzolana Machinery Fabricators LLP
- 16.2.6.1. Overview
- 16.2.6.2. Products
- 16.2.6.3. SWOT Analysis
- 16.2.6.4. Recent Developments
- 16.2.6.5. Financials (Based on Availability)
- 16.2.7 Tesab Engineering Ltd*List Not Exhaustive
- 16.2.7.1. Overview
- 16.2.7.2. Products
- 16.2.7.3. SWOT Analysis
- 16.2.7.4. Recent Developments
- 16.2.7.5. Financials (Based on Availability)
- 16.2.8 SANDVIK AB
- 16.2.8.1. Overview
- 16.2.8.2. Products
- 16.2.8.3. SWOT Analysis
- 16.2.8.4. Recent Developments
- 16.2.8.5. Financials (Based on Availability)
- 16.2.9 WESTPRO Machinery Inc
- 16.2.9.1. Overview
- 16.2.9.2. Products
- 16.2.9.3. SWOT Analysis
- 16.2.9.4. Recent Developments
- 16.2.9.5. Financials (Based on Availability)
- 16.2.10 FLSmidth & Co A/S
- 16.2.10.1. Overview
- 16.2.10.2. Products
- 16.2.10.3. SWOT Analysis
- 16.2.10.4. Recent Developments
- 16.2.10.5. Financials (Based on Availability)
- 16.2.11 Terex Corporation
- 16.2.11.1. Overview
- 16.2.11.2. Products
- 16.2.11.3. SWOT Analysis
- 16.2.11.4. Recent Developments
- 16.2.11.5. Financials (Based on Availability)
- 16.2.1 Metso Corporation
List of Figures
- Figure 1: Global Cone Crushers Industry Revenue Breakdown (Million, %) by Region 2024 & 2032
- Figure 2: North America Cone Crushers Industry Revenue (Million), by Country 2024 & 2032
- Figure 3: North America Cone Crushers Industry Revenue Share (%), by Country 2024 & 2032
- Figure 4: Europe Cone Crushers Industry Revenue (Million), by Country 2024 & 2032
- Figure 5: Europe Cone Crushers Industry Revenue Share (%), by Country 2024 & 2032
- Figure 6: Asia Pacific Cone Crushers Industry Revenue (Million), by Country 2024 & 2032
- Figure 7: Asia Pacific Cone Crushers Industry Revenue Share (%), by Country 2024 & 2032
- Figure 8: Latin America Cone Crushers Industry Revenue (Million), by Country 2024 & 2032
- Figure 9: Latin America Cone Crushers Industry Revenue Share (%), by Country 2024 & 2032
- Figure 10: Middle East and Africa Cone Crushers Industry Revenue (Million), by Country 2024 & 2032
- Figure 11: Middle East and Africa Cone Crushers Industry Revenue Share (%), by Country 2024 & 2032
- Figure 12: North America Cone Crushers Industry Revenue (Million), by Type 2024 & 2032
- Figure 13: North America Cone Crushers Industry Revenue Share (%), by Type 2024 & 2032
- Figure 14: North America Cone Crushers Industry Revenue (Million), by Offering 2024 & 2032
- Figure 15: North America Cone Crushers Industry Revenue Share (%), by Offering 2024 & 2032
- Figure 16: North America Cone Crushers Industry Revenue (Million), by Power Source 2024 & 2032
- Figure 17: North America Cone Crushers Industry Revenue Share (%), by Power Source 2024 & 2032
- Figure 18: North America Cone Crushers Industry Revenue (Million), by End-user Application 2024 & 2032
- Figure 19: North America Cone Crushers Industry Revenue Share (%), by End-user Application 2024 & 2032
- Figure 20: North America Cone Crushers Industry Revenue (Million), by Country 2024 & 2032
- Figure 21: North America Cone Crushers Industry Revenue Share (%), by Country 2024 & 2032
- Figure 22: Europe Cone Crushers Industry Revenue (Million), by Type 2024 & 2032
- Figure 23: Europe Cone Crushers Industry Revenue Share (%), by Type 2024 & 2032
- Figure 24: Europe Cone Crushers Industry Revenue (Million), by Offering 2024 & 2032
- Figure 25: Europe Cone Crushers Industry Revenue Share (%), by Offering 2024 & 2032
- Figure 26: Europe Cone Crushers Industry Revenue (Million), by Power Source 2024 & 2032
- Figure 27: Europe Cone Crushers Industry Revenue Share (%), by Power Source 2024 & 2032
- Figure 28: Europe Cone Crushers Industry Revenue (Million), by End-user Application 2024 & 2032
- Figure 29: Europe Cone Crushers Industry Revenue Share (%), by End-user Application 2024 & 2032
- Figure 30: Europe Cone Crushers Industry Revenue (Million), by Country 2024 & 2032
- Figure 31: Europe Cone Crushers Industry Revenue Share (%), by Country 2024 & 2032
- Figure 32: Asia Pacific Cone Crushers Industry Revenue (Million), by Type 2024 & 2032
- Figure 33: Asia Pacific Cone Crushers Industry Revenue Share (%), by Type 2024 & 2032
- Figure 34: Asia Pacific Cone Crushers Industry Revenue (Million), by Offering 2024 & 2032
- Figure 35: Asia Pacific Cone Crushers Industry Revenue Share (%), by Offering 2024 & 2032
- Figure 36: Asia Pacific Cone Crushers Industry Revenue (Million), by Power Source 2024 & 2032
- Figure 37: Asia Pacific Cone Crushers Industry Revenue Share (%), by Power Source 2024 & 2032
- Figure 38: Asia Pacific Cone Crushers Industry Revenue (Million), by End-user Application 2024 & 2032
- Figure 39: Asia Pacific Cone Crushers Industry Revenue Share (%), by End-user Application 2024 & 2032
- Figure 40: Asia Pacific Cone Crushers Industry Revenue (Million), by Country 2024 & 2032
- Figure 41: Asia Pacific Cone Crushers Industry Revenue Share (%), by Country 2024 & 2032
- Figure 42: Latin America Cone Crushers Industry Revenue (Million), by Type 2024 & 2032
- Figure 43: Latin America Cone Crushers Industry Revenue Share (%), by Type 2024 & 2032
- Figure 44: Latin America Cone Crushers Industry Revenue (Million), by Offering 2024 & 2032
- Figure 45: Latin America Cone Crushers Industry Revenue Share (%), by Offering 2024 & 2032
- Figure 46: Latin America Cone Crushers Industry Revenue (Million), by Power Source 2024 & 2032
- Figure 47: Latin America Cone Crushers Industry Revenue Share (%), by Power Source 2024 & 2032
- Figure 48: Latin America Cone Crushers Industry Revenue (Million), by End-user Application 2024 & 2032
- Figure 49: Latin America Cone Crushers Industry Revenue Share (%), by End-user Application 2024 & 2032
- Figure 50: Latin America Cone Crushers Industry Revenue (Million), by Country 2024 & 2032
- Figure 51: Latin America Cone Crushers Industry Revenue Share (%), by Country 2024 & 2032
- Figure 52: Middle East and Africa Cone Crushers Industry Revenue (Million), by Type 2024 & 2032
- Figure 53: Middle East and Africa Cone Crushers Industry Revenue Share (%), by Type 2024 & 2032
- Figure 54: Middle East and Africa Cone Crushers Industry Revenue (Million), by Offering 2024 & 2032
- Figure 55: Middle East and Africa Cone Crushers Industry Revenue Share (%), by Offering 2024 & 2032
- Figure 56: Middle East and Africa Cone Crushers Industry Revenue (Million), by Power Source 2024 & 2032
- Figure 57: Middle East and Africa Cone Crushers Industry Revenue Share (%), by Power Source 2024 & 2032
- Figure 58: Middle East and Africa Cone Crushers Industry Revenue (Million), by End-user Application 2024 & 2032
- Figure 59: Middle East and Africa Cone Crushers Industry Revenue Share (%), by End-user Application 2024 & 2032
- Figure 60: Middle East and Africa Cone Crushers Industry Revenue (Million), by Country 2024 & 2032
- Figure 61: Middle East and Africa Cone Crushers Industry Revenue Share (%), by Country 2024 & 2032
List of Tables
- Table 1: Global Cone Crushers Industry Revenue Million Forecast, by Region 2019 & 2032
- Table 2: Global Cone Crushers Industry Revenue Million Forecast, by Type 2019 & 2032
- Table 3: Global Cone Crushers Industry Revenue Million Forecast, by Offering 2019 & 2032
- Table 4: Global Cone Crushers Industry Revenue Million Forecast, by Power Source 2019 & 2032
- Table 5: Global Cone Crushers Industry Revenue Million Forecast, by End-user Application 2019 & 2032
- Table 6: Global Cone Crushers Industry Revenue Million Forecast, by Region 2019 & 2032
- Table 7: Global Cone Crushers Industry Revenue Million Forecast, by Country 2019 & 2032
- Table 8: United States Cone Crushers Industry Revenue (Million) Forecast, by Application 2019 & 2032
- Table 9: Canada Cone Crushers Industry Revenue (Million) Forecast, by Application 2019 & 2032
- Table 10: Global Cone Crushers Industry Revenue Million Forecast, by Country 2019 & 2032
- Table 11: United Kingdom Cone Crushers Industry Revenue (Million) Forecast, by Application 2019 & 2032
- Table 12: Germany Cone Crushers Industry Revenue (Million) Forecast, by Application 2019 & 2032
- Table 13: France Cone Crushers Industry Revenue (Million) Forecast, by Application 2019 & 2032
- Table 14: Rest of Europe Cone Crushers Industry Revenue (Million) Forecast, by Application 2019 & 2032
- Table 15: Global Cone Crushers Industry Revenue Million Forecast, by Country 2019 & 2032
- Table 16: India Cone Crushers Industry Revenue (Million) Forecast, by Application 2019 & 2032
- Table 17: China Cone Crushers Industry Revenue (Million) Forecast, by Application 2019 & 2032
- Table 18: Japan Cone Crushers Industry Revenue (Million) Forecast, by Application 2019 & 2032
- Table 19: Rest of Asia Pacific Cone Crushers Industry Revenue (Million) Forecast, by Application 2019 & 2032
- Table 20: Global Cone Crushers Industry Revenue Million Forecast, by Country 2019 & 2032
- Table 21: Brazil Cone Crushers Industry Revenue (Million) Forecast, by Application 2019 & 2032
- Table 22: Argentina Cone Crushers Industry Revenue (Million) Forecast, by Application 2019 & 2032
- Table 23: Mexico Cone Crushers Industry Revenue (Million) Forecast, by Application 2019 & 2032
- Table 24: Rest of Latin America Cone Crushers Industry Revenue (Million) Forecast, by Application 2019 & 2032
- Table 25: Global Cone Crushers Industry Revenue Million Forecast, by Country 2019 & 2032
- Table 26: United Arab Emirates Cone Crushers Industry Revenue (Million) Forecast, by Application 2019 & 2032
- Table 27: Saudi Arabia Cone Crushers Industry Revenue (Million) Forecast, by Application 2019 & 2032
- Table 28: South Africa Cone Crushers Industry Revenue (Million) Forecast, by Application 2019 & 2032
- Table 29: Rest of Middle East and Africa Cone Crushers Industry Revenue (Million) Forecast, by Application 2019 & 2032
- Table 30: Global Cone Crushers Industry Revenue Million Forecast, by Type 2019 & 2032
- Table 31: Global Cone Crushers Industry Revenue Million Forecast, by Offering 2019 & 2032
- Table 32: Global Cone Crushers Industry Revenue Million Forecast, by Power Source 2019 & 2032
- Table 33: Global Cone Crushers Industry Revenue Million Forecast, by End-user Application 2019 & 2032
- Table 34: Global Cone Crushers Industry Revenue Million Forecast, by Country 2019 & 2032
- Table 35: United States Cone Crushers Industry Revenue (Million) Forecast, by Application 2019 & 2032
- Table 36: Canada Cone Crushers Industry Revenue (Million) Forecast, by Application 2019 & 2032
- Table 37: Global Cone Crushers Industry Revenue Million Forecast, by Type 2019 & 2032
- Table 38: Global Cone Crushers Industry Revenue Million Forecast, by Offering 2019 & 2032
- Table 39: Global Cone Crushers Industry Revenue Million Forecast, by Power Source 2019 & 2032
- Table 40: Global Cone Crushers Industry Revenue Million Forecast, by End-user Application 2019 & 2032
- Table 41: Global Cone Crushers Industry Revenue Million Forecast, by Country 2019 & 2032
- Table 42: United Kingdom Cone Crushers Industry Revenue (Million) Forecast, by Application 2019 & 2032
- Table 43: Germany Cone Crushers Industry Revenue (Million) Forecast, by Application 2019 & 2032
- Table 44: France Cone Crushers Industry Revenue (Million) Forecast, by Application 2019 & 2032
- Table 45: Rest of Europe Cone Crushers Industry Revenue (Million) Forecast, by Application 2019 & 2032
- Table 46: Global Cone Crushers Industry Revenue Million Forecast, by Type 2019 & 2032
- Table 47: Global Cone Crushers Industry Revenue Million Forecast, by Offering 2019 & 2032
- Table 48: Global Cone Crushers Industry Revenue Million Forecast, by Power Source 2019 & 2032
- Table 49: Global Cone Crushers Industry Revenue Million Forecast, by End-user Application 2019 & 2032
- Table 50: Global Cone Crushers Industry Revenue Million Forecast, by Country 2019 & 2032
- Table 51: India Cone Crushers Industry Revenue (Million) Forecast, by Application 2019 & 2032
- Table 52: China Cone Crushers Industry Revenue (Million) Forecast, by Application 2019 & 2032
- Table 53: Japan Cone Crushers Industry Revenue (Million) Forecast, by Application 2019 & 2032
- Table 54: Rest of Asia Pacific Cone Crushers Industry Revenue (Million) Forecast, by Application 2019 & 2032
- Table 55: Global Cone Crushers Industry Revenue Million Forecast, by Type 2019 & 2032
- Table 56: Global Cone Crushers Industry Revenue Million Forecast, by Offering 2019 & 2032
- Table 57: Global Cone Crushers Industry Revenue Million Forecast, by Power Source 2019 & 2032
- Table 58: Global Cone Crushers Industry Revenue Million Forecast, by End-user Application 2019 & 2032
- Table 59: Global Cone Crushers Industry Revenue Million Forecast, by Country 2019 & 2032
- Table 60: Brazil Cone Crushers Industry Revenue (Million) Forecast, by Application 2019 & 2032
- Table 61: Argentina Cone Crushers Industry Revenue (Million) Forecast, by Application 2019 & 2032
- Table 62: Mexico Cone Crushers Industry Revenue (Million) Forecast, by Application 2019 & 2032
- Table 63: Rest of Latin America Cone Crushers Industry Revenue (Million) Forecast, by Application 2019 & 2032
- Table 64: Global Cone Crushers Industry Revenue Million Forecast, by Type 2019 & 2032
- Table 65: Global Cone Crushers Industry Revenue Million Forecast, by Offering 2019 & 2032
- Table 66: Global Cone Crushers Industry Revenue Million Forecast, by Power Source 2019 & 2032
- Table 67: Global Cone Crushers Industry Revenue Million Forecast, by End-user Application 2019 & 2032
- Table 68: Global Cone Crushers Industry Revenue Million Forecast, by Country 2019 & 2032
- Table 69: United Arab Emirates Cone Crushers Industry Revenue (Million) Forecast, by Application 2019 & 2032
- Table 70: Saudi Arabia Cone Crushers Industry Revenue (Million) Forecast, by Application 2019 & 2032
- Table 71: South Africa Cone Crushers Industry Revenue (Million) Forecast, by Application 2019 & 2032
- Table 72: Rest of Middle East and Africa Cone Crushers Industry Revenue (Million) Forecast, by Application 2019 & 2032
Frequently Asked Questions
1. What is the projected Compound Annual Growth Rate (CAGR) of the Cone Crushers Industry?
The projected CAGR is approximately 5.10%.
2. Which companies are prominent players in the Cone Crushers Industry?
Key companies in the market include Metso Corporation, Keestrack NV, McCloskey International Limited, Astec Industries Inc, Thyssenkrupp AG, Puzzolana Machinery Fabricators LLP, Tesab Engineering Ltd*List Not Exhaustive, SANDVIK AB, WESTPRO Machinery Inc, FLSmidth & Co A/S, Terex Corporation.
3. What are the main segments of the Cone Crushers Industry?
The market segments include Type, Offering, Power Source, End-user Application.
4. Can you provide details about the market size?
The market size is estimated to be USD 1.86 Million as of 2022.
5. What are some drivers contributing to market growth?
Increased Demand in the Mining Sector in the Emerging Market; Growth of the Construction Industry.
6. What are the notable trends driving market growth?
The Construction Segment is Expected to Hold a Major Market Share.
7. Are there any restraints impacting market growth?
Effects of Carbon Emission from Machinery.
8. Can you provide examples of recent developments in the market?
April 2022 - FLSmidth was chosen to provide complete equipment and processing flowsheet, including ore leaching, for Sabina Gold & Silver Corp.'s Goose gold mine in Nunavut, Canada. The order is valued at DKK 270 million and was booked in Q2 2022. The equipment would be delivered in mid-2023, ahead of the mine start-up date in Q1 2025. FLSmidth would supply the jaw crusher, Raptor Cone Crushers, ball mill, VXP-Stirred Mill (secondary grinding), KREBS cyclones, pumps, screens, feeders, and Knelson gravity concentrators. The order also comprises equipment for pre-oxidation and leaching; carbon in pulp (CIP) extraction; absorption, desorption, and refining (ADR); and detoxification.
9. What pricing options are available for accessing the report?
Pricing options include single-user, multi-user, and enterprise licenses priced at USD 4750, USD 5250, and USD 8750 respectively.
10. Is the market size provided in terms of value or volume?
The market size is provided in terms of value, measured in Million.
11. Are there any specific market keywords associated with the report?
Yes, the market keyword associated with the report is "Cone Crushers Industry," which aids in identifying and referencing the specific market segment covered.
12. How do I determine which pricing option suits my needs best?
The pricing options vary based on user requirements and access needs. Individual users may opt for single-user licenses, while businesses requiring broader access may choose multi-user or enterprise licenses for cost-effective access to the report.
13. Are there any additional resources or data provided in the Cone Crushers Industry report?
While the report offers comprehensive insights, it's advisable to review the specific contents or supplementary materials provided to ascertain if additional resources or data are available.
14. How can I stay updated on further developments or reports in the Cone Crushers Industry?
To stay informed about further developments, trends, and reports in the Cone Crushers Industry, consider subscribing to industry newsletters, following relevant companies and organizations, or regularly checking reputable industry news sources and publications.
Methodology
Step 1 - Identification of Relevant Samples Size from Population Database


Step 2 - Approaches for Defining Global Market Size (Value, Volume* & Price*)

Note*: In applicable scenarios
Step 3 - Data Sources
Primary Research
- Web Analytics
- Survey Reports
- Research Institute
- Latest Research Reports
- Opinion Leaders
Secondary Research
- Annual Reports
- White Paper
- Latest Press Release
- Industry Association
- Paid Database
- Investor Presentations

Step 4 - Data Triangulation
Involves using different sources of information in order to increase the validity of a study
These sources are likely to be stakeholders in a program - participants, other researchers, program staff, other community members, and so on.
Then we put all data in single framework & apply various statistical tools to find out the dynamic on the market.
During the analysis stage, feedback from the stakeholder groups would be compared to determine areas of agreement as well as areas of divergence


