
Key Insights
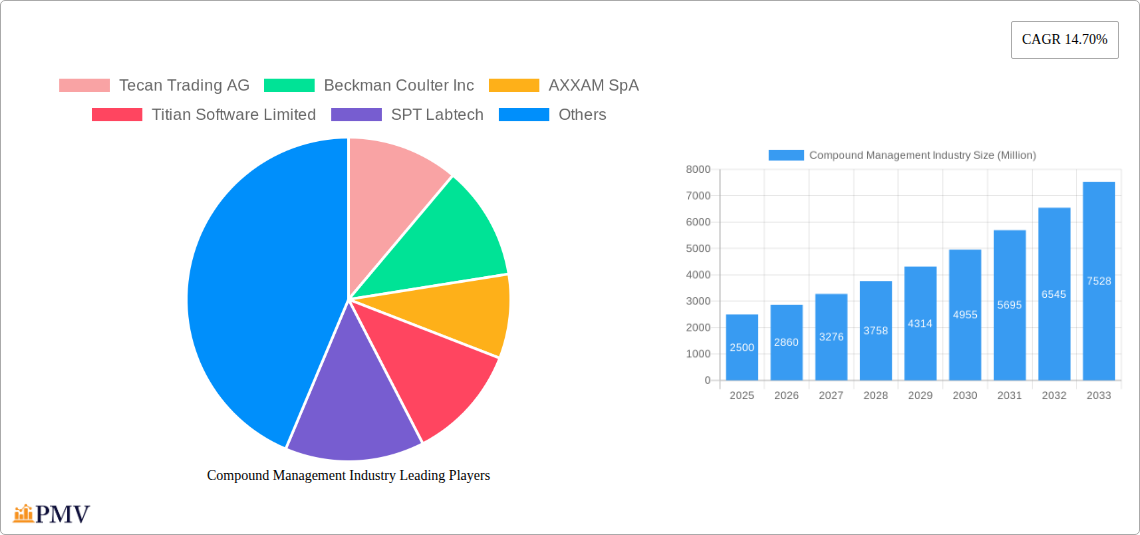
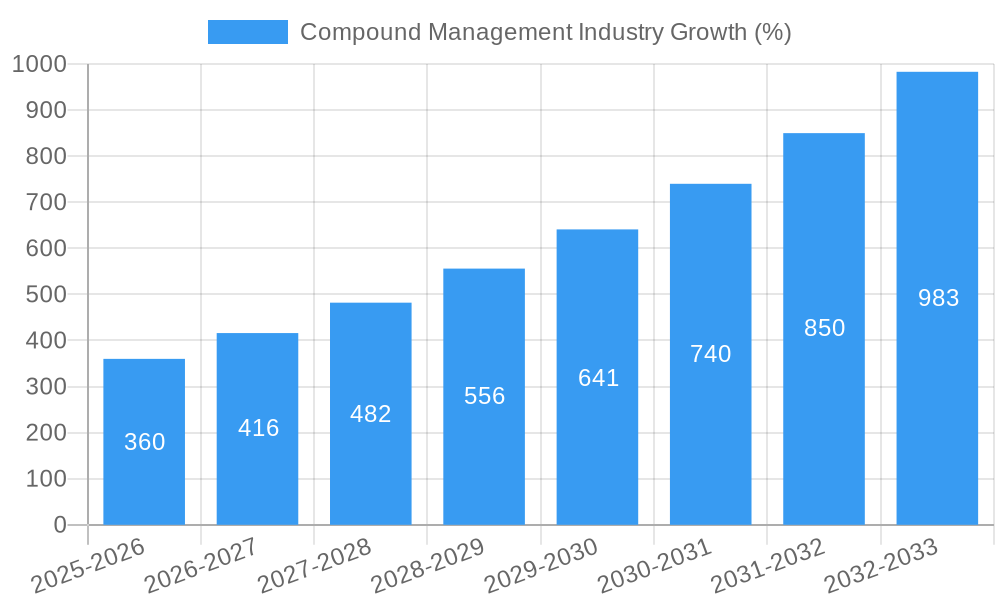
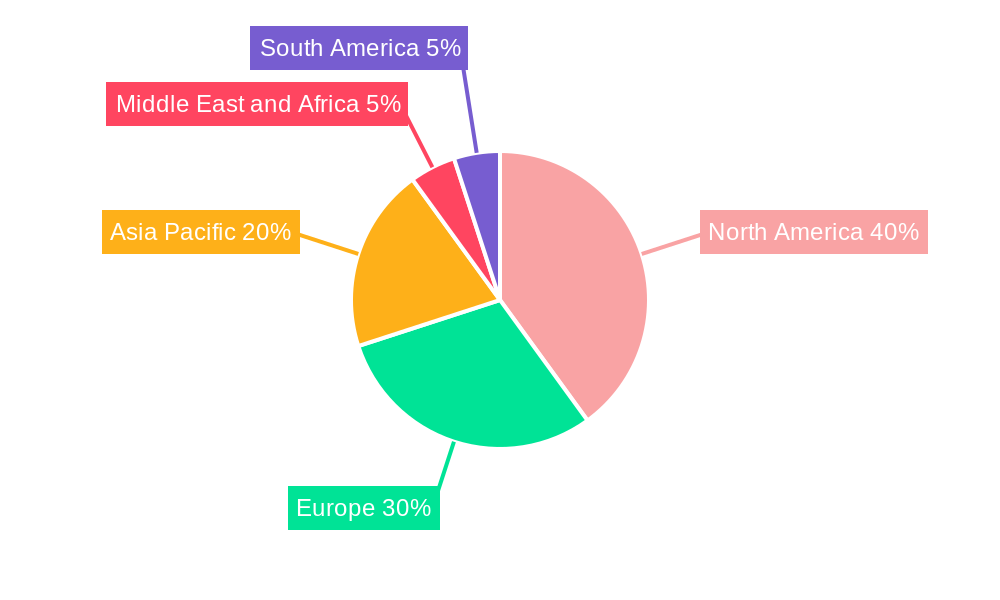
The compound management industry is experiencing robust growth, driven by the escalating demand for efficient drug discovery and development processes within the pharmaceutical and biotechnology sectors. A 14.70% CAGR indicates a significant expansion, projected to reach a substantial market value. This growth is fueled by several key factors: the increasing prevalence of chronic diseases necessitating novel therapeutic solutions, advances in high-throughput screening technologies enabling faster compound evaluation, and the rising adoption of automation and artificial intelligence in drug discovery workflows. The market is segmented by service (including storage and management), sample type (chemical compounds and bio-samples), application (drug discovery, gene synthesis, biobanking), and product type. The North American market currently holds a dominant position, benefiting from advanced research infrastructure and substantial investments in pharmaceutical R&D. However, the Asia-Pacific region demonstrates significant growth potential due to expanding pharmaceutical industries and increasing government support for research and development initiatives. Competition within the industry is intense, with established players like Tecan, Beckman Coulter, and Hamilton Company vying for market share alongside emerging specialized firms.
The industry faces certain restraints, including high initial investment costs for advanced equipment and software, stringent regulatory compliance requirements, and the inherent complexities associated with managing diverse compound libraries. However, the long-term prospects remain positive, driven by continuous technological innovation, the development of novel therapeutic modalities (e.g., gene therapies), and the expanding need for personalized medicine. Future growth will depend on strategic partnerships, acquisitions, and the continued development of robust and scalable compound management solutions that can effectively address the challenges of handling increasingly complex and diverse compound libraries. The integration of advanced data analytics and AI will play a critical role in enhancing the efficiency and effectiveness of compound management operations in the coming years.
Compound Management Industry Market Report: 2019-2033
This comprehensive report provides a detailed analysis of the Compound Management industry, offering actionable insights for stakeholders across the value chain. With a study period spanning 2019-2033, a base year of 2025, and a forecast period of 2025-2033, this report covers market size, segmentation, competitive landscape, and key growth drivers. The report analyzes a market valued at xx Million in 2025, projected to reach xx Million by 2033, exhibiting a CAGR of xx% during the forecast period.
Compound Management Industry Market Structure & Competitive Dynamics
The Compound Management industry exhibits a moderately concentrated market structure, with several key players holding significant market share. The top 10 companies, including Tecan Trading AG, Beckman Coulter Inc, AXXAM SpA, Titian Software Limited, SPT Labtech, Evotec, LiCONiC AG, Brooks Life Sciences, Hamilton Company, and BioAscent, collectively account for an estimated xx% of the global market in 2025. However, the market also features numerous smaller players, particularly in niche segments like specialized sample storage and bespoke software solutions.
Innovation ecosystems are crucial, with significant R&D investments driving the development of advanced automation technologies, higher-throughput screening systems, and sophisticated software for data management. Regulatory frameworks, particularly those concerning data security and compliance (e.g., GDPR, HIPAA), significantly influence market dynamics. The industry also faces competition from alternative methods for sample management, albeit limited, and the emergence of new technologies continually alters competitive dynamics.
Mergers and acquisitions (M&A) play a significant role in shaping the industry landscape. For instance, SPT Labtech's acquisition of BioMicroLab in February 2021 demonstrates a strategic move to enhance automation capabilities. The total value of M&A deals in the Compound Management industry between 2019 and 2024 is estimated at xx Million, with an average deal size of xx Million. These activities reflect ongoing consolidation and the pursuit of technological synergy among companies. Future M&A activity is expected to remain robust, driven by the need for scale and technological advancement. End-user trends towards increased automation and data integration further drive these activities.
Compound Management Industry Industry Trends & Insights
The Compound Management industry is experiencing significant growth propelled by several key factors. The increasing demand for drug discovery and development, coupled with advancements in genomics and proteomics, significantly fuels market expansion. The growing adoption of high-throughput screening (HTS) and automation technologies accelerates sample processing and analysis, driving market growth. The shift towards personalized medicine also boosts demand, necessitating robust sample management solutions for individualized therapies.
Technological disruptions, such as the development of advanced robotics, AI-powered data analytics, and cloud-based sample management platforms, are reshaping the industry. These advancements enhance efficiency, improve data management, and reduce operational costs. Consumer preferences are increasingly focused on integrated, user-friendly systems that offer seamless data integration with other laboratory information management systems (LIMS).
The competitive landscape is characterized by intense rivalry among established players and emerging startups. Companies are constantly striving to innovate and differentiate their offerings through advanced features, improved user interfaces, and enhanced data analytics capabilities. This competitive environment pushes the industry towards continuous improvements in quality, efficiency, and affordability, resulting in a faster pace of innovation. The market penetration of automated sample management systems is steadily increasing, currently estimated at xx%, projected to reach xx% by 2033. This substantial increase is driven by the advantages of automation in terms of throughput, accuracy, and reduced human error.
Dominant Markets & Segments in Compound Management Industry
The North American region holds the dominant position in the Compound Management industry, accounting for approximately xx% of the global market in 2025. This dominance is primarily attributed to:
- Robust pharmaceutical and biotechnology industries: A large and well-established presence of pharmaceutical and biotechnology companies fuels high demand for compound management solutions.
- Significant R&D investments: High levels of investment in research and development within the life sciences sector drive the adoption of advanced technologies.
- Favorable regulatory environment: A supportive regulatory framework fosters innovation and the adoption of new technologies.
Within the segments, Drug Discovery is the largest application segment, currently commanding xx% of the market, followed by Biobanking (xx%) and Gene Synthesis (xx%). Chemical Compounds account for the largest share of sample types, driven by the predominance of small molecule drug discovery. Within the product types, the demand for automated sample management systems is significantly higher than manual systems due to increased efficiency and throughput. The service segment experiences growth driven by the need for outsourcing and specialized expertise in handling complex samples.
Compound Management Industry Product Innovations
Recent product innovations emphasize enhanced automation, improved data management, and enhanced user experience. This includes AI-powered systems for predictive maintenance, cloud-based platforms for remote monitoring and management, and robotic systems for automated sample handling and processing. These innovations enable improved accuracy, reduced operational costs, and higher throughput, addressing critical challenges faced by laboratories and research facilities. These innovations are finding rapid market adoption due to their ability to streamline workflows and enhance data quality.
Report Segmentation & Scope
This report segments the Compound Management market based on:
- Other Compounds/Sample Storage Systems: This segment includes a range of storage systems and related services, with growth driven by the need for secure and reliable sample storage. Growth is projected at xx% CAGR from 2025-2033.
- Service: The service segment encompasses various services related to sample management, such as consulting, validation, and maintenance, experiencing a growth projection of xx% CAGR from 2025-2033 due to increasing outsourcing needs.
- Sample Type: The report analyzes Chemical Compounds and Bio Samples, with Chemical Compounds currently holding the larger market share due to the prominence of small molecule drug discovery. Both segments experience a strong growth projection.
- Application: Drug Discovery, Gene Synthesis, Biobanking, and Other Applications are analyzed, with Drug Discovery being the largest segment due to high demand in pharmaceutical R&D. Growth across applications is expected to remain robust.
- Type: This segment differentiates between Product (hardware and software solutions) and Service, with the Product segment being the larger contributor, showing strong growth due to technological advancements and automation.
Each segment's market size, growth projections, and competitive dynamics are comprehensively analyzed within the report.
Key Drivers of Compound Management Industry Growth
The Compound Management industry’s growth is driven by several factors: increasing demand for drug discovery and development, the rise of personalized medicine, advancements in genomics and proteomics, the adoption of high-throughput screening technologies, growing investments in life sciences R&D, and favorable government regulations supporting the industry. Technological advancements such as automation, AI, and cloud computing also play a significant role.
Challenges in the Compound Management Industry Sector
Challenges include high initial investment costs for advanced technologies, complexities in data integration across different systems, regulatory compliance requirements for data security and sample handling, the need for skilled personnel to operate and maintain complex systems, and the potential for supply chain disruptions affecting the availability of critical components. These factors can impact market growth and profitability.
Leading Players in the Compound Management Industry Market
- Tecan Trading AG
- Beckman Coulter Inc
- AXXAM SpA
- Titian Software Limited
- SPT Labtech
- Evotec
- LiCONiC AG
- Brooks Life Sciences
- Hamilton Company
- BioAscent
Key Developments in Compound Management Industry Sector
- February 2021: SPT Labtech acquired BioMicroLab, strengthening its automation capabilities and expanding its market reach. This acquisition signaled a significant consolidation trend within the industry.
- December 2020: Ziath launched Datapaq 3.18 software, enhancing sample management efficiency and compatibility with advanced acoustic dispensers. This development improved speed and accuracy in sample handling.
Strategic Compound Management Industry Market Outlook
The Compound Management industry is poised for continued growth, driven by technological advancements, increasing R&D investments, and the growing need for efficient sample management solutions. Strategic opportunities exist for companies focusing on integrated solutions, AI-powered data analytics, cloud-based platforms, and specialized services catering to niche markets. The increasing focus on personalized medicine and the expansion of the biobanking sector will create further growth potential. The market presents significant opportunities for both established players and emerging startups to innovate and capture market share.
Compound Management Industry Segmentation
-
1. Type
-
1.1. Product
- 1.1.1. Automated Compounds/Sample Storage Systems
- 1.1.2. Automated Liquid Handling Systems
- 1.1.3. Other Compounds/Sample Storage Systems
- 1.2. Service
-
1.1. Product
-
2. Sample Type
- 2.1. Chemical Compounds
- 2.2. Bio Samples
-
3. Application
- 3.1. Drug Discovery
- 3.2. Gene Synthesis
- 3.3. Bio Banking
- 3.4. Other Applications
Compound Management Industry Segmentation By Geography
-
1. North America
- 1.1. United States
- 1.2. Canada
- 1.3. Mexico
-
2. Europe
- 2.1. Germany
- 2.2. United Kingdom
- 2.3. France
- 2.4. Italy
- 2.5. Spain
- 2.6. Rest of Europe
-
3. Asia Pacific
- 3.1. China
- 3.2. Japan
- 3.3. India
- 3.4. Australia
- 3.5. South Korea
- 3.6. Rest of Asia Pacific
-
4. Middle East and Africa
- 4.1. GCC
- 4.2. South Africa
- 4.3. Rest of Middle East and Africa
-
5. South America
- 5.1. Brazil
- 5.2. Argentina
- 5.3. Rest of South America
Compound Management Industry REPORT HIGHLIGHTS
| Aspects | Details |
|---|---|
| Study Period | 2019-2033 |
| Base Year | 2024 |
| Estimated Year | 2025 |
| Forecast Period | 2025-2033 |
| Historical Period | 2019-2024 |
| Growth Rate | CAGR of 14.70% from 2019-2033 |
| Segmentation |
|
Table of Contents
- 1. Introduction
- 1.1. Research Scope
- 1.2. Market Segmentation
- 1.3. Research Methodology
- 1.4. Definitions and Assumptions
- 2. Executive Summary
- 2.1. Introduction
- 3. Market Dynamics
- 3.1. Introduction
- 3.2. Market Drivers
- 3.2.1. Increasing Drug Discovery Activities; Growth in the Bio-pharmaceutical Industry; Technological Advancement and Favorable Reimbursement
- 3.3. Market Restrains
- 3.3.1. High Cost Associated with Compound Management
- 3.4. Market Trends
- 3.4.1. The Automated Storage Systems Segment is Expected to Dominate the Market Over the Forecast Period.
- 4. Market Factor Analysis
- 4.1. Porters Five Forces
- 4.2. Supply/Value Chain
- 4.3. PESTEL analysis
- 4.4. Market Entropy
- 4.5. Patent/Trademark Analysis
- 5. Global Compound Management Industry Analysis, Insights and Forecast, 2019-2031
- 5.1. Market Analysis, Insights and Forecast - by Type
- 5.1.1. Product
- 5.1.1.1. Automated Compounds/Sample Storage Systems
- 5.1.1.2. Automated Liquid Handling Systems
- 5.1.1.3. Other Compounds/Sample Storage Systems
- 5.1.2. Service
- 5.1.1. Product
- 5.2. Market Analysis, Insights and Forecast - by Sample Type
- 5.2.1. Chemical Compounds
- 5.2.2. Bio Samples
- 5.3. Market Analysis, Insights and Forecast - by Application
- 5.3.1. Drug Discovery
- 5.3.2. Gene Synthesis
- 5.3.3. Bio Banking
- 5.3.4. Other Applications
- 5.4. Market Analysis, Insights and Forecast - by Region
- 5.4.1. North America
- 5.4.2. Europe
- 5.4.3. Asia Pacific
- 5.4.4. Middle East and Africa
- 5.4.5. South America
- 5.1. Market Analysis, Insights and Forecast - by Type
- 6. North America Compound Management Industry Analysis, Insights and Forecast, 2019-2031
- 6.1. Market Analysis, Insights and Forecast - by Type
- 6.1.1. Product
- 6.1.1.1. Automated Compounds/Sample Storage Systems
- 6.1.1.2. Automated Liquid Handling Systems
- 6.1.1.3. Other Compounds/Sample Storage Systems
- 6.1.2. Service
- 6.1.1. Product
- 6.2. Market Analysis, Insights and Forecast - by Sample Type
- 6.2.1. Chemical Compounds
- 6.2.2. Bio Samples
- 6.3. Market Analysis, Insights and Forecast - by Application
- 6.3.1. Drug Discovery
- 6.3.2. Gene Synthesis
- 6.3.3. Bio Banking
- 6.3.4. Other Applications
- 6.1. Market Analysis, Insights and Forecast - by Type
- 7. Europe Compound Management Industry Analysis, Insights and Forecast, 2019-2031
- 7.1. Market Analysis, Insights and Forecast - by Type
- 7.1.1. Product
- 7.1.1.1. Automated Compounds/Sample Storage Systems
- 7.1.1.2. Automated Liquid Handling Systems
- 7.1.1.3. Other Compounds/Sample Storage Systems
- 7.1.2. Service
- 7.1.1. Product
- 7.2. Market Analysis, Insights and Forecast - by Sample Type
- 7.2.1. Chemical Compounds
- 7.2.2. Bio Samples
- 7.3. Market Analysis, Insights and Forecast - by Application
- 7.3.1. Drug Discovery
- 7.3.2. Gene Synthesis
- 7.3.3. Bio Banking
- 7.3.4. Other Applications
- 7.1. Market Analysis, Insights and Forecast - by Type
- 8. Asia Pacific Compound Management Industry Analysis, Insights and Forecast, 2019-2031
- 8.1. Market Analysis, Insights and Forecast - by Type
- 8.1.1. Product
- 8.1.1.1. Automated Compounds/Sample Storage Systems
- 8.1.1.2. Automated Liquid Handling Systems
- 8.1.1.3. Other Compounds/Sample Storage Systems
- 8.1.2. Service
- 8.1.1. Product
- 8.2. Market Analysis, Insights and Forecast - by Sample Type
- 8.2.1. Chemical Compounds
- 8.2.2. Bio Samples
- 8.3. Market Analysis, Insights and Forecast - by Application
- 8.3.1. Drug Discovery
- 8.3.2. Gene Synthesis
- 8.3.3. Bio Banking
- 8.3.4. Other Applications
- 8.1. Market Analysis, Insights and Forecast - by Type
- 9. Middle East and Africa Compound Management Industry Analysis, Insights and Forecast, 2019-2031
- 9.1. Market Analysis, Insights and Forecast - by Type
- 9.1.1. Product
- 9.1.1.1. Automated Compounds/Sample Storage Systems
- 9.1.1.2. Automated Liquid Handling Systems
- 9.1.1.3. Other Compounds/Sample Storage Systems
- 9.1.2. Service
- 9.1.1. Product
- 9.2. Market Analysis, Insights and Forecast - by Sample Type
- 9.2.1. Chemical Compounds
- 9.2.2. Bio Samples
- 9.3. Market Analysis, Insights and Forecast - by Application
- 9.3.1. Drug Discovery
- 9.3.2. Gene Synthesis
- 9.3.3. Bio Banking
- 9.3.4. Other Applications
- 9.1. Market Analysis, Insights and Forecast - by Type
- 10. South America Compound Management Industry Analysis, Insights and Forecast, 2019-2031
- 10.1. Market Analysis, Insights and Forecast - by Type
- 10.1.1. Product
- 10.1.1.1. Automated Compounds/Sample Storage Systems
- 10.1.1.2. Automated Liquid Handling Systems
- 10.1.1.3. Other Compounds/Sample Storage Systems
- 10.1.2. Service
- 10.1.1. Product
- 10.2. Market Analysis, Insights and Forecast - by Sample Type
- 10.2.1. Chemical Compounds
- 10.2.2. Bio Samples
- 10.3. Market Analysis, Insights and Forecast - by Application
- 10.3.1. Drug Discovery
- 10.3.2. Gene Synthesis
- 10.3.3. Bio Banking
- 10.3.4. Other Applications
- 10.1. Market Analysis, Insights and Forecast - by Type
- 11. North America Compound Management Industry Analysis, Insights and Forecast, 2019-2031
- 11.1. Market Analysis, Insights and Forecast - By Country/Sub-region
- 11.1.1. undefined
- 12. Europe Compound Management Industry Analysis, Insights and Forecast, 2019-2031
- 12.1. Market Analysis, Insights and Forecast - By Country/Sub-region
- 12.1.1. undefined
- 13. Asia Pacific Compound Management Industry Analysis, Insights and Forecast, 2019-2031
- 13.1. Market Analysis, Insights and Forecast - By Country/Sub-region
- 13.1.1. undefined
- 14. Middle East and Africa Compound Management Industry Analysis, Insights and Forecast, 2019-2031
- 14.1. Market Analysis, Insights and Forecast - By Country/Sub-region
- 14.1.1. undefined
- 15. South America Compound Management Industry Analysis, Insights and Forecast, 2019-2031
- 15.1. Market Analysis, Insights and Forecast - By Country/Sub-region
- 15.1.1. undefined
- 16. Competitive Analysis
- 16.1. Global Market Share Analysis 2024
- 16.2. Company Profiles
- 16.2.1 Tecan Trading AG
- 16.2.1.1. Overview
- 16.2.1.2. Products
- 16.2.1.3. SWOT Analysis
- 16.2.1.4. Recent Developments
- 16.2.1.5. Financials (Based on Availability)
- 16.2.2 Beckman Coulter Inc
- 16.2.2.1. Overview
- 16.2.2.2. Products
- 16.2.2.3. SWOT Analysis
- 16.2.2.4. Recent Developments
- 16.2.2.5. Financials (Based on Availability)
- 16.2.3 AXXAM SpA
- 16.2.3.1. Overview
- 16.2.3.2. Products
- 16.2.3.3. SWOT Analysis
- 16.2.3.4. Recent Developments
- 16.2.3.5. Financials (Based on Availability)
- 16.2.4 Titian Software Limited
- 16.2.4.1. Overview
- 16.2.4.2. Products
- 16.2.4.3. SWOT Analysis
- 16.2.4.4. Recent Developments
- 16.2.4.5. Financials (Based on Availability)
- 16.2.5 SPT Labtech
- 16.2.5.1. Overview
- 16.2.5.2. Products
- 16.2.5.3. SWOT Analysis
- 16.2.5.4. Recent Developments
- 16.2.5.5. Financials (Based on Availability)
- 16.2.6 Evotec
- 16.2.6.1. Overview
- 16.2.6.2. Products
- 16.2.6.3. SWOT Analysis
- 16.2.6.4. Recent Developments
- 16.2.6.5. Financials (Based on Availability)
- 16.2.7 LiCONiC AG
- 16.2.7.1. Overview
- 16.2.7.2. Products
- 16.2.7.3. SWOT Analysis
- 16.2.7.4. Recent Developments
- 16.2.7.5. Financials (Based on Availability)
- 16.2.8 Brooks Life Sciences
- 16.2.8.1. Overview
- 16.2.8.2. Products
- 16.2.8.3. SWOT Analysis
- 16.2.8.4. Recent Developments
- 16.2.8.5. Financials (Based on Availability)
- 16.2.9 Hamilton Company
- 16.2.9.1. Overview
- 16.2.9.2. Products
- 16.2.9.3. SWOT Analysis
- 16.2.9.4. Recent Developments
- 16.2.9.5. Financials (Based on Availability)
- 16.2.10 BioAscent
- 16.2.10.1. Overview
- 16.2.10.2. Products
- 16.2.10.3. SWOT Analysis
- 16.2.10.4. Recent Developments
- 16.2.10.5. Financials (Based on Availability)
- 16.2.1 Tecan Trading AG
List of Figures
- Figure 1: Global Compound Management Industry Revenue Breakdown (Million, %) by Region 2024 & 2032
- Figure 2: Global Compound Management Industry Volume Breakdown (K unit, %) by Region 2024 & 2032
- Figure 3: North America Compound Management Industry Revenue (Million), by Country 2024 & 2032
- Figure 4: North America Compound Management Industry Volume (K unit), by Country 2024 & 2032
- Figure 5: North America Compound Management Industry Revenue Share (%), by Country 2024 & 2032
- Figure 6: North America Compound Management Industry Volume Share (%), by Country 2024 & 2032
- Figure 7: Europe Compound Management Industry Revenue (Million), by Country 2024 & 2032
- Figure 8: Europe Compound Management Industry Volume (K unit), by Country 2024 & 2032
- Figure 9: Europe Compound Management Industry Revenue Share (%), by Country 2024 & 2032
- Figure 10: Europe Compound Management Industry Volume Share (%), by Country 2024 & 2032
- Figure 11: Asia Pacific Compound Management Industry Revenue (Million), by Country 2024 & 2032
- Figure 12: Asia Pacific Compound Management Industry Volume (K unit), by Country 2024 & 2032
- Figure 13: Asia Pacific Compound Management Industry Revenue Share (%), by Country 2024 & 2032
- Figure 14: Asia Pacific Compound Management Industry Volume Share (%), by Country 2024 & 2032
- Figure 15: Middle East and Africa Compound Management Industry Revenue (Million), by Country 2024 & 2032
- Figure 16: Middle East and Africa Compound Management Industry Volume (K unit), by Country 2024 & 2032
- Figure 17: Middle East and Africa Compound Management Industry Revenue Share (%), by Country 2024 & 2032
- Figure 18: Middle East and Africa Compound Management Industry Volume Share (%), by Country 2024 & 2032
- Figure 19: South America Compound Management Industry Revenue (Million), by Country 2024 & 2032
- Figure 20: South America Compound Management Industry Volume (K unit), by Country 2024 & 2032
- Figure 21: South America Compound Management Industry Revenue Share (%), by Country 2024 & 2032
- Figure 22: South America Compound Management Industry Volume Share (%), by Country 2024 & 2032
- Figure 23: North America Compound Management Industry Revenue (Million), by Type 2024 & 2032
- Figure 24: North America Compound Management Industry Volume (K unit), by Type 2024 & 2032
- Figure 25: North America Compound Management Industry Revenue Share (%), by Type 2024 & 2032
- Figure 26: North America Compound Management Industry Volume Share (%), by Type 2024 & 2032
- Figure 27: North America Compound Management Industry Revenue (Million), by Sample Type 2024 & 2032
- Figure 28: North America Compound Management Industry Volume (K unit), by Sample Type 2024 & 2032
- Figure 29: North America Compound Management Industry Revenue Share (%), by Sample Type 2024 & 2032
- Figure 30: North America Compound Management Industry Volume Share (%), by Sample Type 2024 & 2032
- Figure 31: North America Compound Management Industry Revenue (Million), by Application 2024 & 2032
- Figure 32: North America Compound Management Industry Volume (K unit), by Application 2024 & 2032
- Figure 33: North America Compound Management Industry Revenue Share (%), by Application 2024 & 2032
- Figure 34: North America Compound Management Industry Volume Share (%), by Application 2024 & 2032
- Figure 35: North America Compound Management Industry Revenue (Million), by Country 2024 & 2032
- Figure 36: North America Compound Management Industry Volume (K unit), by Country 2024 & 2032
- Figure 37: North America Compound Management Industry Revenue Share (%), by Country 2024 & 2032
- Figure 38: North America Compound Management Industry Volume Share (%), by Country 2024 & 2032
- Figure 39: Europe Compound Management Industry Revenue (Million), by Type 2024 & 2032
- Figure 40: Europe Compound Management Industry Volume (K unit), by Type 2024 & 2032
- Figure 41: Europe Compound Management Industry Revenue Share (%), by Type 2024 & 2032
- Figure 42: Europe Compound Management Industry Volume Share (%), by Type 2024 & 2032
- Figure 43: Europe Compound Management Industry Revenue (Million), by Sample Type 2024 & 2032
- Figure 44: Europe Compound Management Industry Volume (K unit), by Sample Type 2024 & 2032
- Figure 45: Europe Compound Management Industry Revenue Share (%), by Sample Type 2024 & 2032
- Figure 46: Europe Compound Management Industry Volume Share (%), by Sample Type 2024 & 2032
- Figure 47: Europe Compound Management Industry Revenue (Million), by Application 2024 & 2032
- Figure 48: Europe Compound Management Industry Volume (K unit), by Application 2024 & 2032
- Figure 49: Europe Compound Management Industry Revenue Share (%), by Application 2024 & 2032
- Figure 50: Europe Compound Management Industry Volume Share (%), by Application 2024 & 2032
- Figure 51: Europe Compound Management Industry Revenue (Million), by Country 2024 & 2032
- Figure 52: Europe Compound Management Industry Volume (K unit), by Country 2024 & 2032
- Figure 53: Europe Compound Management Industry Revenue Share (%), by Country 2024 & 2032
- Figure 54: Europe Compound Management Industry Volume Share (%), by Country 2024 & 2032
- Figure 55: Asia Pacific Compound Management Industry Revenue (Million), by Type 2024 & 2032
- Figure 56: Asia Pacific Compound Management Industry Volume (K unit), by Type 2024 & 2032
- Figure 57: Asia Pacific Compound Management Industry Revenue Share (%), by Type 2024 & 2032
- Figure 58: Asia Pacific Compound Management Industry Volume Share (%), by Type 2024 & 2032
- Figure 59: Asia Pacific Compound Management Industry Revenue (Million), by Sample Type 2024 & 2032
- Figure 60: Asia Pacific Compound Management Industry Volume (K unit), by Sample Type 2024 & 2032
- Figure 61: Asia Pacific Compound Management Industry Revenue Share (%), by Sample Type 2024 & 2032
- Figure 62: Asia Pacific Compound Management Industry Volume Share (%), by Sample Type 2024 & 2032
- Figure 63: Asia Pacific Compound Management Industry Revenue (Million), by Application 2024 & 2032
- Figure 64: Asia Pacific Compound Management Industry Volume (K unit), by Application 2024 & 2032
- Figure 65: Asia Pacific Compound Management Industry Revenue Share (%), by Application 2024 & 2032
- Figure 66: Asia Pacific Compound Management Industry Volume Share (%), by Application 2024 & 2032
- Figure 67: Asia Pacific Compound Management Industry Revenue (Million), by Country 2024 & 2032
- Figure 68: Asia Pacific Compound Management Industry Volume (K unit), by Country 2024 & 2032
- Figure 69: Asia Pacific Compound Management Industry Revenue Share (%), by Country 2024 & 2032
- Figure 70: Asia Pacific Compound Management Industry Volume Share (%), by Country 2024 & 2032
- Figure 71: Middle East and Africa Compound Management Industry Revenue (Million), by Type 2024 & 2032
- Figure 72: Middle East and Africa Compound Management Industry Volume (K unit), by Type 2024 & 2032
- Figure 73: Middle East and Africa Compound Management Industry Revenue Share (%), by Type 2024 & 2032
- Figure 74: Middle East and Africa Compound Management Industry Volume Share (%), by Type 2024 & 2032
- Figure 75: Middle East and Africa Compound Management Industry Revenue (Million), by Sample Type 2024 & 2032
- Figure 76: Middle East and Africa Compound Management Industry Volume (K unit), by Sample Type 2024 & 2032
- Figure 77: Middle East and Africa Compound Management Industry Revenue Share (%), by Sample Type 2024 & 2032
- Figure 78: Middle East and Africa Compound Management Industry Volume Share (%), by Sample Type 2024 & 2032
- Figure 79: Middle East and Africa Compound Management Industry Revenue (Million), by Application 2024 & 2032
- Figure 80: Middle East and Africa Compound Management Industry Volume (K unit), by Application 2024 & 2032
- Figure 81: Middle East and Africa Compound Management Industry Revenue Share (%), by Application 2024 & 2032
- Figure 82: Middle East and Africa Compound Management Industry Volume Share (%), by Application 2024 & 2032
- Figure 83: Middle East and Africa Compound Management Industry Revenue (Million), by Country 2024 & 2032
- Figure 84: Middle East and Africa Compound Management Industry Volume (K unit), by Country 2024 & 2032
- Figure 85: Middle East and Africa Compound Management Industry Revenue Share (%), by Country 2024 & 2032
- Figure 86: Middle East and Africa Compound Management Industry Volume Share (%), by Country 2024 & 2032
- Figure 87: South America Compound Management Industry Revenue (Million), by Type 2024 & 2032
- Figure 88: South America Compound Management Industry Volume (K unit), by Type 2024 & 2032
- Figure 89: South America Compound Management Industry Revenue Share (%), by Type 2024 & 2032
- Figure 90: South America Compound Management Industry Volume Share (%), by Type 2024 & 2032
- Figure 91: South America Compound Management Industry Revenue (Million), by Sample Type 2024 & 2032
- Figure 92: South America Compound Management Industry Volume (K unit), by Sample Type 2024 & 2032
- Figure 93: South America Compound Management Industry Revenue Share (%), by Sample Type 2024 & 2032
- Figure 94: South America Compound Management Industry Volume Share (%), by Sample Type 2024 & 2032
- Figure 95: South America Compound Management Industry Revenue (Million), by Application 2024 & 2032
- Figure 96: South America Compound Management Industry Volume (K unit), by Application 2024 & 2032
- Figure 97: South America Compound Management Industry Revenue Share (%), by Application 2024 & 2032
- Figure 98: South America Compound Management Industry Volume Share (%), by Application 2024 & 2032
- Figure 99: South America Compound Management Industry Revenue (Million), by Country 2024 & 2032
- Figure 100: South America Compound Management Industry Volume (K unit), by Country 2024 & 2032
- Figure 101: South America Compound Management Industry Revenue Share (%), by Country 2024 & 2032
- Figure 102: South America Compound Management Industry Volume Share (%), by Country 2024 & 2032
List of Tables
- Table 1: Global Compound Management Industry Revenue Million Forecast, by Region 2019 & 2032
- Table 2: Global Compound Management Industry Volume K unit Forecast, by Region 2019 & 2032
- Table 3: Global Compound Management Industry Revenue Million Forecast, by Type 2019 & 2032
- Table 4: Global Compound Management Industry Volume K unit Forecast, by Type 2019 & 2032
- Table 5: Global Compound Management Industry Revenue Million Forecast, by Sample Type 2019 & 2032
- Table 6: Global Compound Management Industry Volume K unit Forecast, by Sample Type 2019 & 2032
- Table 7: Global Compound Management Industry Revenue Million Forecast, by Application 2019 & 2032
- Table 8: Global Compound Management Industry Volume K unit Forecast, by Application 2019 & 2032
- Table 9: Global Compound Management Industry Revenue Million Forecast, by Region 2019 & 2032
- Table 10: Global Compound Management Industry Volume K unit Forecast, by Region 2019 & 2032
- Table 11: Global Compound Management Industry Revenue Million Forecast, by Country 2019 & 2032
- Table 12: Global Compound Management Industry Volume K unit Forecast, by Country 2019 & 2032
- Table 13: Global Compound Management Industry Revenue Million Forecast, by Country 2019 & 2032
- Table 14: Global Compound Management Industry Volume K unit Forecast, by Country 2019 & 2032
- Table 15: Global Compound Management Industry Revenue Million Forecast, by Country 2019 & 2032
- Table 16: Global Compound Management Industry Volume K unit Forecast, by Country 2019 & 2032
- Table 17: Global Compound Management Industry Revenue Million Forecast, by Country 2019 & 2032
- Table 18: Global Compound Management Industry Volume K unit Forecast, by Country 2019 & 2032
- Table 19: Global Compound Management Industry Revenue Million Forecast, by Country 2019 & 2032
- Table 20: Global Compound Management Industry Volume K unit Forecast, by Country 2019 & 2032
- Table 21: Global Compound Management Industry Revenue Million Forecast, by Type 2019 & 2032
- Table 22: Global Compound Management Industry Volume K unit Forecast, by Type 2019 & 2032
- Table 23: Global Compound Management Industry Revenue Million Forecast, by Sample Type 2019 & 2032
- Table 24: Global Compound Management Industry Volume K unit Forecast, by Sample Type 2019 & 2032
- Table 25: Global Compound Management Industry Revenue Million Forecast, by Application 2019 & 2032
- Table 26: Global Compound Management Industry Volume K unit Forecast, by Application 2019 & 2032
- Table 27: Global Compound Management Industry Revenue Million Forecast, by Country 2019 & 2032
- Table 28: Global Compound Management Industry Volume K unit Forecast, by Country 2019 & 2032
- Table 29: United States Compound Management Industry Revenue (Million) Forecast, by Application 2019 & 2032
- Table 30: United States Compound Management Industry Volume (K unit) Forecast, by Application 2019 & 2032
- Table 31: Canada Compound Management Industry Revenue (Million) Forecast, by Application 2019 & 2032
- Table 32: Canada Compound Management Industry Volume (K unit) Forecast, by Application 2019 & 2032
- Table 33: Mexico Compound Management Industry Revenue (Million) Forecast, by Application 2019 & 2032
- Table 34: Mexico Compound Management Industry Volume (K unit) Forecast, by Application 2019 & 2032
- Table 35: Global Compound Management Industry Revenue Million Forecast, by Type 2019 & 2032
- Table 36: Global Compound Management Industry Volume K unit Forecast, by Type 2019 & 2032
- Table 37: Global Compound Management Industry Revenue Million Forecast, by Sample Type 2019 & 2032
- Table 38: Global Compound Management Industry Volume K unit Forecast, by Sample Type 2019 & 2032
- Table 39: Global Compound Management Industry Revenue Million Forecast, by Application 2019 & 2032
- Table 40: Global Compound Management Industry Volume K unit Forecast, by Application 2019 & 2032
- Table 41: Global Compound Management Industry Revenue Million Forecast, by Country 2019 & 2032
- Table 42: Global Compound Management Industry Volume K unit Forecast, by Country 2019 & 2032
- Table 43: Germany Compound Management Industry Revenue (Million) Forecast, by Application 2019 & 2032
- Table 44: Germany Compound Management Industry Volume (K unit) Forecast, by Application 2019 & 2032
- Table 45: United Kingdom Compound Management Industry Revenue (Million) Forecast, by Application 2019 & 2032
- Table 46: United Kingdom Compound Management Industry Volume (K unit) Forecast, by Application 2019 & 2032
- Table 47: France Compound Management Industry Revenue (Million) Forecast, by Application 2019 & 2032
- Table 48: France Compound Management Industry Volume (K unit) Forecast, by Application 2019 & 2032
- Table 49: Italy Compound Management Industry Revenue (Million) Forecast, by Application 2019 & 2032
- Table 50: Italy Compound Management Industry Volume (K unit) Forecast, by Application 2019 & 2032
- Table 51: Spain Compound Management Industry Revenue (Million) Forecast, by Application 2019 & 2032
- Table 52: Spain Compound Management Industry Volume (K unit) Forecast, by Application 2019 & 2032
- Table 53: Rest of Europe Compound Management Industry Revenue (Million) Forecast, by Application 2019 & 2032
- Table 54: Rest of Europe Compound Management Industry Volume (K unit) Forecast, by Application 2019 & 2032
- Table 55: Global Compound Management Industry Revenue Million Forecast, by Type 2019 & 2032
- Table 56: Global Compound Management Industry Volume K unit Forecast, by Type 2019 & 2032
- Table 57: Global Compound Management Industry Revenue Million Forecast, by Sample Type 2019 & 2032
- Table 58: Global Compound Management Industry Volume K unit Forecast, by Sample Type 2019 & 2032
- Table 59: Global Compound Management Industry Revenue Million Forecast, by Application 2019 & 2032
- Table 60: Global Compound Management Industry Volume K unit Forecast, by Application 2019 & 2032
- Table 61: Global Compound Management Industry Revenue Million Forecast, by Country 2019 & 2032
- Table 62: Global Compound Management Industry Volume K unit Forecast, by Country 2019 & 2032
- Table 63: China Compound Management Industry Revenue (Million) Forecast, by Application 2019 & 2032
- Table 64: China Compound Management Industry Volume (K unit) Forecast, by Application 2019 & 2032
- Table 65: Japan Compound Management Industry Revenue (Million) Forecast, by Application 2019 & 2032
- Table 66: Japan Compound Management Industry Volume (K unit) Forecast, by Application 2019 & 2032
- Table 67: India Compound Management Industry Revenue (Million) Forecast, by Application 2019 & 2032
- Table 68: India Compound Management Industry Volume (K unit) Forecast, by Application 2019 & 2032
- Table 69: Australia Compound Management Industry Revenue (Million) Forecast, by Application 2019 & 2032
- Table 70: Australia Compound Management Industry Volume (K unit) Forecast, by Application 2019 & 2032
- Table 71: South Korea Compound Management Industry Revenue (Million) Forecast, by Application 2019 & 2032
- Table 72: South Korea Compound Management Industry Volume (K unit) Forecast, by Application 2019 & 2032
- Table 73: Rest of Asia Pacific Compound Management Industry Revenue (Million) Forecast, by Application 2019 & 2032
- Table 74: Rest of Asia Pacific Compound Management Industry Volume (K unit) Forecast, by Application 2019 & 2032
- Table 75: Global Compound Management Industry Revenue Million Forecast, by Type 2019 & 2032
- Table 76: Global Compound Management Industry Volume K unit Forecast, by Type 2019 & 2032
- Table 77: Global Compound Management Industry Revenue Million Forecast, by Sample Type 2019 & 2032
- Table 78: Global Compound Management Industry Volume K unit Forecast, by Sample Type 2019 & 2032
- Table 79: Global Compound Management Industry Revenue Million Forecast, by Application 2019 & 2032
- Table 80: Global Compound Management Industry Volume K unit Forecast, by Application 2019 & 2032
- Table 81: Global Compound Management Industry Revenue Million Forecast, by Country 2019 & 2032
- Table 82: Global Compound Management Industry Volume K unit Forecast, by Country 2019 & 2032
- Table 83: GCC Compound Management Industry Revenue (Million) Forecast, by Application 2019 & 2032
- Table 84: GCC Compound Management Industry Volume (K unit) Forecast, by Application 2019 & 2032
- Table 85: South Africa Compound Management Industry Revenue (Million) Forecast, by Application 2019 & 2032
- Table 86: South Africa Compound Management Industry Volume (K unit) Forecast, by Application 2019 & 2032
- Table 87: Rest of Middle East and Africa Compound Management Industry Revenue (Million) Forecast, by Application 2019 & 2032
- Table 88: Rest of Middle East and Africa Compound Management Industry Volume (K unit) Forecast, by Application 2019 & 2032
- Table 89: Global Compound Management Industry Revenue Million Forecast, by Type 2019 & 2032
- Table 90: Global Compound Management Industry Volume K unit Forecast, by Type 2019 & 2032
- Table 91: Global Compound Management Industry Revenue Million Forecast, by Sample Type 2019 & 2032
- Table 92: Global Compound Management Industry Volume K unit Forecast, by Sample Type 2019 & 2032
- Table 93: Global Compound Management Industry Revenue Million Forecast, by Application 2019 & 2032
- Table 94: Global Compound Management Industry Volume K unit Forecast, by Application 2019 & 2032
- Table 95: Global Compound Management Industry Revenue Million Forecast, by Country 2019 & 2032
- Table 96: Global Compound Management Industry Volume K unit Forecast, by Country 2019 & 2032
- Table 97: Brazil Compound Management Industry Revenue (Million) Forecast, by Application 2019 & 2032
- Table 98: Brazil Compound Management Industry Volume (K unit) Forecast, by Application 2019 & 2032
- Table 99: Argentina Compound Management Industry Revenue (Million) Forecast, by Application 2019 & 2032
- Table 100: Argentina Compound Management Industry Volume (K unit) Forecast, by Application 2019 & 2032
- Table 101: Rest of South America Compound Management Industry Revenue (Million) Forecast, by Application 2019 & 2032
- Table 102: Rest of South America Compound Management Industry Volume (K unit) Forecast, by Application 2019 & 2032
Frequently Asked Questions
1. What is the projected Compound Annual Growth Rate (CAGR) of the Compound Management Industry?
The projected CAGR is approximately 14.70%.
2. Which companies are prominent players in the Compound Management Industry?
Key companies in the market include Tecan Trading AG, Beckman Coulter Inc, AXXAM SpA, Titian Software Limited, SPT Labtech, Evotec, LiCONiC AG, Brooks Life Sciences, Hamilton Company, BioAscent.
3. What are the main segments of the Compound Management Industry?
The market segments include Type, Sample Type, Application.
4. Can you provide details about the market size?
The market size is estimated to be USD XX Million as of 2022.
5. What are some drivers contributing to market growth?
Increasing Drug Discovery Activities; Growth in the Bio-pharmaceutical Industry; Technological Advancement and Favorable Reimbursement.
6. What are the notable trends driving market growth?
The Automated Storage Systems Segment is Expected to Dominate the Market Over the Forecast Period..
7. Are there any restraints impacting market growth?
High Cost Associated with Compound Management.
8. Can you provide examples of recent developments in the market?
February 2021: SPT Labtech announced the acquisition of BioMicroLab, a robotics automation provider, to strengthen its capabilities in automatic sample management.
9. What pricing options are available for accessing the report?
Pricing options include single-user, multi-user, and enterprise licenses priced at USD 4750, USD 5250, and USD 8750 respectively.
10. Is the market size provided in terms of value or volume?
The market size is provided in terms of value, measured in Million and volume, measured in K unit.
11. Are there any specific market keywords associated with the report?
Yes, the market keyword associated with the report is "Compound Management Industry," which aids in identifying and referencing the specific market segment covered.
12. How do I determine which pricing option suits my needs best?
The pricing options vary based on user requirements and access needs. Individual users may opt for single-user licenses, while businesses requiring broader access may choose multi-user or enterprise licenses for cost-effective access to the report.
13. Are there any additional resources or data provided in the Compound Management Industry report?
While the report offers comprehensive insights, it's advisable to review the specific contents or supplementary materials provided to ascertain if additional resources or data are available.
14. How can I stay updated on further developments or reports in the Compound Management Industry?
To stay informed about further developments, trends, and reports in the Compound Management Industry, consider subscribing to industry newsletters, following relevant companies and organizations, or regularly checking reputable industry news sources and publications.
Methodology
Step 1 - Identification of Relevant Samples Size from Population Database


Step 2 - Approaches for Defining Global Market Size (Value, Volume* & Price*)

Note*: In applicable scenarios
Step 3 - Data Sources
Primary Research
- Web Analytics
- Survey Reports
- Research Institute
- Latest Research Reports
- Opinion Leaders
Secondary Research
- Annual Reports
- White Paper
- Latest Press Release
- Industry Association
- Paid Database
- Investor Presentations

Step 4 - Data Triangulation
Involves using different sources of information in order to increase the validity of a study
These sources are likely to be stakeholders in a program - participants, other researchers, program staff, other community members, and so on.
Then we put all data in single framework & apply various statistical tools to find out the dynamic on the market.
During the analysis stage, feedback from the stakeholder groups would be compared to determine areas of agreement as well as areas of divergence


