
Key Insights
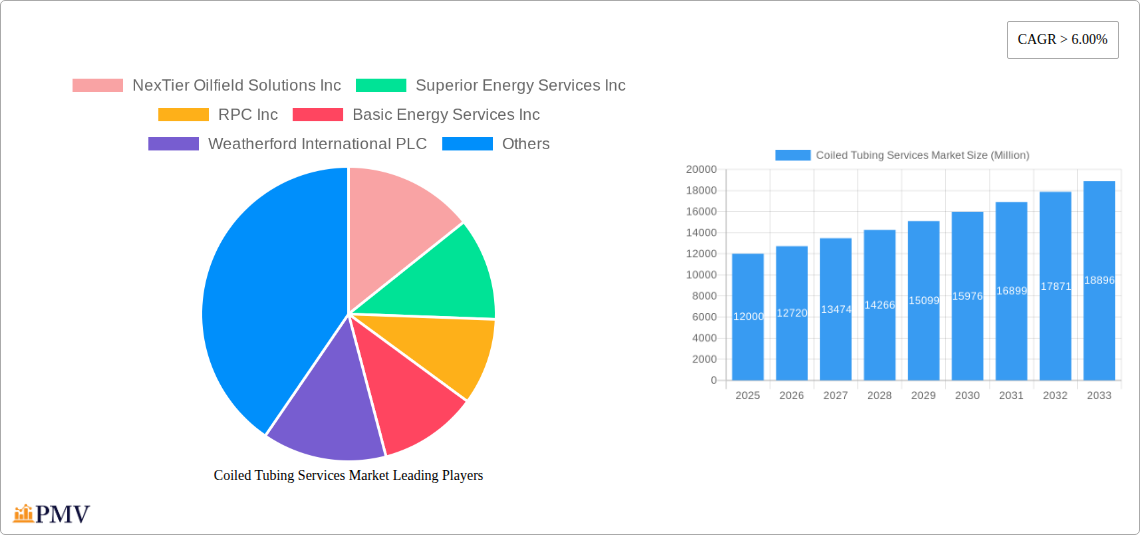
The global Coiled Tubing Services market is experiencing robust growth, driven by increasing oil and gas exploration and production activities, particularly in unconventional resources like shale gas. The market's compound annual growth rate (CAGR) exceeding 6.00% signifies a sustained demand for efficient and cost-effective well intervention techniques. Key market drivers include the rising adoption of coiled tubing technology for various applications such as drilling, completion, and well intervention across onshore and offshore locations. Technological advancements in coiled tubing units (CTUs), leading to improved efficiency and reduced operational downtime, are further fueling market expansion. The market is segmented geographically, with North America (particularly the US) currently dominating due to significant oil and gas production. However, regions like Asia-Pacific and the Middle East & Africa are emerging as promising growth areas, fueled by substantial investments in infrastructure development and exploration activities. While the market faces constraints such as fluctuating oil prices and stringent environmental regulations, the long-term outlook remains positive due to the continuous need for enhanced oil recovery techniques and the growing demand for efficient well servicing solutions. The competitive landscape is characterized by a mix of large multinational corporations and smaller specialized service providers, leading to innovation and competitive pricing. The market is expected to witness further consolidation in the coming years, with companies focusing on strategic alliances and technological advancements to maintain their market share.
The significant players in this market, including NexTier Oilfield Solutions Inc, Superior Energy Services Inc, RPC Inc, Basic Energy Services Inc, Weatherford International PLC, Trican Well Service Ltd, Baker Hughes Company, Halliburton Company, Schlumberger Limited, and Calfrac Well Services Ltd, are continuously investing in research and development to improve the efficiency and safety of their coiled tubing services. Their focus on technological advancements, such as the development of advanced CTUs with enhanced capabilities and automation, will continue to drive market growth. Furthermore, the industry's emphasis on data analytics and digitalization is enhancing operational efficiency and predictive maintenance, contributing to the overall market expansion. The increasing demand for sustainable and environmentally friendly practices in the oil and gas sector is also pushing service providers to adopt technologies that minimize their environmental impact, which in turn presents opportunities for the market’s continued expansion.
Coiled Tubing Services Market: A Comprehensive Report (2019-2033)
This in-depth report provides a comprehensive analysis of the global Coiled Tubing Services market, offering valuable insights for industry stakeholders, investors, and strategic decision-makers. Covering the period from 2019 to 2033 (Base Year: 2025, Forecast Period: 2025-2033), this report meticulously examines market dynamics, competitive landscapes, and future growth potential. The market is projected to reach xx Million by 2033, exhibiting a CAGR of xx% during the forecast period.
Coiled Tubing Services Market Market Structure & Competitive Dynamics
The Coiled Tubing Services market is characterized by a moderately concentrated structure, with several major players holding significant market share. The leading companies, including NexTier Oilfield Solutions Inc, Superior Energy Services Inc, RPC Inc, Basic Energy Services Inc, Weatherford International PLC, Trican Well Service Ltd, Baker Hughes Company, Halliburton Company, Schlumberger Limited, and Calfrac Well Services Ltd, contribute to a competitive landscape driven by technological innovation and strategic acquisitions. Market share analysis reveals that the top five players collectively hold approximately xx% of the market in 2025.
Innovation ecosystems are crucial, with ongoing R&D investments focused on enhancing efficiency, safety, and operational capabilities of coiled tubing services. Regulatory frameworks, including environmental regulations and safety standards, significantly influence market operations. Product substitutes, such as alternative well intervention techniques, pose a moderate threat, although coiled tubing remains a prevalent method due to its versatility and cost-effectiveness.
End-user trends reveal a growing preference for integrated services and optimized well interventions. Mergers and acquisitions (M&A) activities have played a considerable role in shaping market dynamics, with several notable deals exceeding USD xx Million in recent years. These M&A activities have consolidated market power and facilitated technological advancements. The average deal value for M&A activities within the last 5 years has been approximately USD xx Million.
Coiled Tubing Services Market Industry Trends & Insights
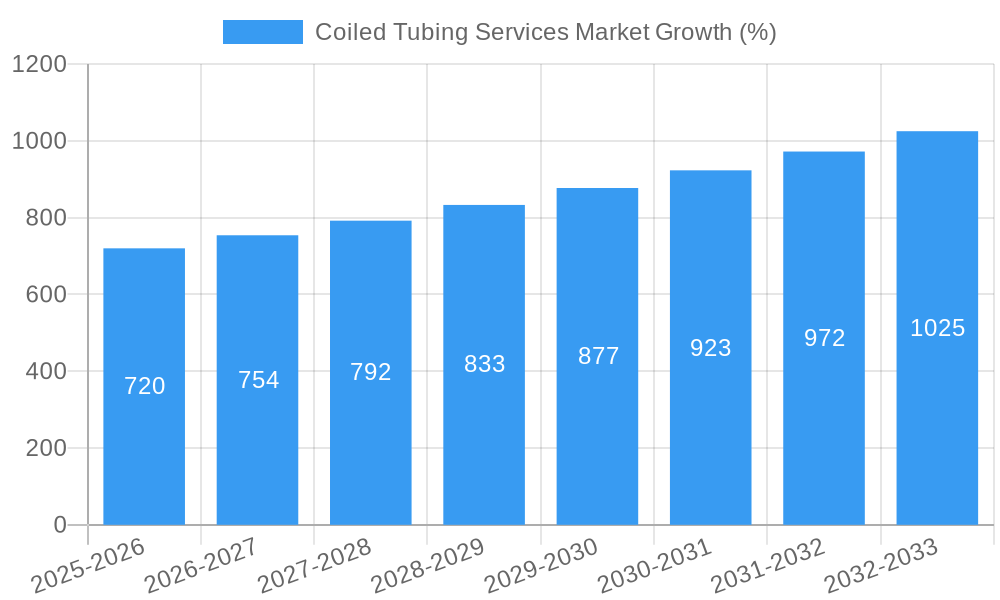
The Coiled Tubing Services market is experiencing significant growth, driven by factors such as the increasing demand for oil and gas, the exploration of unconventional resources, and the adoption of advanced technologies. Technological disruptions, particularly in areas like automation, data analytics, and enhanced well intervention techniques, are transforming market operations and improving efficiency. The growing adoption of smart coiled tubing units and the integration of digital technologies are enhancing data acquisition and analysis, optimizing operational decisions and leading to cost reductions. Consumer preferences are shifting towards environmentally friendly and sustainable solutions, creating an impetus for the development of eco-friendly coiled tubing technologies and practices. The market is predicted to experience significant growth driven by the increasing demand for oil and gas resources, the expansion of shale gas exploration, and the adoption of enhanced oil recovery techniques. These factors will continue to propel market expansion, and the increased demand in developing economies of Asia and the Middle East will further bolster the market. The overall market growth is expected to be xx% per year over the next decade. The market penetration rate in terms of wells treated by coiled tubing is currently at xx%, expected to rise to xx% by 2033.
Dominant Markets & Segments in Coiled Tubing Services Market
Dominant Regions & Segments:
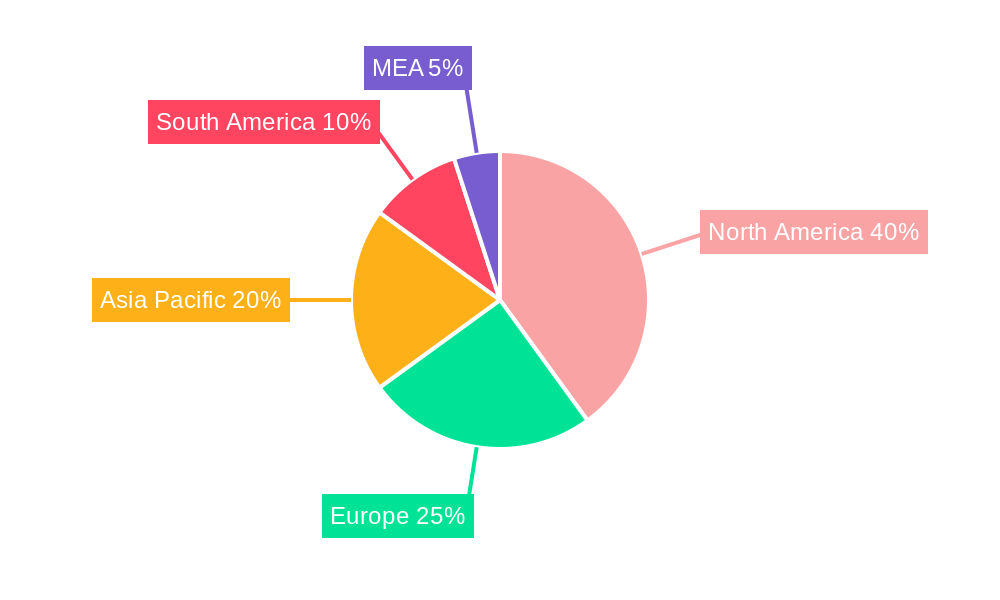
The North American region currently holds the largest market share, followed by the Middle East and Asia Pacific. The Onshore segment dominates in terms of deployment, mainly due to the extensive presence of oil and gas production facilities. However, the Offshore segment is expected to witness significant growth owing to increasing investments in deepwater exploration and production activities.
- Key Drivers for North America: Robust oil and gas production, significant investment in shale gas exploration, and the presence of established coiled tubing service providers.
- Key Drivers for Middle East: Extensive oil and gas reserves, ongoing investments in upstream projects, and growing demand for enhanced oil recovery techniques.
- Key Drivers for Asia Pacific: Rapid industrialization and economic growth, rising energy demands, and increasing investments in exploration and production activities.
The Well Intervention application segment is currently the largest, demonstrating the crucial role of coiled tubing in optimizing well production and maintenance. However, Drilling and Completion segments also contribute significantly to market revenue. The substantial growth in the Well Intervention segment can be largely attributed to the increasing need for well maintenance and repair operations.
Coiled Tubing Services Market Product Innovations
Recent product developments include advancements in coiled tubing materials, improved downhole tools, and the integration of automation and robotics to enhance operational efficiency and safety. These innovations enable greater precision in well interventions, reduce downtime, and minimize environmental impact. The integration of advanced sensors and data analytics facilitates real-time monitoring and optimization of coiled tubing operations. The introduction of high-temperature and high-pressure coiled tubing systems allows for operations in harsh environments, thus expanding the range of applications.
Report Segmentation & Scope
The report segments the Coiled Tubing Services market based on:
Application: Drilling, Completion, Well Intervention. Each application segment presents unique growth projections based on factors such as technological advancements and industry trends. The Completion segment is witnessing steady growth, as the complexity of well completion procedures increases the demand for efficient coiled tubing solutions. The Well Intervention segment presents the highest growth potential due to the increasing focus on well integrity management and enhanced oil recovery techniques. The Drilling segment is projected to grow at a moderate rate, driven by the increased adoption of coiled tubing for drilling support operations.
Location of Deployment: Onshore, Offshore. The Offshore segment is anticipated to exhibit faster growth, driven by increasing deepwater exploration and production. The Onshore segment remains substantial owing to the higher volume of onshore drilling activities. Competitive dynamics vary between segments, with some service providers specializing in specific applications or deployment locations.
Key Drivers of Coiled Tubing Services Market Growth
The Coiled Tubing Services market is driven by several factors, including the rising demand for oil and gas, the exploration and production of unconventional resources, technological advancements, and government initiatives promoting energy efficiency. Furthermore, the increasing adoption of enhanced oil recovery (EOR) techniques necessitates the use of coiled tubing for efficient well stimulation and intervention, further fueling market growth.
Challenges in the Coiled Tubing Services Market Sector
The Coiled Tubing Services market faces challenges such as price fluctuations of oil and gas, stringent safety regulations, intense competition, and the need for skilled labor. Supply chain disruptions and the increasing complexity of well interventions also pose challenges to market growth. The market experiences a cyclical nature, influenced directly by the price of oil and the activity levels in oil and gas exploration and production.
Leading Players in the Coiled Tubing Services Market Market
- NexTier Oilfield Solutions Inc
- Superior Energy Services Inc
- RPC Inc
- Basic Energy Services Inc
- Weatherford International PLC
- Trican Well Service Ltd
- Baker Hughes Company
- Halliburton Company
- Schlumberger Limited
- Calfrac Well Services Ltd
Key Developments in Coiled Tubing Services Market Sector
- July 2021: ADNOC's USD 763.7 Million investment in integrated rigless services, including coiled tubing, significantly boosted market demand and highlighted the growing adoption of advanced well intervention technologies. This investment signaled a shift towards more efficient and cost-effective well management strategies.
Strategic Coiled Tubing Services Market Market Outlook
The Coiled Tubing Services market is poised for continued growth, driven by increasing exploration and production activities, particularly in unconventional resources and deepwater fields. Strategic opportunities lie in technological innovation, partnerships, and expansion into emerging markets. The focus on efficiency, safety, and environmental sustainability will further shape market trends and offer opportunities for companies to gain a competitive edge.
Coiled Tubing Services Market Segmentation
-
1. Application
- 1.1. Drilling
- 1.2. Completion
- 1.3. Well Intervention
-
2. Location of Deployment
- 2.1. Onshore
- 2.2. Offshore
Coiled Tubing Services Market Segmentation By Geography
- 1. North America
- 2. Europe
- 3. Asia Pacific
- 4. South America
- 5. Middle East and Africa
Coiled Tubing Services Market REPORT HIGHLIGHTS
| Aspects | Details |
|---|---|
| Study Period | 2019-2033 |
| Base Year | 2024 |
| Estimated Year | 2025 |
| Forecast Period | 2025-2033 |
| Historical Period | 2019-2024 |
| Growth Rate | CAGR of > 6.00% from 2019-2033 |
| Segmentation |
|
Table of Contents
- 1. Introduction
- 1.1. Research Scope
- 1.2. Market Segmentation
- 1.3. Research Methodology
- 1.4. Definitions and Assumptions
- 2. Executive Summary
- 2.1. Introduction
- 3. Market Dynamics
- 3.1. Introduction
- 3.2. Market Drivers
- 3.2.1. 4.; Growing demand for natural gas and developing gas infrastructure4.; Increasing offshore oil and Gas Exploration Activities
- 3.3. Market Restrains
- 3.3.1. 4.; Adoption of Cleaner Alternatives
- 3.4. Market Trends
- 3.4.1. Well Intervention Application Segment to Dominate the Market
- 4. Market Factor Analysis
- 4.1. Porters Five Forces
- 4.2. Supply/Value Chain
- 4.3. PESTEL analysis
- 4.4. Market Entropy
- 4.5. Patent/Trademark Analysis
- 5. Global Coiled Tubing Services Market Analysis, Insights and Forecast, 2019-2031
- 5.1. Market Analysis, Insights and Forecast - by Application
- 5.1.1. Drilling
- 5.1.2. Completion
- 5.1.3. Well Intervention
- 5.2. Market Analysis, Insights and Forecast - by Location of Deployment
- 5.2.1. Onshore
- 5.2.2. Offshore
- 5.3. Market Analysis, Insights and Forecast - by Region
- 5.3.1. North America
- 5.3.2. Europe
- 5.3.3. Asia Pacific
- 5.3.4. South America
- 5.3.5. Middle East and Africa
- 5.1. Market Analysis, Insights and Forecast - by Application
- 6. North America Coiled Tubing Services Market Analysis, Insights and Forecast, 2019-2031
- 6.1. Market Analysis, Insights and Forecast - by Application
- 6.1.1. Drilling
- 6.1.2. Completion
- 6.1.3. Well Intervention
- 6.2. Market Analysis, Insights and Forecast - by Location of Deployment
- 6.2.1. Onshore
- 6.2.2. Offshore
- 6.1. Market Analysis, Insights and Forecast - by Application
- 7. Europe Coiled Tubing Services Market Analysis, Insights and Forecast, 2019-2031
- 7.1. Market Analysis, Insights and Forecast - by Application
- 7.1.1. Drilling
- 7.1.2. Completion
- 7.1.3. Well Intervention
- 7.2. Market Analysis, Insights and Forecast - by Location of Deployment
- 7.2.1. Onshore
- 7.2.2. Offshore
- 7.1. Market Analysis, Insights and Forecast - by Application
- 8. Asia Pacific Coiled Tubing Services Market Analysis, Insights and Forecast, 2019-2031
- 8.1. Market Analysis, Insights and Forecast - by Application
- 8.1.1. Drilling
- 8.1.2. Completion
- 8.1.3. Well Intervention
- 8.2. Market Analysis, Insights and Forecast - by Location of Deployment
- 8.2.1. Onshore
- 8.2.2. Offshore
- 8.1. Market Analysis, Insights and Forecast - by Application
- 9. South America Coiled Tubing Services Market Analysis, Insights and Forecast, 2019-2031
- 9.1. Market Analysis, Insights and Forecast - by Application
- 9.1.1. Drilling
- 9.1.2. Completion
- 9.1.3. Well Intervention
- 9.2. Market Analysis, Insights and Forecast - by Location of Deployment
- 9.2.1. Onshore
- 9.2.2. Offshore
- 9.1. Market Analysis, Insights and Forecast - by Application
- 10. Middle East and Africa Coiled Tubing Services Market Analysis, Insights and Forecast, 2019-2031
- 10.1. Market Analysis, Insights and Forecast - by Application
- 10.1.1. Drilling
- 10.1.2. Completion
- 10.1.3. Well Intervention
- 10.2. Market Analysis, Insights and Forecast - by Location of Deployment
- 10.2.1. Onshore
- 10.2.2. Offshore
- 10.1. Market Analysis, Insights and Forecast - by Application
- 11. North America Coiled Tubing Services Market Analysis, Insights and Forecast, 2019-2031
- 11.1. Market Analysis, Insights and Forecast - By Country/Sub-region
- 11.1.1 United States
- 11.1.2 Canada
- 11.1.3 Mexico
- 12. Europe Coiled Tubing Services Market Analysis, Insights and Forecast, 2019-2031
- 12.1. Market Analysis, Insights and Forecast - By Country/Sub-region
- 12.1.1 Germany
- 12.1.2 United Kingdom
- 12.1.3 France
- 12.1.4 Spain
- 12.1.5 Italy
- 12.1.6 Spain
- 12.1.7 Belgium
- 12.1.8 Netherland
- 12.1.9 Nordics
- 12.1.10 Rest of Europe
- 13. Asia Pacific Coiled Tubing Services Market Analysis, Insights and Forecast, 2019-2031
- 13.1. Market Analysis, Insights and Forecast - By Country/Sub-region
- 13.1.1 China
- 13.1.2 Japan
- 13.1.3 India
- 13.1.4 South Korea
- 13.1.5 Southeast Asia
- 13.1.6 Australia
- 13.1.7 Indonesia
- 13.1.8 Phillipes
- 13.1.9 Singapore
- 13.1.10 Thailandc
- 13.1.11 Rest of Asia Pacific
- 14. South America Coiled Tubing Services Market Analysis, Insights and Forecast, 2019-2031
- 14.1. Market Analysis, Insights and Forecast - By Country/Sub-region
- 14.1.1 Brazil
- 14.1.2 Argentina
- 14.1.3 Peru
- 14.1.4 Chile
- 14.1.5 Colombia
- 14.1.6 Ecuador
- 14.1.7 Venezuela
- 14.1.8 Rest of South America
- 15. North America Coiled Tubing Services Market Analysis, Insights and Forecast, 2019-2031
- 15.1. Market Analysis, Insights and Forecast - By Country/Sub-region
- 15.1.1 United States
- 15.1.2 Canada
- 15.1.3 Mexico
- 16. MEA Coiled Tubing Services Market Analysis, Insights and Forecast, 2019-2031
- 16.1. Market Analysis, Insights and Forecast - By Country/Sub-region
- 16.1.1 United Arab Emirates
- 16.1.2 Saudi Arabia
- 16.1.3 South Africa
- 16.1.4 Rest of Middle East and Africa
- 17. Competitive Analysis
- 17.1. Global Market Share Analysis 2024
- 17.2. Company Profiles
- 17.2.1 NexTier Oilfield Solutions Inc
- 17.2.1.1. Overview
- 17.2.1.2. Products
- 17.2.1.3. SWOT Analysis
- 17.2.1.4. Recent Developments
- 17.2.1.5. Financials (Based on Availability)
- 17.2.2 Superior Energy Services Inc
- 17.2.2.1. Overview
- 17.2.2.2. Products
- 17.2.2.3. SWOT Analysis
- 17.2.2.4. Recent Developments
- 17.2.2.5. Financials (Based on Availability)
- 17.2.3 RPC Inc
- 17.2.3.1. Overview
- 17.2.3.2. Products
- 17.2.3.3. SWOT Analysis
- 17.2.3.4. Recent Developments
- 17.2.3.5. Financials (Based on Availability)
- 17.2.4 Basic Energy Services Inc
- 17.2.4.1. Overview
- 17.2.4.2. Products
- 17.2.4.3. SWOT Analysis
- 17.2.4.4. Recent Developments
- 17.2.4.5. Financials (Based on Availability)
- 17.2.5 Weatherford International PLC
- 17.2.5.1. Overview
- 17.2.5.2. Products
- 17.2.5.3. SWOT Analysis
- 17.2.5.4. Recent Developments
- 17.2.5.5. Financials (Based on Availability)
- 17.2.6 Trican Well Service Ltd*List Not Exhaustive
- 17.2.6.1. Overview
- 17.2.6.2. Products
- 17.2.6.3. SWOT Analysis
- 17.2.6.4. Recent Developments
- 17.2.6.5. Financials (Based on Availability)
- 17.2.7 Baker Hughes Company
- 17.2.7.1. Overview
- 17.2.7.2. Products
- 17.2.7.3. SWOT Analysis
- 17.2.7.4. Recent Developments
- 17.2.7.5. Financials (Based on Availability)
- 17.2.8 Halliburton Company
- 17.2.8.1. Overview
- 17.2.8.2. Products
- 17.2.8.3. SWOT Analysis
- 17.2.8.4. Recent Developments
- 17.2.8.5. Financials (Based on Availability)
- 17.2.9 Schlumberger Limited
- 17.2.9.1. Overview
- 17.2.9.2. Products
- 17.2.9.3. SWOT Analysis
- 17.2.9.4. Recent Developments
- 17.2.9.5. Financials (Based on Availability)
- 17.2.10 Calfrac Well Services Ltd
- 17.2.10.1. Overview
- 17.2.10.2. Products
- 17.2.10.3. SWOT Analysis
- 17.2.10.4. Recent Developments
- 17.2.10.5. Financials (Based on Availability)
- 17.2.1 NexTier Oilfield Solutions Inc
List of Figures
- Figure 1: Global Coiled Tubing Services Market Revenue Breakdown (Million, %) by Region 2024 & 2032
- Figure 2: North America Coiled Tubing Services Market Revenue (Million), by Country 2024 & 2032
- Figure 3: North America Coiled Tubing Services Market Revenue Share (%), by Country 2024 & 2032
- Figure 4: Europe Coiled Tubing Services Market Revenue (Million), by Country 2024 & 2032
- Figure 5: Europe Coiled Tubing Services Market Revenue Share (%), by Country 2024 & 2032
- Figure 6: Asia Pacific Coiled Tubing Services Market Revenue (Million), by Country 2024 & 2032
- Figure 7: Asia Pacific Coiled Tubing Services Market Revenue Share (%), by Country 2024 & 2032
- Figure 8: South America Coiled Tubing Services Market Revenue (Million), by Country 2024 & 2032
- Figure 9: South America Coiled Tubing Services Market Revenue Share (%), by Country 2024 & 2032
- Figure 10: North America Coiled Tubing Services Market Revenue (Million), by Country 2024 & 2032
- Figure 11: North America Coiled Tubing Services Market Revenue Share (%), by Country 2024 & 2032
- Figure 12: MEA Coiled Tubing Services Market Revenue (Million), by Country 2024 & 2032
- Figure 13: MEA Coiled Tubing Services Market Revenue Share (%), by Country 2024 & 2032
- Figure 14: North America Coiled Tubing Services Market Revenue (Million), by Application 2024 & 2032
- Figure 15: North America Coiled Tubing Services Market Revenue Share (%), by Application 2024 & 2032
- Figure 16: North America Coiled Tubing Services Market Revenue (Million), by Location of Deployment 2024 & 2032
- Figure 17: North America Coiled Tubing Services Market Revenue Share (%), by Location of Deployment 2024 & 2032
- Figure 18: North America Coiled Tubing Services Market Revenue (Million), by Country 2024 & 2032
- Figure 19: North America Coiled Tubing Services Market Revenue Share (%), by Country 2024 & 2032
- Figure 20: Europe Coiled Tubing Services Market Revenue (Million), by Application 2024 & 2032
- Figure 21: Europe Coiled Tubing Services Market Revenue Share (%), by Application 2024 & 2032
- Figure 22: Europe Coiled Tubing Services Market Revenue (Million), by Location of Deployment 2024 & 2032
- Figure 23: Europe Coiled Tubing Services Market Revenue Share (%), by Location of Deployment 2024 & 2032
- Figure 24: Europe Coiled Tubing Services Market Revenue (Million), by Country 2024 & 2032
- Figure 25: Europe Coiled Tubing Services Market Revenue Share (%), by Country 2024 & 2032
- Figure 26: Asia Pacific Coiled Tubing Services Market Revenue (Million), by Application 2024 & 2032
- Figure 27: Asia Pacific Coiled Tubing Services Market Revenue Share (%), by Application 2024 & 2032
- Figure 28: Asia Pacific Coiled Tubing Services Market Revenue (Million), by Location of Deployment 2024 & 2032
- Figure 29: Asia Pacific Coiled Tubing Services Market Revenue Share (%), by Location of Deployment 2024 & 2032
- Figure 30: Asia Pacific Coiled Tubing Services Market Revenue (Million), by Country 2024 & 2032
- Figure 31: Asia Pacific Coiled Tubing Services Market Revenue Share (%), by Country 2024 & 2032
- Figure 32: South America Coiled Tubing Services Market Revenue (Million), by Application 2024 & 2032
- Figure 33: South America Coiled Tubing Services Market Revenue Share (%), by Application 2024 & 2032
- Figure 34: South America Coiled Tubing Services Market Revenue (Million), by Location of Deployment 2024 & 2032
- Figure 35: South America Coiled Tubing Services Market Revenue Share (%), by Location of Deployment 2024 & 2032
- Figure 36: South America Coiled Tubing Services Market Revenue (Million), by Country 2024 & 2032
- Figure 37: South America Coiled Tubing Services Market Revenue Share (%), by Country 2024 & 2032
- Figure 38: Middle East and Africa Coiled Tubing Services Market Revenue (Million), by Application 2024 & 2032
- Figure 39: Middle East and Africa Coiled Tubing Services Market Revenue Share (%), by Application 2024 & 2032
- Figure 40: Middle East and Africa Coiled Tubing Services Market Revenue (Million), by Location of Deployment 2024 & 2032
- Figure 41: Middle East and Africa Coiled Tubing Services Market Revenue Share (%), by Location of Deployment 2024 & 2032
- Figure 42: Middle East and Africa Coiled Tubing Services Market Revenue (Million), by Country 2024 & 2032
- Figure 43: Middle East and Africa Coiled Tubing Services Market Revenue Share (%), by Country 2024 & 2032
List of Tables
- Table 1: Global Coiled Tubing Services Market Revenue Million Forecast, by Region 2019 & 2032
- Table 2: Global Coiled Tubing Services Market Revenue Million Forecast, by Application 2019 & 2032
- Table 3: Global Coiled Tubing Services Market Revenue Million Forecast, by Location of Deployment 2019 & 2032
- Table 4: Global Coiled Tubing Services Market Revenue Million Forecast, by Region 2019 & 2032
- Table 5: Global Coiled Tubing Services Market Revenue Million Forecast, by Country 2019 & 2032
- Table 6: United States Coiled Tubing Services Market Revenue (Million) Forecast, by Application 2019 & 2032
- Table 7: Canada Coiled Tubing Services Market Revenue (Million) Forecast, by Application 2019 & 2032
- Table 8: Mexico Coiled Tubing Services Market Revenue (Million) Forecast, by Application 2019 & 2032
- Table 9: Global Coiled Tubing Services Market Revenue Million Forecast, by Country 2019 & 2032
- Table 10: Germany Coiled Tubing Services Market Revenue (Million) Forecast, by Application 2019 & 2032
- Table 11: United Kingdom Coiled Tubing Services Market Revenue (Million) Forecast, by Application 2019 & 2032
- Table 12: France Coiled Tubing Services Market Revenue (Million) Forecast, by Application 2019 & 2032
- Table 13: Spain Coiled Tubing Services Market Revenue (Million) Forecast, by Application 2019 & 2032
- Table 14: Italy Coiled Tubing Services Market Revenue (Million) Forecast, by Application 2019 & 2032
- Table 15: Spain Coiled Tubing Services Market Revenue (Million) Forecast, by Application 2019 & 2032
- Table 16: Belgium Coiled Tubing Services Market Revenue (Million) Forecast, by Application 2019 & 2032
- Table 17: Netherland Coiled Tubing Services Market Revenue (Million) Forecast, by Application 2019 & 2032
- Table 18: Nordics Coiled Tubing Services Market Revenue (Million) Forecast, by Application 2019 & 2032
- Table 19: Rest of Europe Coiled Tubing Services Market Revenue (Million) Forecast, by Application 2019 & 2032
- Table 20: Global Coiled Tubing Services Market Revenue Million Forecast, by Country 2019 & 2032
- Table 21: China Coiled Tubing Services Market Revenue (Million) Forecast, by Application 2019 & 2032
- Table 22: Japan Coiled Tubing Services Market Revenue (Million) Forecast, by Application 2019 & 2032
- Table 23: India Coiled Tubing Services Market Revenue (Million) Forecast, by Application 2019 & 2032
- Table 24: South Korea Coiled Tubing Services Market Revenue (Million) Forecast, by Application 2019 & 2032
- Table 25: Southeast Asia Coiled Tubing Services Market Revenue (Million) Forecast, by Application 2019 & 2032
- Table 26: Australia Coiled Tubing Services Market Revenue (Million) Forecast, by Application 2019 & 2032
- Table 27: Indonesia Coiled Tubing Services Market Revenue (Million) Forecast, by Application 2019 & 2032
- Table 28: Phillipes Coiled Tubing Services Market Revenue (Million) Forecast, by Application 2019 & 2032
- Table 29: Singapore Coiled Tubing Services Market Revenue (Million) Forecast, by Application 2019 & 2032
- Table 30: Thailandc Coiled Tubing Services Market Revenue (Million) Forecast, by Application 2019 & 2032
- Table 31: Rest of Asia Pacific Coiled Tubing Services Market Revenue (Million) Forecast, by Application 2019 & 2032
- Table 32: Global Coiled Tubing Services Market Revenue Million Forecast, by Country 2019 & 2032
- Table 33: Brazil Coiled Tubing Services Market Revenue (Million) Forecast, by Application 2019 & 2032
- Table 34: Argentina Coiled Tubing Services Market Revenue (Million) Forecast, by Application 2019 & 2032
- Table 35: Peru Coiled Tubing Services Market Revenue (Million) Forecast, by Application 2019 & 2032
- Table 36: Chile Coiled Tubing Services Market Revenue (Million) Forecast, by Application 2019 & 2032
- Table 37: Colombia Coiled Tubing Services Market Revenue (Million) Forecast, by Application 2019 & 2032
- Table 38: Ecuador Coiled Tubing Services Market Revenue (Million) Forecast, by Application 2019 & 2032
- Table 39: Venezuela Coiled Tubing Services Market Revenue (Million) Forecast, by Application 2019 & 2032
- Table 40: Rest of South America Coiled Tubing Services Market Revenue (Million) Forecast, by Application 2019 & 2032
- Table 41: Global Coiled Tubing Services Market Revenue Million Forecast, by Country 2019 & 2032
- Table 42: United States Coiled Tubing Services Market Revenue (Million) Forecast, by Application 2019 & 2032
- Table 43: Canada Coiled Tubing Services Market Revenue (Million) Forecast, by Application 2019 & 2032
- Table 44: Mexico Coiled Tubing Services Market Revenue (Million) Forecast, by Application 2019 & 2032
- Table 45: Global Coiled Tubing Services Market Revenue Million Forecast, by Country 2019 & 2032
- Table 46: United Arab Emirates Coiled Tubing Services Market Revenue (Million) Forecast, by Application 2019 & 2032
- Table 47: Saudi Arabia Coiled Tubing Services Market Revenue (Million) Forecast, by Application 2019 & 2032
- Table 48: South Africa Coiled Tubing Services Market Revenue (Million) Forecast, by Application 2019 & 2032
- Table 49: Rest of Middle East and Africa Coiled Tubing Services Market Revenue (Million) Forecast, by Application 2019 & 2032
- Table 50: Global Coiled Tubing Services Market Revenue Million Forecast, by Application 2019 & 2032
- Table 51: Global Coiled Tubing Services Market Revenue Million Forecast, by Location of Deployment 2019 & 2032
- Table 52: Global Coiled Tubing Services Market Revenue Million Forecast, by Country 2019 & 2032
- Table 53: Global Coiled Tubing Services Market Revenue Million Forecast, by Application 2019 & 2032
- Table 54: Global Coiled Tubing Services Market Revenue Million Forecast, by Location of Deployment 2019 & 2032
- Table 55: Global Coiled Tubing Services Market Revenue Million Forecast, by Country 2019 & 2032
- Table 56: Global Coiled Tubing Services Market Revenue Million Forecast, by Application 2019 & 2032
- Table 57: Global Coiled Tubing Services Market Revenue Million Forecast, by Location of Deployment 2019 & 2032
- Table 58: Global Coiled Tubing Services Market Revenue Million Forecast, by Country 2019 & 2032
- Table 59: Global Coiled Tubing Services Market Revenue Million Forecast, by Application 2019 & 2032
- Table 60: Global Coiled Tubing Services Market Revenue Million Forecast, by Location of Deployment 2019 & 2032
- Table 61: Global Coiled Tubing Services Market Revenue Million Forecast, by Country 2019 & 2032
- Table 62: Global Coiled Tubing Services Market Revenue Million Forecast, by Application 2019 & 2032
- Table 63: Global Coiled Tubing Services Market Revenue Million Forecast, by Location of Deployment 2019 & 2032
- Table 64: Global Coiled Tubing Services Market Revenue Million Forecast, by Country 2019 & 2032
Frequently Asked Questions
1. What is the projected Compound Annual Growth Rate (CAGR) of the Coiled Tubing Services Market?
The projected CAGR is approximately > 6.00%.
2. Which companies are prominent players in the Coiled Tubing Services Market?
Key companies in the market include NexTier Oilfield Solutions Inc, Superior Energy Services Inc, RPC Inc, Basic Energy Services Inc, Weatherford International PLC, Trican Well Service Ltd*List Not Exhaustive, Baker Hughes Company, Halliburton Company, Schlumberger Limited, Calfrac Well Services Ltd.
3. What are the main segments of the Coiled Tubing Services Market?
The market segments include Application, Location of Deployment.
4. Can you provide details about the market size?
The market size is estimated to be USD XX Million as of 2022.
5. What are some drivers contributing to market growth?
4.; Growing demand for natural gas and developing gas infrastructure4.; Increasing offshore oil and Gas Exploration Activities.
6. What are the notable trends driving market growth?
Well Intervention Application Segment to Dominate the Market.
7. Are there any restraints impacting market growth?
4.; Adoption of Cleaner Alternatives.
8. Can you provide examples of recent developments in the market?
In July 2021, The Abu Dhabi National Oil Company (ADNOC) announced an investment of USD 763.7 million (AED 2.8 billion) in integrated rigless services across six of its artificial islands in the Upper Zakum and Satah Al Razboot (SARB) fields. The scope of the contracts includes coiled tubing services with thru-tubing downhole tools, stimulation services, including equipment and chemicals/fluid systems, surface well-testing services, wireline and production logging services and tools, saturation monitoring, and well integrity.
9. What pricing options are available for accessing the report?
Pricing options include single-user, multi-user, and enterprise licenses priced at USD 4750, USD 5250, and USD 8750 respectively.
10. Is the market size provided in terms of value or volume?
The market size is provided in terms of value, measured in Million.
11. Are there any specific market keywords associated with the report?
Yes, the market keyword associated with the report is "Coiled Tubing Services Market," which aids in identifying and referencing the specific market segment covered.
12. How do I determine which pricing option suits my needs best?
The pricing options vary based on user requirements and access needs. Individual users may opt for single-user licenses, while businesses requiring broader access may choose multi-user or enterprise licenses for cost-effective access to the report.
13. Are there any additional resources or data provided in the Coiled Tubing Services Market report?
While the report offers comprehensive insights, it's advisable to review the specific contents or supplementary materials provided to ascertain if additional resources or data are available.
14. How can I stay updated on further developments or reports in the Coiled Tubing Services Market?
To stay informed about further developments, trends, and reports in the Coiled Tubing Services Market, consider subscribing to industry newsletters, following relevant companies and organizations, or regularly checking reputable industry news sources and publications.
Methodology
Step 1 - Identification of Relevant Samples Size from Population Database


Step 2 - Approaches for Defining Global Market Size (Value, Volume* & Price*)

Note*: In applicable scenarios
Step 3 - Data Sources
Primary Research
- Web Analytics
- Survey Reports
- Research Institute
- Latest Research Reports
- Opinion Leaders
Secondary Research
- Annual Reports
- White Paper
- Latest Press Release
- Industry Association
- Paid Database
- Investor Presentations

Step 4 - Data Triangulation
Involves using different sources of information in order to increase the validity of a study
These sources are likely to be stakeholders in a program - participants, other researchers, program staff, other community members, and so on.
Then we put all data in single framework & apply various statistical tools to find out the dynamic on the market.
During the analysis stage, feedback from the stakeholder groups would be compared to determine areas of agreement as well as areas of divergence


