
Key Insights
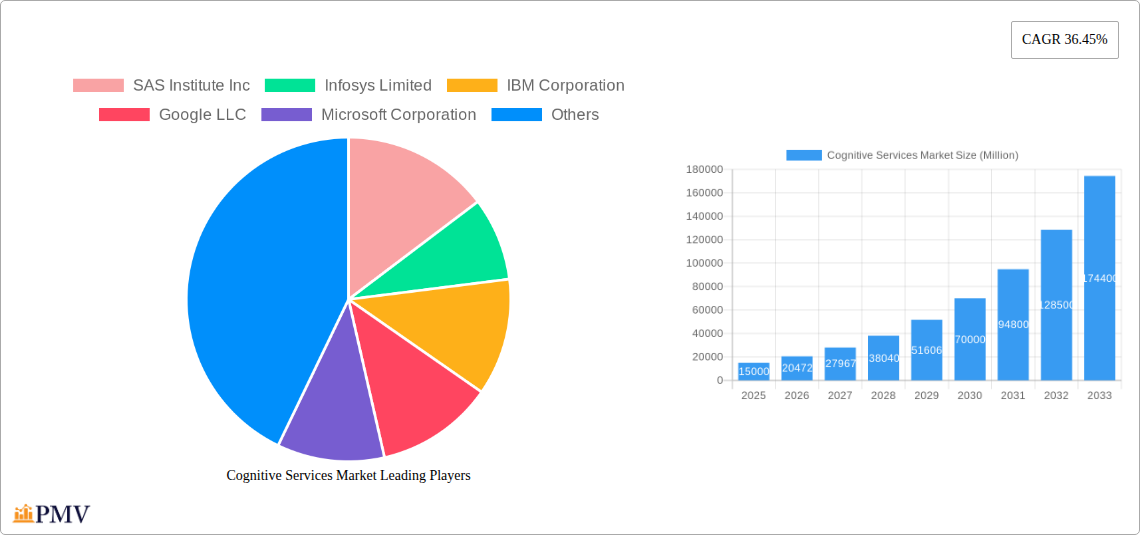
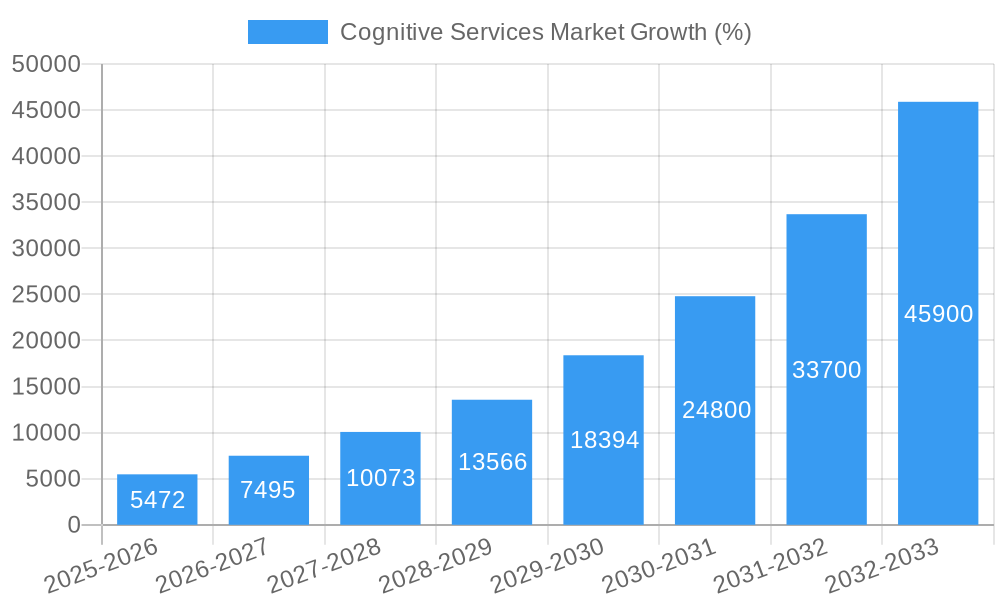
The Cognitive Services market is experiencing rapid growth, projected at a Compound Annual Growth Rate (CAGR) of 36.45% from 2025 to 2033. This surge is driven by several key factors. The increasing adoption of cloud-based solutions provides scalability and cost-effectiveness, fueling market expansion across various sectors. Furthermore, the rising need for automation and improved operational efficiency across industries like BFSI (Banking, Financial Services, and Insurance), IT & Telecommunications, and Retail is a significant catalyst. Advancements in artificial intelligence (AI) and machine learning (ML) technologies are continuously enhancing the capabilities of cognitive services, expanding their applications in areas such as customer service chatbots, fraud detection, and predictive maintenance. The market is segmented by enterprise size (Small and Medium Enterprises, Large Enterprises), end-user industry (BFSI, IT & Telecommunications, Retail, Healthcare, Others), and deployment (Cloud, On-Premise). Large enterprises are currently the major consumers, but SMEs are rapidly adopting these solutions, contributing to overall market growth. The cloud deployment model holds the largest market share due to its inherent flexibility and scalability. Geographic distribution shows strong growth across North America and Asia-Pacific, driven by technological advancements and increasing digital transformation initiatives. While the market faces some restraints, such as data security concerns and the need for skilled professionals, the overall trajectory suggests a robust and sustained expansion in the coming years.
The competitive landscape is dynamic, with key players such as SAS Institute Inc., Infosys Limited, IBM Corporation, Google LLC, Microsoft Corporation, and Amazon Web Services Inc. vying for market share. These companies are strategically investing in R&D to enhance their offerings and expand their reach across various industries. Strategic partnerships, mergers, and acquisitions are also contributing to shaping the market landscape. The future growth of the Cognitive Services market will depend on factors such as advancements in AI algorithms, improved data accessibility, increased regulatory compliance, and continued adoption of cloud-based solutions. The increasing focus on personalized customer experiences across industries further underscores the demand for advanced cognitive services. While challenges remain, the long-term outlook for this market remains overwhelmingly positive, indicating substantial growth opportunities for both established players and new entrants.
Cognitive Services Market: A Comprehensive Report (2019-2033)
This in-depth report provides a comprehensive analysis of the Cognitive Services Market, encompassing market structure, competitive dynamics, industry trends, dominant segments, product innovations, and future outlook. The study period covers 2019-2033, with 2025 as the base and estimated year. The forecast period spans 2025-2033, and the historical period encompasses 2019-2024. This report is crucial for businesses, investors, and researchers seeking actionable insights into this rapidly evolving market. The market is projected to reach xx Million by 2033.
Cognitive Services Market Structure & Competitive Dynamics
The Cognitive Services market exhibits a moderately concentrated structure, with several key players holding significant market share. Market concentration is influenced by factors such as technological advancements, regulatory frameworks, and the increasing adoption of AI across various industries. Innovation ecosystems play a crucial role, with ongoing R&D investments driving the development of new cognitive services and applications. The regulatory landscape, particularly concerning data privacy and security, presents both challenges and opportunities for market participants. Product substitution, primarily from open-source alternatives, remains a competitive pressure. End-user trends, driven by increasing demand for automation and improved decision-making capabilities, are shaping market growth.
Significant M&A activities have been observed in the market, with deal values reaching xx Million in recent years. These activities primarily focus on expanding product portfolios, enhancing technological capabilities, and securing a wider customer base.
- Market Share (2024 Estimate): Microsoft Corporation (xx%), Google LLC (xx%), Amazon Web Services Inc (xx%), IBM Corporation (xx%), Others (xx%)
- M&A Deal Value (2019-2024): xx Million
Cognitive Services Market Industry Trends & Insights
The Cognitive Services market is experiencing robust growth, driven by factors such as increasing data volumes, the proliferation of cloud computing, and rising demand for advanced analytics capabilities across diverse industries. Technological disruptions, particularly in areas like deep learning and natural language processing (NLP), are constantly reshaping the market landscape. Consumer preferences are shifting towards personalized and intuitive AI-powered solutions. Competitive dynamics are characterized by intense rivalry among major players, focusing on innovation, product differentiation, and strategic partnerships. The market is projected to experience a Compound Annual Growth Rate (CAGR) of xx% during the forecast period, with market penetration expected to reach xx% by 2033.
Dominant Markets & Segments in Cognitive Services Market
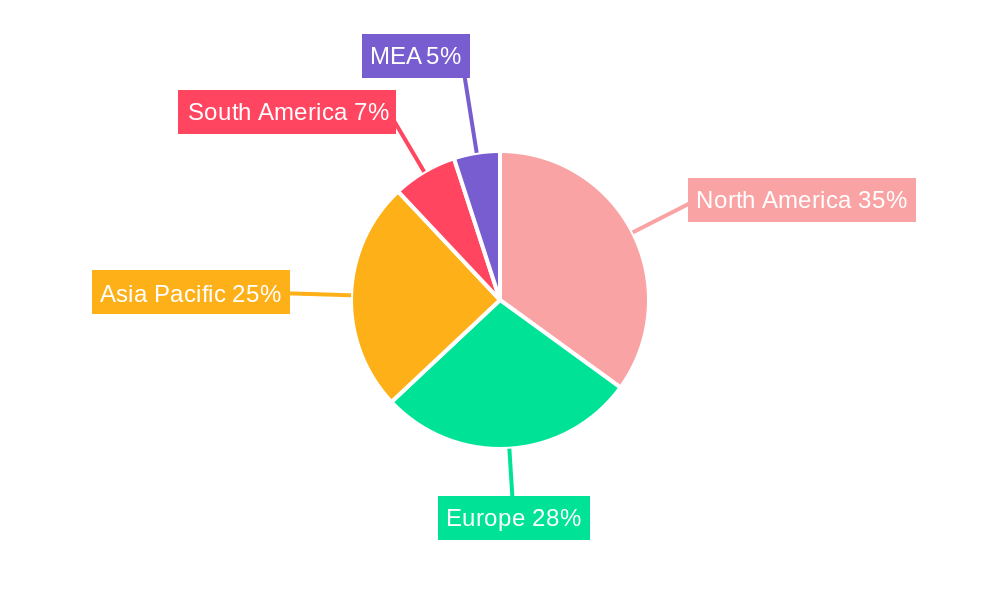
The North American region currently dominates the Cognitive Services market, driven by factors such as robust technological infrastructure, high adoption rates, and substantial investments in AI research and development. However, significant growth potential exists in other regions, particularly in Asia-Pacific, fueled by rapid digitalization and increasing government support for AI initiatives.
By Enterprise Size: Large enterprises currently account for a larger market share due to their higher investment capacity and greater need for advanced analytics. However, the SME segment is expected to exhibit faster growth during the forecast period.
By End-user Industry: BFSI and IT & Telecommunication are currently the leading end-user industries, driven by their heavy reliance on data-driven decision-making and customer service automation. However, the Healthcare and Retail sectors are poised for significant growth due to rising demand for personalized healthcare services and enhanced customer experiences.
By Deployment: Cloud-based deployments currently dominate the market, driven by scalability, cost-effectiveness, and ease of access. However, on-premise deployments continue to hold relevance in specific industries with stringent security and compliance requirements.
Key Drivers:
- North America: Strong technological infrastructure, high AI adoption rates, significant R&D investments.
- Asia-Pacific: Rapid digitalization, government support for AI initiatives, expanding tech talent pool.
- Europe: Growing adoption of AI across industries, stringent data privacy regulations driving secure solutions.
Cognitive Services Market Product Innovations
Recent product innovations in the Cognitive Services market are focused on enhancing accuracy, improving scalability, and broadening functionalities. The integration of advanced machine learning techniques, such as deep learning and reinforcement learning, is leading to more sophisticated and intelligent AI applications. This is resulting in improved capabilities in areas such as natural language understanding, image recognition, and predictive analytics. The market is witnessing the emergence of specialized cognitive services tailored to specific industry needs, further enhancing market fit and competitiveness.
Report Segmentation & Scope
This report segments the Cognitive Services market based on enterprise size (Small and Medium Enterprises, Large Enterprises), end-user industry (BFSI, IT and Telecommunication, Retail, Healthcare, Other End-user Industries), and deployment (Cloud, On-Premise). Each segment is analyzed in detail, providing insights into market size, growth projections, and competitive dynamics. The report offers granular information on market share, revenue projections, and key growth drivers for each segment.
Key Drivers of Cognitive Services Market Growth
Several factors fuel the growth of the Cognitive Services market. Technological advancements in AI and machine learning, particularly in NLP and computer vision, are continuously improving the capabilities of cognitive services. Economic factors, including increasing digitalization and the adoption of cloud computing, are driving demand. Favorable regulatory environments in some regions, promoting the development and adoption of AI, further stimulate market growth. Specific examples include the increasing use of AI-powered chatbots for customer service and the rising adoption of predictive analytics in various industries.
Challenges in the Cognitive Services Market Sector
Several challenges hinder the growth of the Cognitive Services market. Regulatory hurdles, particularly concerning data privacy and security, pose a significant constraint. Supply chain issues, related to the availability of skilled AI professionals and specialized hardware, can impact market growth. Competitive pressures, from both established players and new entrants, are intense. These factors could collectively limit market expansion by xx% by 2030 if not properly addressed.
Leading Players in the Cognitive Services Market
- SAS Institute Inc
- Infosys Limited
- IBM Corporation
- Google LLC
- Microsoft Corporation
- Tata Consultancy Services Limited
- Amazon Web Services Inc
- Wipro Limited
- Nokia Corporation
- Enterra Solutions LLC
- Attivio Inc
Key Developments in Cognitive Services Market Sector
- August 2022: Jio Haptik collaborated with Microsoft Azure Cognitive Services to enhance Hindi conversational AI, enabling multilingual customer experiences and addressing 2M+ local language queries.
- May 2022: Microsoft Corporation expanded its partnership with OpenAI, launching a new Azure Cognitive Services offering access to GPT-3, Codex, and embedding models for developers.
Strategic Cognitive Services Market Outlook
The Cognitive Services market holds significant future potential, driven by continued technological advancements, increased adoption across various industries, and expanding global digitalization. Strategic opportunities exist in developing specialized cognitive services for niche markets, leveraging emerging technologies like edge AI and quantum computing, and forging strategic partnerships to expand market reach. Focus on addressing data privacy concerns and building robust security measures will be crucial for sustained growth.
Cognitive Services Market Segmentation
-
1. Deployment
- 1.1. Cloud
- 1.2. On-Premise
-
2. Enterprise Size
- 2.1. Small and Medium Emterprises
- 2.2. Large Enterprises
-
3. End-user Industry
- 3.1. BFSI
- 3.2. IT and Telecommunication
- 3.3. Retail
- 3.4. Healthcare
- 3.5. Other End-user Industries
Cognitive Services Market Segmentation By Geography
-
1. North America
- 1.1. United States
- 1.2. Canada
-
2. Europe
- 2.1. United Kingdom
- 2.2. Germany
- 2.3. France
- 2.4. Rest of Europe
-
3. Asia Pacific
- 3.1. China
- 3.2. Japan
- 3.3. India
- 3.4. Rest of Asia Pacific
-
4. Latin America
- 4.1. Brazil
- 4.2. Mexico
- 4.3. Rest of Latin America
- 5. Middle East
Cognitive Services Market REPORT HIGHLIGHTS
| Aspects | Details |
|---|---|
| Study Period | 2019-2033 |
| Base Year | 2024 |
| Estimated Year | 2025 |
| Forecast Period | 2025-2033 |
| Historical Period | 2019-2024 |
| Growth Rate | CAGR of 36.45% from 2019-2033 |
| Segmentation |
|
Table of Contents
- 1. Introduction
- 1.1. Research Scope
- 1.2. Market Segmentation
- 1.3. Research Methodology
- 1.4. Definitions and Assumptions
- 2. Executive Summary
- 2.1. Introduction
- 3. Market Dynamics
- 3.1. Introduction
- 3.2. Market Drivers
- 3.2.1. Growing Adoption of Intelligent APIs to Build Smarter Applications; Increase in Data Volume and Complexity
- 3.3. Market Restrains
- 3.3.1. High Cost Incorporated with the Implementation
- 3.4. Market Trends
- 3.4.1. IT and Telecommunication Segment to Grow Significantly
- 4. Market Factor Analysis
- 4.1. Porters Five Forces
- 4.2. Supply/Value Chain
- 4.3. PESTEL analysis
- 4.4. Market Entropy
- 4.5. Patent/Trademark Analysis
- 5. Global Cognitive Services Market Analysis, Insights and Forecast, 2019-2031
- 5.1. Market Analysis, Insights and Forecast - by Deployment
- 5.1.1. Cloud
- 5.1.2. On-Premise
- 5.2. Market Analysis, Insights and Forecast - by Enterprise Size
- 5.2.1. Small and Medium Emterprises
- 5.2.2. Large Enterprises
- 5.3. Market Analysis, Insights and Forecast - by End-user Industry
- 5.3.1. BFSI
- 5.3.2. IT and Telecommunication
- 5.3.3. Retail
- 5.3.4. Healthcare
- 5.3.5. Other End-user Industries
- 5.4. Market Analysis, Insights and Forecast - by Region
- 5.4.1. North America
- 5.4.2. Europe
- 5.4.3. Asia Pacific
- 5.4.4. Latin America
- 5.4.5. Middle East
- 5.1. Market Analysis, Insights and Forecast - by Deployment
- 6. North America Cognitive Services Market Analysis, Insights and Forecast, 2019-2031
- 6.1. Market Analysis, Insights and Forecast - by Deployment
- 6.1.1. Cloud
- 6.1.2. On-Premise
- 6.2. Market Analysis, Insights and Forecast - by Enterprise Size
- 6.2.1. Small and Medium Emterprises
- 6.2.2. Large Enterprises
- 6.3. Market Analysis, Insights and Forecast - by End-user Industry
- 6.3.1. BFSI
- 6.3.2. IT and Telecommunication
- 6.3.3. Retail
- 6.3.4. Healthcare
- 6.3.5. Other End-user Industries
- 6.1. Market Analysis, Insights and Forecast - by Deployment
- 7. Europe Cognitive Services Market Analysis, Insights and Forecast, 2019-2031
- 7.1. Market Analysis, Insights and Forecast - by Deployment
- 7.1.1. Cloud
- 7.1.2. On-Premise
- 7.2. Market Analysis, Insights and Forecast - by Enterprise Size
- 7.2.1. Small and Medium Emterprises
- 7.2.2. Large Enterprises
- 7.3. Market Analysis, Insights and Forecast - by End-user Industry
- 7.3.1. BFSI
- 7.3.2. IT and Telecommunication
- 7.3.3. Retail
- 7.3.4. Healthcare
- 7.3.5. Other End-user Industries
- 7.1. Market Analysis, Insights and Forecast - by Deployment
- 8. Asia Pacific Cognitive Services Market Analysis, Insights and Forecast, 2019-2031
- 8.1. Market Analysis, Insights and Forecast - by Deployment
- 8.1.1. Cloud
- 8.1.2. On-Premise
- 8.2. Market Analysis, Insights and Forecast - by Enterprise Size
- 8.2.1. Small and Medium Emterprises
- 8.2.2. Large Enterprises
- 8.3. Market Analysis, Insights and Forecast - by End-user Industry
- 8.3.1. BFSI
- 8.3.2. IT and Telecommunication
- 8.3.3. Retail
- 8.3.4. Healthcare
- 8.3.5. Other End-user Industries
- 8.1. Market Analysis, Insights and Forecast - by Deployment
- 9. Latin America Cognitive Services Market Analysis, Insights and Forecast, 2019-2031
- 9.1. Market Analysis, Insights and Forecast - by Deployment
- 9.1.1. Cloud
- 9.1.2. On-Premise
- 9.2. Market Analysis, Insights and Forecast - by Enterprise Size
- 9.2.1. Small and Medium Emterprises
- 9.2.2. Large Enterprises
- 9.3. Market Analysis, Insights and Forecast - by End-user Industry
- 9.3.1. BFSI
- 9.3.2. IT and Telecommunication
- 9.3.3. Retail
- 9.3.4. Healthcare
- 9.3.5. Other End-user Industries
- 9.1. Market Analysis, Insights and Forecast - by Deployment
- 10. Middle East Cognitive Services Market Analysis, Insights and Forecast, 2019-2031
- 10.1. Market Analysis, Insights and Forecast - by Deployment
- 10.1.1. Cloud
- 10.1.2. On-Premise
- 10.2. Market Analysis, Insights and Forecast - by Enterprise Size
- 10.2.1. Small and Medium Emterprises
- 10.2.2. Large Enterprises
- 10.3. Market Analysis, Insights and Forecast - by End-user Industry
- 10.3.1. BFSI
- 10.3.2. IT and Telecommunication
- 10.3.3. Retail
- 10.3.4. Healthcare
- 10.3.5. Other End-user Industries
- 10.1. Market Analysis, Insights and Forecast - by Deployment
- 11. North America Cognitive Services Market Analysis, Insights and Forecast, 2019-2031
- 11.1. Market Analysis, Insights and Forecast - By Country/Sub-region
- 11.1.1 United States
- 11.1.2 Canada
- 11.1.3 Mexico
- 12. Europe Cognitive Services Market Analysis, Insights and Forecast, 2019-2031
- 12.1. Market Analysis, Insights and Forecast - By Country/Sub-region
- 12.1.1 Germany
- 12.1.2 United Kingdom
- 12.1.3 France
- 12.1.4 Spain
- 12.1.5 Italy
- 12.1.6 Spain
- 12.1.7 Belgium
- 12.1.8 Netherland
- 12.1.9 Nordics
- 12.1.10 Rest of Europe
- 13. Asia Pacific Cognitive Services Market Analysis, Insights and Forecast, 2019-2031
- 13.1. Market Analysis, Insights and Forecast - By Country/Sub-region
- 13.1.1 China
- 13.1.2 Japan
- 13.1.3 India
- 13.1.4 South Korea
- 13.1.5 Southeast Asia
- 13.1.6 Australia
- 13.1.7 Indonesia
- 13.1.8 Phillipes
- 13.1.9 Singapore
- 13.1.10 Thailandc
- 13.1.11 Rest of Asia Pacific
- 14. South America Cognitive Services Market Analysis, Insights and Forecast, 2019-2031
- 14.1. Market Analysis, Insights and Forecast - By Country/Sub-region
- 14.1.1 Brazil
- 14.1.2 Argentina
- 14.1.3 Peru
- 14.1.4 Chile
- 14.1.5 Colombia
- 14.1.6 Ecuador
- 14.1.7 Venezuela
- 14.1.8 Rest of South America
- 15. North America Cognitive Services Market Analysis, Insights and Forecast, 2019-2031
- 15.1. Market Analysis, Insights and Forecast - By Country/Sub-region
- 15.1.1 United States
- 15.1.2 Canada
- 15.1.3 Mexico
- 16. MEA Cognitive Services Market Analysis, Insights and Forecast, 2019-2031
- 16.1. Market Analysis, Insights and Forecast - By Country/Sub-region
- 16.1.1 United Arab Emirates
- 16.1.2 Saudi Arabia
- 16.1.3 South Africa
- 16.1.4 Rest of Middle East and Africa
- 17. Competitive Analysis
- 17.1. Global Market Share Analysis 2024
- 17.2. Company Profiles
- 17.2.1 SAS Institute Inc
- 17.2.1.1. Overview
- 17.2.1.2. Products
- 17.2.1.3. SWOT Analysis
- 17.2.1.4. Recent Developments
- 17.2.1.5. Financials (Based on Availability)
- 17.2.2 Infosys Limited
- 17.2.2.1. Overview
- 17.2.2.2. Products
- 17.2.2.3. SWOT Analysis
- 17.2.2.4. Recent Developments
- 17.2.2.5. Financials (Based on Availability)
- 17.2.3 IBM Corporation
- 17.2.3.1. Overview
- 17.2.3.2. Products
- 17.2.3.3. SWOT Analysis
- 17.2.3.4. Recent Developments
- 17.2.3.5. Financials (Based on Availability)
- 17.2.4 Google LLC
- 17.2.4.1. Overview
- 17.2.4.2. Products
- 17.2.4.3. SWOT Analysis
- 17.2.4.4. Recent Developments
- 17.2.4.5. Financials (Based on Availability)
- 17.2.5 Microsoft Corporation
- 17.2.5.1. Overview
- 17.2.5.2. Products
- 17.2.5.3. SWOT Analysis
- 17.2.5.4. Recent Developments
- 17.2.5.5. Financials (Based on Availability)
- 17.2.6 Tata Consultancy Services Limited
- 17.2.6.1. Overview
- 17.2.6.2. Products
- 17.2.6.3. SWOT Analysis
- 17.2.6.4. Recent Developments
- 17.2.6.5. Financials (Based on Availability)
- 17.2.7 Amazon Web Services Inc
- 17.2.7.1. Overview
- 17.2.7.2. Products
- 17.2.7.3. SWOT Analysis
- 17.2.7.4. Recent Developments
- 17.2.7.5. Financials (Based on Availability)
- 17.2.8 Wipro Limited
- 17.2.8.1. Overview
- 17.2.8.2. Products
- 17.2.8.3. SWOT Analysis
- 17.2.8.4. Recent Developments
- 17.2.8.5. Financials (Based on Availability)
- 17.2.9 Nokia Corporation
- 17.2.9.1. Overview
- 17.2.9.2. Products
- 17.2.9.3. SWOT Analysis
- 17.2.9.4. Recent Developments
- 17.2.9.5. Financials (Based on Availability)
- 17.2.10 Enterra Solutions LLC
- 17.2.10.1. Overview
- 17.2.10.2. Products
- 17.2.10.3. SWOT Analysis
- 17.2.10.4. Recent Developments
- 17.2.10.5. Financials (Based on Availability)
- 17.2.11 Attivio Inc
- 17.2.11.1. Overview
- 17.2.11.2. Products
- 17.2.11.3. SWOT Analysis
- 17.2.11.4. Recent Developments
- 17.2.11.5. Financials (Based on Availability)
- 17.2.1 SAS Institute Inc
List of Figures
- Figure 1: Global Cognitive Services Market Revenue Breakdown (Million, %) by Region 2024 & 2032
- Figure 2: Global Cognitive Services Market Volume Breakdown (K Unit, %) by Region 2024 & 2032
- Figure 3: North America Cognitive Services Market Revenue (Million), by Country 2024 & 2032
- Figure 4: North America Cognitive Services Market Volume (K Unit), by Country 2024 & 2032
- Figure 5: North America Cognitive Services Market Revenue Share (%), by Country 2024 & 2032
- Figure 6: North America Cognitive Services Market Volume Share (%), by Country 2024 & 2032
- Figure 7: Europe Cognitive Services Market Revenue (Million), by Country 2024 & 2032
- Figure 8: Europe Cognitive Services Market Volume (K Unit), by Country 2024 & 2032
- Figure 9: Europe Cognitive Services Market Revenue Share (%), by Country 2024 & 2032
- Figure 10: Europe Cognitive Services Market Volume Share (%), by Country 2024 & 2032
- Figure 11: Asia Pacific Cognitive Services Market Revenue (Million), by Country 2024 & 2032
- Figure 12: Asia Pacific Cognitive Services Market Volume (K Unit), by Country 2024 & 2032
- Figure 13: Asia Pacific Cognitive Services Market Revenue Share (%), by Country 2024 & 2032
- Figure 14: Asia Pacific Cognitive Services Market Volume Share (%), by Country 2024 & 2032
- Figure 15: South America Cognitive Services Market Revenue (Million), by Country 2024 & 2032
- Figure 16: South America Cognitive Services Market Volume (K Unit), by Country 2024 & 2032
- Figure 17: South America Cognitive Services Market Revenue Share (%), by Country 2024 & 2032
- Figure 18: South America Cognitive Services Market Volume Share (%), by Country 2024 & 2032
- Figure 19: North America Cognitive Services Market Revenue (Million), by Country 2024 & 2032
- Figure 20: North America Cognitive Services Market Volume (K Unit), by Country 2024 & 2032
- Figure 21: North America Cognitive Services Market Revenue Share (%), by Country 2024 & 2032
- Figure 22: North America Cognitive Services Market Volume Share (%), by Country 2024 & 2032
- Figure 23: MEA Cognitive Services Market Revenue (Million), by Country 2024 & 2032
- Figure 24: MEA Cognitive Services Market Volume (K Unit), by Country 2024 & 2032
- Figure 25: MEA Cognitive Services Market Revenue Share (%), by Country 2024 & 2032
- Figure 26: MEA Cognitive Services Market Volume Share (%), by Country 2024 & 2032
- Figure 27: North America Cognitive Services Market Revenue (Million), by Deployment 2024 & 2032
- Figure 28: North America Cognitive Services Market Volume (K Unit), by Deployment 2024 & 2032
- Figure 29: North America Cognitive Services Market Revenue Share (%), by Deployment 2024 & 2032
- Figure 30: North America Cognitive Services Market Volume Share (%), by Deployment 2024 & 2032
- Figure 31: North America Cognitive Services Market Revenue (Million), by Enterprise Size 2024 & 2032
- Figure 32: North America Cognitive Services Market Volume (K Unit), by Enterprise Size 2024 & 2032
- Figure 33: North America Cognitive Services Market Revenue Share (%), by Enterprise Size 2024 & 2032
- Figure 34: North America Cognitive Services Market Volume Share (%), by Enterprise Size 2024 & 2032
- Figure 35: North America Cognitive Services Market Revenue (Million), by End-user Industry 2024 & 2032
- Figure 36: North America Cognitive Services Market Volume (K Unit), by End-user Industry 2024 & 2032
- Figure 37: North America Cognitive Services Market Revenue Share (%), by End-user Industry 2024 & 2032
- Figure 38: North America Cognitive Services Market Volume Share (%), by End-user Industry 2024 & 2032
- Figure 39: North America Cognitive Services Market Revenue (Million), by Country 2024 & 2032
- Figure 40: North America Cognitive Services Market Volume (K Unit), by Country 2024 & 2032
- Figure 41: North America Cognitive Services Market Revenue Share (%), by Country 2024 & 2032
- Figure 42: North America Cognitive Services Market Volume Share (%), by Country 2024 & 2032
- Figure 43: Europe Cognitive Services Market Revenue (Million), by Deployment 2024 & 2032
- Figure 44: Europe Cognitive Services Market Volume (K Unit), by Deployment 2024 & 2032
- Figure 45: Europe Cognitive Services Market Revenue Share (%), by Deployment 2024 & 2032
- Figure 46: Europe Cognitive Services Market Volume Share (%), by Deployment 2024 & 2032
- Figure 47: Europe Cognitive Services Market Revenue (Million), by Enterprise Size 2024 & 2032
- Figure 48: Europe Cognitive Services Market Volume (K Unit), by Enterprise Size 2024 & 2032
- Figure 49: Europe Cognitive Services Market Revenue Share (%), by Enterprise Size 2024 & 2032
- Figure 50: Europe Cognitive Services Market Volume Share (%), by Enterprise Size 2024 & 2032
- Figure 51: Europe Cognitive Services Market Revenue (Million), by End-user Industry 2024 & 2032
- Figure 52: Europe Cognitive Services Market Volume (K Unit), by End-user Industry 2024 & 2032
- Figure 53: Europe Cognitive Services Market Revenue Share (%), by End-user Industry 2024 & 2032
- Figure 54: Europe Cognitive Services Market Volume Share (%), by End-user Industry 2024 & 2032
- Figure 55: Europe Cognitive Services Market Revenue (Million), by Country 2024 & 2032
- Figure 56: Europe Cognitive Services Market Volume (K Unit), by Country 2024 & 2032
- Figure 57: Europe Cognitive Services Market Revenue Share (%), by Country 2024 & 2032
- Figure 58: Europe Cognitive Services Market Volume Share (%), by Country 2024 & 2032
- Figure 59: Asia Pacific Cognitive Services Market Revenue (Million), by Deployment 2024 & 2032
- Figure 60: Asia Pacific Cognitive Services Market Volume (K Unit), by Deployment 2024 & 2032
- Figure 61: Asia Pacific Cognitive Services Market Revenue Share (%), by Deployment 2024 & 2032
- Figure 62: Asia Pacific Cognitive Services Market Volume Share (%), by Deployment 2024 & 2032
- Figure 63: Asia Pacific Cognitive Services Market Revenue (Million), by Enterprise Size 2024 & 2032
- Figure 64: Asia Pacific Cognitive Services Market Volume (K Unit), by Enterprise Size 2024 & 2032
- Figure 65: Asia Pacific Cognitive Services Market Revenue Share (%), by Enterprise Size 2024 & 2032
- Figure 66: Asia Pacific Cognitive Services Market Volume Share (%), by Enterprise Size 2024 & 2032
- Figure 67: Asia Pacific Cognitive Services Market Revenue (Million), by End-user Industry 2024 & 2032
- Figure 68: Asia Pacific Cognitive Services Market Volume (K Unit), by End-user Industry 2024 & 2032
- Figure 69: Asia Pacific Cognitive Services Market Revenue Share (%), by End-user Industry 2024 & 2032
- Figure 70: Asia Pacific Cognitive Services Market Volume Share (%), by End-user Industry 2024 & 2032
- Figure 71: Asia Pacific Cognitive Services Market Revenue (Million), by Country 2024 & 2032
- Figure 72: Asia Pacific Cognitive Services Market Volume (K Unit), by Country 2024 & 2032
- Figure 73: Asia Pacific Cognitive Services Market Revenue Share (%), by Country 2024 & 2032
- Figure 74: Asia Pacific Cognitive Services Market Volume Share (%), by Country 2024 & 2032
- Figure 75: Latin America Cognitive Services Market Revenue (Million), by Deployment 2024 & 2032
- Figure 76: Latin America Cognitive Services Market Volume (K Unit), by Deployment 2024 & 2032
- Figure 77: Latin America Cognitive Services Market Revenue Share (%), by Deployment 2024 & 2032
- Figure 78: Latin America Cognitive Services Market Volume Share (%), by Deployment 2024 & 2032
- Figure 79: Latin America Cognitive Services Market Revenue (Million), by Enterprise Size 2024 & 2032
- Figure 80: Latin America Cognitive Services Market Volume (K Unit), by Enterprise Size 2024 & 2032
- Figure 81: Latin America Cognitive Services Market Revenue Share (%), by Enterprise Size 2024 & 2032
- Figure 82: Latin America Cognitive Services Market Volume Share (%), by Enterprise Size 2024 & 2032
- Figure 83: Latin America Cognitive Services Market Revenue (Million), by End-user Industry 2024 & 2032
- Figure 84: Latin America Cognitive Services Market Volume (K Unit), by End-user Industry 2024 & 2032
- Figure 85: Latin America Cognitive Services Market Revenue Share (%), by End-user Industry 2024 & 2032
- Figure 86: Latin America Cognitive Services Market Volume Share (%), by End-user Industry 2024 & 2032
- Figure 87: Latin America Cognitive Services Market Revenue (Million), by Country 2024 & 2032
- Figure 88: Latin America Cognitive Services Market Volume (K Unit), by Country 2024 & 2032
- Figure 89: Latin America Cognitive Services Market Revenue Share (%), by Country 2024 & 2032
- Figure 90: Latin America Cognitive Services Market Volume Share (%), by Country 2024 & 2032
- Figure 91: Middle East Cognitive Services Market Revenue (Million), by Deployment 2024 & 2032
- Figure 92: Middle East Cognitive Services Market Volume (K Unit), by Deployment 2024 & 2032
- Figure 93: Middle East Cognitive Services Market Revenue Share (%), by Deployment 2024 & 2032
- Figure 94: Middle East Cognitive Services Market Volume Share (%), by Deployment 2024 & 2032
- Figure 95: Middle East Cognitive Services Market Revenue (Million), by Enterprise Size 2024 & 2032
- Figure 96: Middle East Cognitive Services Market Volume (K Unit), by Enterprise Size 2024 & 2032
- Figure 97: Middle East Cognitive Services Market Revenue Share (%), by Enterprise Size 2024 & 2032
- Figure 98: Middle East Cognitive Services Market Volume Share (%), by Enterprise Size 2024 & 2032
- Figure 99: Middle East Cognitive Services Market Revenue (Million), by End-user Industry 2024 & 2032
- Figure 100: Middle East Cognitive Services Market Volume (K Unit), by End-user Industry 2024 & 2032
- Figure 101: Middle East Cognitive Services Market Revenue Share (%), by End-user Industry 2024 & 2032
- Figure 102: Middle East Cognitive Services Market Volume Share (%), by End-user Industry 2024 & 2032
- Figure 103: Middle East Cognitive Services Market Revenue (Million), by Country 2024 & 2032
- Figure 104: Middle East Cognitive Services Market Volume (K Unit), by Country 2024 & 2032
- Figure 105: Middle East Cognitive Services Market Revenue Share (%), by Country 2024 & 2032
- Figure 106: Middle East Cognitive Services Market Volume Share (%), by Country 2024 & 2032
List of Tables
- Table 1: Global Cognitive Services Market Revenue Million Forecast, by Region 2019 & 2032
- Table 2: Global Cognitive Services Market Volume K Unit Forecast, by Region 2019 & 2032
- Table 3: Global Cognitive Services Market Revenue Million Forecast, by Deployment 2019 & 2032
- Table 4: Global Cognitive Services Market Volume K Unit Forecast, by Deployment 2019 & 2032
- Table 5: Global Cognitive Services Market Revenue Million Forecast, by Enterprise Size 2019 & 2032
- Table 6: Global Cognitive Services Market Volume K Unit Forecast, by Enterprise Size 2019 & 2032
- Table 7: Global Cognitive Services Market Revenue Million Forecast, by End-user Industry 2019 & 2032
- Table 8: Global Cognitive Services Market Volume K Unit Forecast, by End-user Industry 2019 & 2032
- Table 9: Global Cognitive Services Market Revenue Million Forecast, by Region 2019 & 2032
- Table 10: Global Cognitive Services Market Volume K Unit Forecast, by Region 2019 & 2032
- Table 11: Global Cognitive Services Market Revenue Million Forecast, by Country 2019 & 2032
- Table 12: Global Cognitive Services Market Volume K Unit Forecast, by Country 2019 & 2032
- Table 13: United States Cognitive Services Market Revenue (Million) Forecast, by Application 2019 & 2032
- Table 14: United States Cognitive Services Market Volume (K Unit) Forecast, by Application 2019 & 2032
- Table 15: Canada Cognitive Services Market Revenue (Million) Forecast, by Application 2019 & 2032
- Table 16: Canada Cognitive Services Market Volume (K Unit) Forecast, by Application 2019 & 2032
- Table 17: Mexico Cognitive Services Market Revenue (Million) Forecast, by Application 2019 & 2032
- Table 18: Mexico Cognitive Services Market Volume (K Unit) Forecast, by Application 2019 & 2032
- Table 19: Global Cognitive Services Market Revenue Million Forecast, by Country 2019 & 2032
- Table 20: Global Cognitive Services Market Volume K Unit Forecast, by Country 2019 & 2032
- Table 21: Germany Cognitive Services Market Revenue (Million) Forecast, by Application 2019 & 2032
- Table 22: Germany Cognitive Services Market Volume (K Unit) Forecast, by Application 2019 & 2032
- Table 23: United Kingdom Cognitive Services Market Revenue (Million) Forecast, by Application 2019 & 2032
- Table 24: United Kingdom Cognitive Services Market Volume (K Unit) Forecast, by Application 2019 & 2032
- Table 25: France Cognitive Services Market Revenue (Million) Forecast, by Application 2019 & 2032
- Table 26: France Cognitive Services Market Volume (K Unit) Forecast, by Application 2019 & 2032
- Table 27: Spain Cognitive Services Market Revenue (Million) Forecast, by Application 2019 & 2032
- Table 28: Spain Cognitive Services Market Volume (K Unit) Forecast, by Application 2019 & 2032
- Table 29: Italy Cognitive Services Market Revenue (Million) Forecast, by Application 2019 & 2032
- Table 30: Italy Cognitive Services Market Volume (K Unit) Forecast, by Application 2019 & 2032
- Table 31: Spain Cognitive Services Market Revenue (Million) Forecast, by Application 2019 & 2032
- Table 32: Spain Cognitive Services Market Volume (K Unit) Forecast, by Application 2019 & 2032
- Table 33: Belgium Cognitive Services Market Revenue (Million) Forecast, by Application 2019 & 2032
- Table 34: Belgium Cognitive Services Market Volume (K Unit) Forecast, by Application 2019 & 2032
- Table 35: Netherland Cognitive Services Market Revenue (Million) Forecast, by Application 2019 & 2032
- Table 36: Netherland Cognitive Services Market Volume (K Unit) Forecast, by Application 2019 & 2032
- Table 37: Nordics Cognitive Services Market Revenue (Million) Forecast, by Application 2019 & 2032
- Table 38: Nordics Cognitive Services Market Volume (K Unit) Forecast, by Application 2019 & 2032
- Table 39: Rest of Europe Cognitive Services Market Revenue (Million) Forecast, by Application 2019 & 2032
- Table 40: Rest of Europe Cognitive Services Market Volume (K Unit) Forecast, by Application 2019 & 2032
- Table 41: Global Cognitive Services Market Revenue Million Forecast, by Country 2019 & 2032
- Table 42: Global Cognitive Services Market Volume K Unit Forecast, by Country 2019 & 2032
- Table 43: China Cognitive Services Market Revenue (Million) Forecast, by Application 2019 & 2032
- Table 44: China Cognitive Services Market Volume (K Unit) Forecast, by Application 2019 & 2032
- Table 45: Japan Cognitive Services Market Revenue (Million) Forecast, by Application 2019 & 2032
- Table 46: Japan Cognitive Services Market Volume (K Unit) Forecast, by Application 2019 & 2032
- Table 47: India Cognitive Services Market Revenue (Million) Forecast, by Application 2019 & 2032
- Table 48: India Cognitive Services Market Volume (K Unit) Forecast, by Application 2019 & 2032
- Table 49: South Korea Cognitive Services Market Revenue (Million) Forecast, by Application 2019 & 2032
- Table 50: South Korea Cognitive Services Market Volume (K Unit) Forecast, by Application 2019 & 2032
- Table 51: Southeast Asia Cognitive Services Market Revenue (Million) Forecast, by Application 2019 & 2032
- Table 52: Southeast Asia Cognitive Services Market Volume (K Unit) Forecast, by Application 2019 & 2032
- Table 53: Australia Cognitive Services Market Revenue (Million) Forecast, by Application 2019 & 2032
- Table 54: Australia Cognitive Services Market Volume (K Unit) Forecast, by Application 2019 & 2032
- Table 55: Indonesia Cognitive Services Market Revenue (Million) Forecast, by Application 2019 & 2032
- Table 56: Indonesia Cognitive Services Market Volume (K Unit) Forecast, by Application 2019 & 2032
- Table 57: Phillipes Cognitive Services Market Revenue (Million) Forecast, by Application 2019 & 2032
- Table 58: Phillipes Cognitive Services Market Volume (K Unit) Forecast, by Application 2019 & 2032
- Table 59: Singapore Cognitive Services Market Revenue (Million) Forecast, by Application 2019 & 2032
- Table 60: Singapore Cognitive Services Market Volume (K Unit) Forecast, by Application 2019 & 2032
- Table 61: Thailandc Cognitive Services Market Revenue (Million) Forecast, by Application 2019 & 2032
- Table 62: Thailandc Cognitive Services Market Volume (K Unit) Forecast, by Application 2019 & 2032
- Table 63: Rest of Asia Pacific Cognitive Services Market Revenue (Million) Forecast, by Application 2019 & 2032
- Table 64: Rest of Asia Pacific Cognitive Services Market Volume (K Unit) Forecast, by Application 2019 & 2032
- Table 65: Global Cognitive Services Market Revenue Million Forecast, by Country 2019 & 2032
- Table 66: Global Cognitive Services Market Volume K Unit Forecast, by Country 2019 & 2032
- Table 67: Brazil Cognitive Services Market Revenue (Million) Forecast, by Application 2019 & 2032
- Table 68: Brazil Cognitive Services Market Volume (K Unit) Forecast, by Application 2019 & 2032
- Table 69: Argentina Cognitive Services Market Revenue (Million) Forecast, by Application 2019 & 2032
- Table 70: Argentina Cognitive Services Market Volume (K Unit) Forecast, by Application 2019 & 2032
- Table 71: Peru Cognitive Services Market Revenue (Million) Forecast, by Application 2019 & 2032
- Table 72: Peru Cognitive Services Market Volume (K Unit) Forecast, by Application 2019 & 2032
- Table 73: Chile Cognitive Services Market Revenue (Million) Forecast, by Application 2019 & 2032
- Table 74: Chile Cognitive Services Market Volume (K Unit) Forecast, by Application 2019 & 2032
- Table 75: Colombia Cognitive Services Market Revenue (Million) Forecast, by Application 2019 & 2032
- Table 76: Colombia Cognitive Services Market Volume (K Unit) Forecast, by Application 2019 & 2032
- Table 77: Ecuador Cognitive Services Market Revenue (Million) Forecast, by Application 2019 & 2032
- Table 78: Ecuador Cognitive Services Market Volume (K Unit) Forecast, by Application 2019 & 2032
- Table 79: Venezuela Cognitive Services Market Revenue (Million) Forecast, by Application 2019 & 2032
- Table 80: Venezuela Cognitive Services Market Volume (K Unit) Forecast, by Application 2019 & 2032
- Table 81: Rest of South America Cognitive Services Market Revenue (Million) Forecast, by Application 2019 & 2032
- Table 82: Rest of South America Cognitive Services Market Volume (K Unit) Forecast, by Application 2019 & 2032
- Table 83: Global Cognitive Services Market Revenue Million Forecast, by Country 2019 & 2032
- Table 84: Global Cognitive Services Market Volume K Unit Forecast, by Country 2019 & 2032
- Table 85: United States Cognitive Services Market Revenue (Million) Forecast, by Application 2019 & 2032
- Table 86: United States Cognitive Services Market Volume (K Unit) Forecast, by Application 2019 & 2032
- Table 87: Canada Cognitive Services Market Revenue (Million) Forecast, by Application 2019 & 2032
- Table 88: Canada Cognitive Services Market Volume (K Unit) Forecast, by Application 2019 & 2032
- Table 89: Mexico Cognitive Services Market Revenue (Million) Forecast, by Application 2019 & 2032
- Table 90: Mexico Cognitive Services Market Volume (K Unit) Forecast, by Application 2019 & 2032
- Table 91: Global Cognitive Services Market Revenue Million Forecast, by Country 2019 & 2032
- Table 92: Global Cognitive Services Market Volume K Unit Forecast, by Country 2019 & 2032
- Table 93: United Arab Emirates Cognitive Services Market Revenue (Million) Forecast, by Application 2019 & 2032
- Table 94: United Arab Emirates Cognitive Services Market Volume (K Unit) Forecast, by Application 2019 & 2032
- Table 95: Saudi Arabia Cognitive Services Market Revenue (Million) Forecast, by Application 2019 & 2032
- Table 96: Saudi Arabia Cognitive Services Market Volume (K Unit) Forecast, by Application 2019 & 2032
- Table 97: South Africa Cognitive Services Market Revenue (Million) Forecast, by Application 2019 & 2032
- Table 98: South Africa Cognitive Services Market Volume (K Unit) Forecast, by Application 2019 & 2032
- Table 99: Rest of Middle East and Africa Cognitive Services Market Revenue (Million) Forecast, by Application 2019 & 2032
- Table 100: Rest of Middle East and Africa Cognitive Services Market Volume (K Unit) Forecast, by Application 2019 & 2032
- Table 101: Global Cognitive Services Market Revenue Million Forecast, by Deployment 2019 & 2032
- Table 102: Global Cognitive Services Market Volume K Unit Forecast, by Deployment 2019 & 2032
- Table 103: Global Cognitive Services Market Revenue Million Forecast, by Enterprise Size 2019 & 2032
- Table 104: Global Cognitive Services Market Volume K Unit Forecast, by Enterprise Size 2019 & 2032
- Table 105: Global Cognitive Services Market Revenue Million Forecast, by End-user Industry 2019 & 2032
- Table 106: Global Cognitive Services Market Volume K Unit Forecast, by End-user Industry 2019 & 2032
- Table 107: Global Cognitive Services Market Revenue Million Forecast, by Country 2019 & 2032
- Table 108: Global Cognitive Services Market Volume K Unit Forecast, by Country 2019 & 2032
- Table 109: United States Cognitive Services Market Revenue (Million) Forecast, by Application 2019 & 2032
- Table 110: United States Cognitive Services Market Volume (K Unit) Forecast, by Application 2019 & 2032
- Table 111: Canada Cognitive Services Market Revenue (Million) Forecast, by Application 2019 & 2032
- Table 112: Canada Cognitive Services Market Volume (K Unit) Forecast, by Application 2019 & 2032
- Table 113: Global Cognitive Services Market Revenue Million Forecast, by Deployment 2019 & 2032
- Table 114: Global Cognitive Services Market Volume K Unit Forecast, by Deployment 2019 & 2032
- Table 115: Global Cognitive Services Market Revenue Million Forecast, by Enterprise Size 2019 & 2032
- Table 116: Global Cognitive Services Market Volume K Unit Forecast, by Enterprise Size 2019 & 2032
- Table 117: Global Cognitive Services Market Revenue Million Forecast, by End-user Industry 2019 & 2032
- Table 118: Global Cognitive Services Market Volume K Unit Forecast, by End-user Industry 2019 & 2032
- Table 119: Global Cognitive Services Market Revenue Million Forecast, by Country 2019 & 2032
- Table 120: Global Cognitive Services Market Volume K Unit Forecast, by Country 2019 & 2032
- Table 121: United Kingdom Cognitive Services Market Revenue (Million) Forecast, by Application 2019 & 2032
- Table 122: United Kingdom Cognitive Services Market Volume (K Unit) Forecast, by Application 2019 & 2032
- Table 123: Germany Cognitive Services Market Revenue (Million) Forecast, by Application 2019 & 2032
- Table 124: Germany Cognitive Services Market Volume (K Unit) Forecast, by Application 2019 & 2032
- Table 125: France Cognitive Services Market Revenue (Million) Forecast, by Application 2019 & 2032
- Table 126: France Cognitive Services Market Volume (K Unit) Forecast, by Application 2019 & 2032
- Table 127: Rest of Europe Cognitive Services Market Revenue (Million) Forecast, by Application 2019 & 2032
- Table 128: Rest of Europe Cognitive Services Market Volume (K Unit) Forecast, by Application 2019 & 2032
- Table 129: Global Cognitive Services Market Revenue Million Forecast, by Deployment 2019 & 2032
- Table 130: Global Cognitive Services Market Volume K Unit Forecast, by Deployment 2019 & 2032
- Table 131: Global Cognitive Services Market Revenue Million Forecast, by Enterprise Size 2019 & 2032
- Table 132: Global Cognitive Services Market Volume K Unit Forecast, by Enterprise Size 2019 & 2032
- Table 133: Global Cognitive Services Market Revenue Million Forecast, by End-user Industry 2019 & 2032
- Table 134: Global Cognitive Services Market Volume K Unit Forecast, by End-user Industry 2019 & 2032
- Table 135: Global Cognitive Services Market Revenue Million Forecast, by Country 2019 & 2032
- Table 136: Global Cognitive Services Market Volume K Unit Forecast, by Country 2019 & 2032
- Table 137: China Cognitive Services Market Revenue (Million) Forecast, by Application 2019 & 2032
- Table 138: China Cognitive Services Market Volume (K Unit) Forecast, by Application 2019 & 2032
- Table 139: Japan Cognitive Services Market Revenue (Million) Forecast, by Application 2019 & 2032
- Table 140: Japan Cognitive Services Market Volume (K Unit) Forecast, by Application 2019 & 2032
- Table 141: India Cognitive Services Market Revenue (Million) Forecast, by Application 2019 & 2032
- Table 142: India Cognitive Services Market Volume (K Unit) Forecast, by Application 2019 & 2032
- Table 143: Rest of Asia Pacific Cognitive Services Market Revenue (Million) Forecast, by Application 2019 & 2032
- Table 144: Rest of Asia Pacific Cognitive Services Market Volume (K Unit) Forecast, by Application 2019 & 2032
- Table 145: Global Cognitive Services Market Revenue Million Forecast, by Deployment 2019 & 2032
- Table 146: Global Cognitive Services Market Volume K Unit Forecast, by Deployment 2019 & 2032
- Table 147: Global Cognitive Services Market Revenue Million Forecast, by Enterprise Size 2019 & 2032
- Table 148: Global Cognitive Services Market Volume K Unit Forecast, by Enterprise Size 2019 & 2032
- Table 149: Global Cognitive Services Market Revenue Million Forecast, by End-user Industry 2019 & 2032
- Table 150: Global Cognitive Services Market Volume K Unit Forecast, by End-user Industry 2019 & 2032
- Table 151: Global Cognitive Services Market Revenue Million Forecast, by Country 2019 & 2032
- Table 152: Global Cognitive Services Market Volume K Unit Forecast, by Country 2019 & 2032
- Table 153: Brazil Cognitive Services Market Revenue (Million) Forecast, by Application 2019 & 2032
- Table 154: Brazil Cognitive Services Market Volume (K Unit) Forecast, by Application 2019 & 2032
- Table 155: Mexico Cognitive Services Market Revenue (Million) Forecast, by Application 2019 & 2032
- Table 156: Mexico Cognitive Services Market Volume (K Unit) Forecast, by Application 2019 & 2032
- Table 157: Rest of Latin America Cognitive Services Market Revenue (Million) Forecast, by Application 2019 & 2032
- Table 158: Rest of Latin America Cognitive Services Market Volume (K Unit) Forecast, by Application 2019 & 2032
- Table 159: Global Cognitive Services Market Revenue Million Forecast, by Deployment 2019 & 2032
- Table 160: Global Cognitive Services Market Volume K Unit Forecast, by Deployment 2019 & 2032
- Table 161: Global Cognitive Services Market Revenue Million Forecast, by Enterprise Size 2019 & 2032
- Table 162: Global Cognitive Services Market Volume K Unit Forecast, by Enterprise Size 2019 & 2032
- Table 163: Global Cognitive Services Market Revenue Million Forecast, by End-user Industry 2019 & 2032
- Table 164: Global Cognitive Services Market Volume K Unit Forecast, by End-user Industry 2019 & 2032
- Table 165: Global Cognitive Services Market Revenue Million Forecast, by Country 2019 & 2032
- Table 166: Global Cognitive Services Market Volume K Unit Forecast, by Country 2019 & 2032
Frequently Asked Questions
1. What is the projected Compound Annual Growth Rate (CAGR) of the Cognitive Services Market?
The projected CAGR is approximately 36.45%.
2. Which companies are prominent players in the Cognitive Services Market?
Key companies in the market include SAS Institute Inc, Infosys Limited, IBM Corporation, Google LLC, Microsoft Corporation, Tata Consultancy Services Limited, Amazon Web Services Inc, Wipro Limited, Nokia Corporation, Enterra Solutions LLC, Attivio Inc.
3. What are the main segments of the Cognitive Services Market?
The market segments include Deployment, Enterprise Size, End-user Industry.
4. Can you provide details about the market size?
The market size is estimated to be USD XX Million as of 2022.
5. What are some drivers contributing to market growth?
Growing Adoption of Intelligent APIs to Build Smarter Applications; Increase in Data Volume and Complexity.
6. What are the notable trends driving market growth?
IT and Telecommunication Segment to Grow Significantly.
7. Are there any restraints impacting market growth?
High Cost Incorporated with the Implementation.
8. Can you provide examples of recent developments in the market?
August 2022: Jio Haptik collaborated with Microsoft Azure Cognitive Services to improve existing Hindi conversational AI models. This translation model will enable organizations to offer seamlessly localized and multilingual customer experiences. With this collaboration, Jio Mobility is set to address 2M+ local language queries on their chatbot using Microsoft Azure.
9. What pricing options are available for accessing the report?
Pricing options include single-user, multi-user, and enterprise licenses priced at USD 4750, USD 5250, and USD 8750 respectively.
10. Is the market size provided in terms of value or volume?
The market size is provided in terms of value, measured in Million and volume, measured in K Unit.
11. Are there any specific market keywords associated with the report?
Yes, the market keyword associated with the report is "Cognitive Services Market," which aids in identifying and referencing the specific market segment covered.
12. How do I determine which pricing option suits my needs best?
The pricing options vary based on user requirements and access needs. Individual users may opt for single-user licenses, while businesses requiring broader access may choose multi-user or enterprise licenses for cost-effective access to the report.
13. Are there any additional resources or data provided in the Cognitive Services Market report?
While the report offers comprehensive insights, it's advisable to review the specific contents or supplementary materials provided to ascertain if additional resources or data are available.
14. How can I stay updated on further developments or reports in the Cognitive Services Market?
To stay informed about further developments, trends, and reports in the Cognitive Services Market, consider subscribing to industry newsletters, following relevant companies and organizations, or regularly checking reputable industry news sources and publications.
Methodology
Step 1 - Identification of Relevant Samples Size from Population Database


Step 2 - Approaches for Defining Global Market Size (Value, Volume* & Price*)

Note*: In applicable scenarios
Step 3 - Data Sources
Primary Research
- Web Analytics
- Survey Reports
- Research Institute
- Latest Research Reports
- Opinion Leaders
Secondary Research
- Annual Reports
- White Paper
- Latest Press Release
- Industry Association
- Paid Database
- Investor Presentations

Step 4 - Data Triangulation
Involves using different sources of information in order to increase the validity of a study
These sources are likely to be stakeholders in a program - participants, other researchers, program staff, other community members, and so on.
Then we put all data in single framework & apply various statistical tools to find out the dynamic on the market.
During the analysis stage, feedback from the stakeholder groups would be compared to determine areas of agreement as well as areas of divergence


