
Key Insights
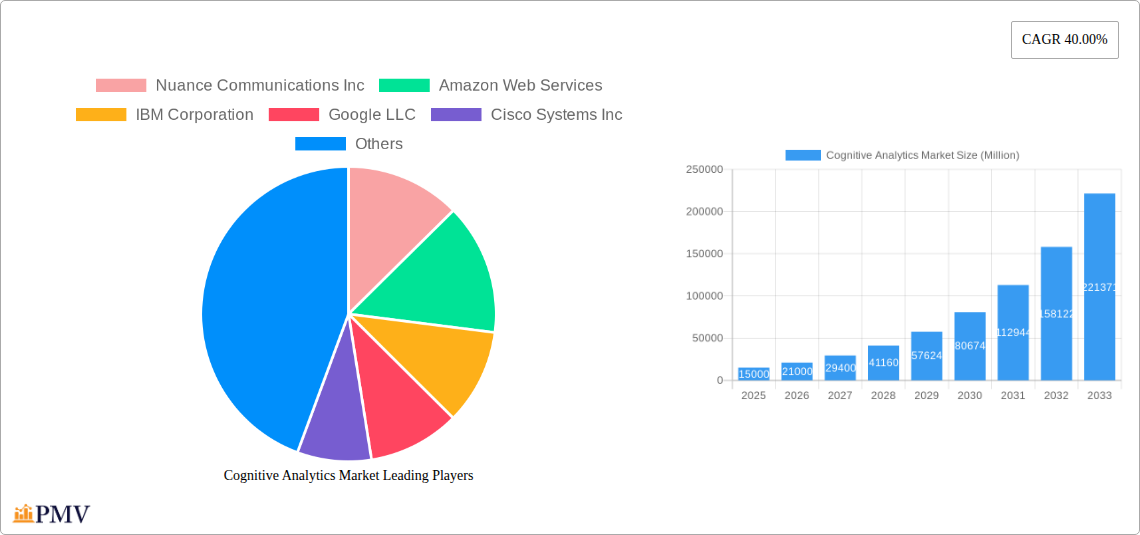
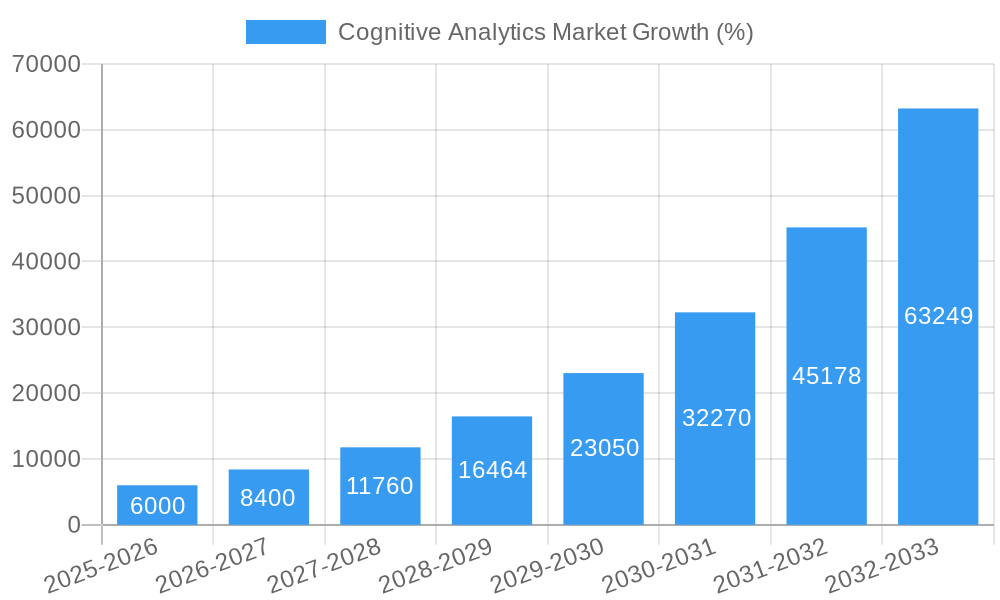
The Cognitive Analytics market is experiencing robust growth, projected at a 40% CAGR from 2025 to 2033. This expansion is fueled by several key factors. The increasing volume and complexity of data generated across various industries necessitate advanced analytical capabilities to extract meaningful insights for improved decision-making. Furthermore, the rising adoption of cloud-based solutions and the expanding availability of sophisticated AI technologies like Natural Language Processing (NLP) and Machine Learning (ML) are driving market penetration. The BFSI, manufacturing, and IT & telecommunications sectors are leading adopters, leveraging cognitive analytics for fraud detection, predictive maintenance, and customer experience enhancement, respectively. However, challenges remain, including the high cost of implementation, the need for skilled professionals to manage and interpret the results, and concerns around data security and privacy. Despite these hurdles, the market's trajectory points towards sustained growth, driven by continuous technological advancements, increasing data accessibility, and the growing recognition of the transformative potential of cognitive analytics across diverse sectors.
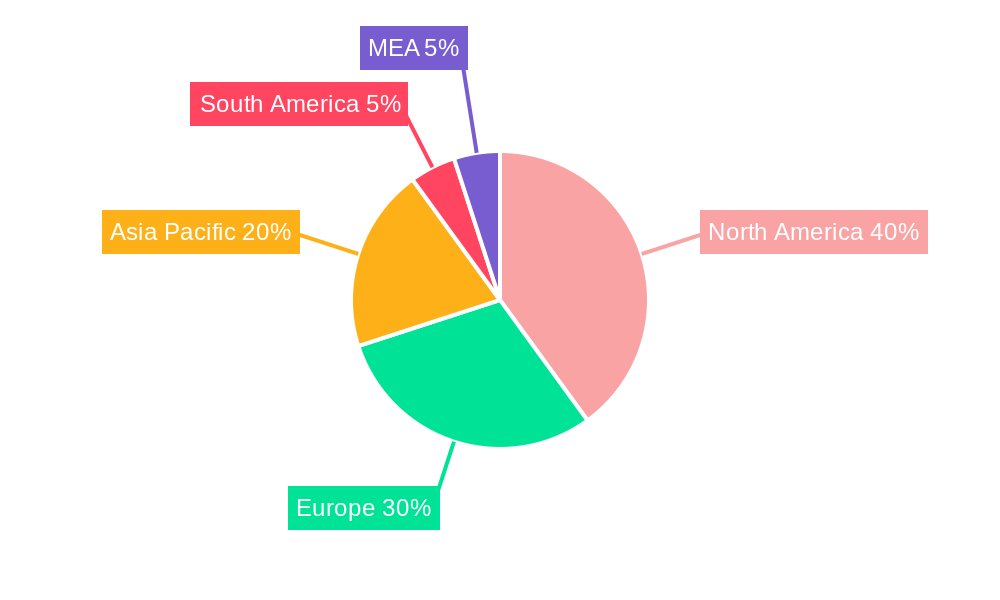
The market segmentation reveals a strong preference for on-demand deployment models, reflecting the agility and scalability they offer. Within component types, services are currently dominating, likely due to the expertise required for effective implementation and integration. This trend is expected to persist, albeit with a growing emphasis on tools as the technology matures and becomes more user-friendly. Geographically, North America currently holds a significant market share, attributed to its advanced technological infrastructure and high adoption rates. However, the Asia-Pacific region is poised for rapid growth, driven by increasing digitalization and investment in AI across developing economies. Key players like Nuance Communications, Amazon Web Services, and IBM are actively shaping the market landscape through continuous innovation and strategic partnerships, further contributing to the overall growth trajectory. The competitive landscape is expected to intensify in the coming years, requiring companies to differentiate themselves through superior technology, robust customer support, and industry-specific solutions.
Cognitive Analytics Market: A Comprehensive Report (2019-2033)
This in-depth report provides a comprehensive analysis of the Cognitive Analytics Market, offering invaluable insights for businesses, investors, and researchers seeking to understand and capitalize on this rapidly evolving sector. The study period spans from 2019 to 2033, with 2025 serving as the base and estimated year. The report meticulously examines market structure, competitive dynamics, industry trends, dominant segments, product innovations, and future growth potential, providing a robust foundation for strategic decision-making. The market is projected to reach xx Million by 2033, exhibiting a CAGR of xx% during the forecast period (2025-2033).
Cognitive Analytics Market Structure & Competitive Dynamics
The Cognitive Analytics market exhibits a moderately concentrated landscape, with key players like Nuance Communications Inc, Amazon Web Services, IBM Corporation, Google LLC, Cisco Systems Inc, Microsoft Corporation, SAS Institute, Oracle Corporation, Narrative Science, and Sinequa holding significant market share. The market's competitive intensity is driven by ongoing innovation in areas such as Natural Language Processing (NLP), Machine Learning, and Automated Reasoning. Regulatory frameworks, particularly those concerning data privacy and security, significantly influence market dynamics. Product substitution remains a potential threat, with emerging technologies constantly challenging established solutions.
End-user trends, especially the increasing adoption of cloud-based solutions and the growing demand for data-driven decision-making across diverse industries, are key growth catalysts. Mergers and acquisitions (M&A) have played a significant role in shaping the market landscape. In the historical period (2019-2024), M&A activity resulted in a total deal value of approximately xx Million, with a notable increase in acquisitions of smaller specialized firms by larger technology companies. Market share data for 2025 indicates that the top five players collectively hold approximately xx% of the market.
- Market Concentration: Moderately Concentrated
- Innovation Ecosystem: Highly Dynamic
- Regulatory Framework: Stringent Data Privacy Regulations
- Product Substitutes: Emerging AI technologies
- End-user Trends: Increased Cloud Adoption, Data-driven Decision Making
- M&A Activity: Significant, with xx Million in deal value (2019-2024).
Cognitive Analytics Market Industry Trends & Insights
The Cognitive Analytics market is experiencing robust growth, fueled by several key factors. The increasing availability of large datasets, coupled with advancements in artificial intelligence (AI) and machine learning (ML) technologies, has significantly enhanced the capabilities of cognitive analytics platforms. This has led to wider adoption across various sectors, including BFSI, healthcare, and manufacturing. The market is witnessing a rapid shift towards cloud-based deployment models, driven by factors such as scalability, cost-effectiveness, and accessibility. Consumer preferences are increasingly favoring user-friendly, intuitive interfaces and solutions that provide actionable insights. The market penetration rate for cognitive analytics solutions in the BFSI sector is estimated to be approximately xx% in 2025. The CAGR for the market during the forecast period (2025-2033) is projected to be xx%. Competitive dynamics are characterized by continuous innovation, strategic partnerships, and the emergence of new players offering specialized solutions.
Dominant Markets & Segments in Cognitive Analytics Market
The North American region currently dominates the Cognitive Analytics market, driven by factors such as robust technological infrastructure, high levels of digitalization, and the presence of major technology companies. Within the segment breakdown:
- By Deployment: The On-Demand segment is experiencing faster growth than the On-Premise segment, driven by the increasing adoption of cloud-based solutions.
- By Component Type: The Services segment holds a larger market share compared to the Tools segment, reflecting the demand for customized solutions and ongoing support.
- By Technology Type: Natural Language Processing (NLP) is currently the most widely adopted technology, followed by Machine Learning. Automated Reasoning is gaining traction as its applications expand.
- By End-user Industry: The BFSI sector currently holds the largest market share, followed by the Healthcare and IT & Telecommunication sectors. Growth in the BFSI sector is driven by the need for fraud detection, risk management, and customer service improvements. The Healthcare sector's growth is driven by the increasing adoption of electronic health records and the need for improved diagnostics. Manufacturing is adopting Cognitive Analytics to improve operational efficiency, predictive maintenance, and quality control.
Key Drivers by Region:
- North America: Strong technological infrastructure, high digital adoption rates, presence of major technology companies.
- Europe: Growing adoption of cloud-based solutions, stringent data privacy regulations.
- Asia Pacific: Rapid technological advancements, increasing government support for digital transformation.
Cognitive Analytics Market Product Innovations
Recent product developments in the Cognitive Analytics market showcase a trend towards more sophisticated algorithms, enhanced user interfaces, and integration with other business intelligence tools. New applications include improved sentiment analysis for customer feedback, advanced predictive modeling for risk assessment, and automated report generation for streamlined data analysis. These innovations provide competitive advantages through increased accuracy, efficiency, and actionable insights. The market is increasingly seeing solutions that incorporate explainable AI (XAI) principles, enhancing transparency and trust.
Report Segmentation & Scope
The report segments the Cognitive Analytics market across various dimensions:
- By Deployment: On-Premise and On-Demand, with projected growth rates and market size for each segment. Competitive landscapes are analyzed for both segments, highlighting key players and their strategic approaches.
- By Component Type: Tools and Services, each with detailed market size projections and competitive analyses. The report explores the varying growth trajectories of these segments and their impact on the overall market.
- By Technology Type: Natural Language Processing (NLP), Machine Learning, and Automated Reasoning are assessed individually, covering market size, growth projections, and the competitive landscape within each segment. Technology snapshots provide detailed overviews of each type.
- By End-user Industry: BFSI, Manufacturing, IT & Telecommunication, Aerospace and Defense, Healthcare, Retail and Consumer Goods, and Other End-user Industries. This segment includes growth projections, competitive landscape analysis, and identifying leading players within each industry.
Key Drivers of Cognitive Analytics Market Growth
Several factors are driving the growth of the Cognitive Analytics market. These include the increasing availability of large datasets (Big Data), advancements in AI and machine learning algorithms, rising demand for data-driven decision-making across diverse industries, growing adoption of cloud-based solutions, and increasing government investments in digital transformation initiatives. The rise of the Internet of Things (IoT) and the associated influx of data further fuel market growth. Supportive regulatory environments in certain regions also play a role.
Challenges in the Cognitive Analytics Market Sector
Despite its considerable potential, the Cognitive Analytics market faces several challenges. These include the high cost of implementation, the need for specialized skills and expertise, concerns regarding data privacy and security, the complexity of integrating cognitive analytics solutions with existing systems, and the potential for bias in algorithms. Competitive pressure from both established and emerging players also poses a significant challenge. The impact of these challenges is reflected in the slower adoption rate in certain regions and industries.
Leading Players in the Cognitive Analytics Market Market
- Nuance Communications Inc
- Amazon Web Services
- IBM Corporation
- Google LLC
- Cisco Systems Inc
- Microsoft Corporation
- SAS Institute
- Oracle Corporation
- Narrative Science
- Sinequa
Key Developments in Cognitive Analytics Market Sector
- 2023-Q4: IBM launched a new cognitive analytics platform with enhanced NLP capabilities.
- 2024-Q2: Amazon Web Services announced a strategic partnership with a leading data analytics firm.
- 2024-Q3: Microsoft released an updated version of its cognitive analytics suite with improved integration capabilities. (Further developments can be added here as they occur)
Strategic Cognitive Analytics Market Market Outlook
The Cognitive Analytics market is poised for significant growth over the next decade. Continued advancements in AI and ML technologies, along with increasing data availability and the growing adoption of cloud-based solutions, will drive further market expansion. Strategic opportunities exist for companies focusing on niche applications, developing user-friendly interfaces, and addressing specific industry challenges. Furthermore, the growing demand for explainable AI (XAI) represents a significant opportunity for companies to differentiate their offerings. The market's long-term growth potential remains strong, driven by the ongoing digital transformation across various sectors.
Cognitive Analytics Market Segmentation
-
1. Deployment
- 1.1. On-Premise
- 1.2. On-Demand
-
2. Component Type
- 2.1. Tools
- 2.2. Services
-
3. Technology Type
- 3.1. Natural Language Processing (NLP)
- 3.2. Machine Learning
- 3.3. Automated Reasoning
- 3.4. Technology Snapshot
-
4. End-user Industry
- 4.1. BFSI
- 4.2. Manufacturing
- 4.3. IT & telecommunication
- 4.4. Aerospace and Defense
- 4.5. Healthcare
- 4.6. Retail and Consumer Goods
- 4.7. Other End-user Industries
Cognitive Analytics Market Segmentation By Geography
-
1. North America
- 1.1. United States
- 1.2. Canada
-
2. Europe
- 2.1. United Kingdom
- 2.2. Germany
- 2.3. France
- 2.4. Rest of Europe
-
3. Asia Pacific
- 3.1. China
- 3.2. Japan
- 3.3. India
- 3.4. Australia
- 3.5. Rest of Asia Pacific
-
4. Rest of the World
- 4.1. Latin America
- 4.2. Middle East
Cognitive Analytics Market REPORT HIGHLIGHTS
| Aspects | Details |
|---|---|
| Study Period | 2019-2033 |
| Base Year | 2024 |
| Estimated Year | 2025 |
| Forecast Period | 2025-2033 |
| Historical Period | 2019-2024 |
| Growth Rate | CAGR of 40.00% from 2019-2033 |
| Segmentation |
|
Table of Contents
- 1. Introduction
- 1.1. Research Scope
- 1.2. Market Segmentation
- 1.3. Research Methodology
- 1.4. Definitions and Assumptions
- 2. Executive Summary
- 2.1. Introduction
- 3. Market Dynamics
- 3.1. Introduction
- 3.2. Market Drivers
- 3.2.1. ; Rise in Adoption of Cognitive Computing Technology; Increasing Volume of Unstructured Data
- 3.3. Market Restrains
- 3.3.1. ; Complex Analytical Process
- 3.4. Market Trends
- 3.4.1. Healthcare Segment to Witness High Growth
- 4. Market Factor Analysis
- 4.1. Porters Five Forces
- 4.2. Supply/Value Chain
- 4.3. PESTEL analysis
- 4.4. Market Entropy
- 4.5. Patent/Trademark Analysis
- 5. Global Cognitive Analytics Market Analysis, Insights and Forecast, 2019-2031
- 5.1. Market Analysis, Insights and Forecast - by Deployment
- 5.1.1. On-Premise
- 5.1.2. On-Demand
- 5.2. Market Analysis, Insights and Forecast - by Component Type
- 5.2.1. Tools
- 5.2.2. Services
- 5.3. Market Analysis, Insights and Forecast - by Technology Type
- 5.3.1. Natural Language Processing (NLP)
- 5.3.2. Machine Learning
- 5.3.3. Automated Reasoning
- 5.3.4. Technology Snapshot
- 5.4. Market Analysis, Insights and Forecast - by End-user Industry
- 5.4.1. BFSI
- 5.4.2. Manufacturing
- 5.4.3. IT & telecommunication
- 5.4.4. Aerospace and Defense
- 5.4.5. Healthcare
- 5.4.6. Retail and Consumer Goods
- 5.4.7. Other End-user Industries
- 5.5. Market Analysis, Insights and Forecast - by Region
- 5.5.1. North America
- 5.5.2. Europe
- 5.5.3. Asia Pacific
- 5.5.4. Rest of the World
- 5.1. Market Analysis, Insights and Forecast - by Deployment
- 6. North America Cognitive Analytics Market Analysis, Insights and Forecast, 2019-2031
- 6.1. Market Analysis, Insights and Forecast - by Deployment
- 6.1.1. On-Premise
- 6.1.2. On-Demand
- 6.2. Market Analysis, Insights and Forecast - by Component Type
- 6.2.1. Tools
- 6.2.2. Services
- 6.3. Market Analysis, Insights and Forecast - by Technology Type
- 6.3.1. Natural Language Processing (NLP)
- 6.3.2. Machine Learning
- 6.3.3. Automated Reasoning
- 6.3.4. Technology Snapshot
- 6.4. Market Analysis, Insights and Forecast - by End-user Industry
- 6.4.1. BFSI
- 6.4.2. Manufacturing
- 6.4.3. IT & telecommunication
- 6.4.4. Aerospace and Defense
- 6.4.5. Healthcare
- 6.4.6. Retail and Consumer Goods
- 6.4.7. Other End-user Industries
- 6.1. Market Analysis, Insights and Forecast - by Deployment
- 7. Europe Cognitive Analytics Market Analysis, Insights and Forecast, 2019-2031
- 7.1. Market Analysis, Insights and Forecast - by Deployment
- 7.1.1. On-Premise
- 7.1.2. On-Demand
- 7.2. Market Analysis, Insights and Forecast - by Component Type
- 7.2.1. Tools
- 7.2.2. Services
- 7.3. Market Analysis, Insights and Forecast - by Technology Type
- 7.3.1. Natural Language Processing (NLP)
- 7.3.2. Machine Learning
- 7.3.3. Automated Reasoning
- 7.3.4. Technology Snapshot
- 7.4. Market Analysis, Insights and Forecast - by End-user Industry
- 7.4.1. BFSI
- 7.4.2. Manufacturing
- 7.4.3. IT & telecommunication
- 7.4.4. Aerospace and Defense
- 7.4.5. Healthcare
- 7.4.6. Retail and Consumer Goods
- 7.4.7. Other End-user Industries
- 7.1. Market Analysis, Insights and Forecast - by Deployment
- 8. Asia Pacific Cognitive Analytics Market Analysis, Insights and Forecast, 2019-2031
- 8.1. Market Analysis, Insights and Forecast - by Deployment
- 8.1.1. On-Premise
- 8.1.2. On-Demand
- 8.2. Market Analysis, Insights and Forecast - by Component Type
- 8.2.1. Tools
- 8.2.2. Services
- 8.3. Market Analysis, Insights and Forecast - by Technology Type
- 8.3.1. Natural Language Processing (NLP)
- 8.3.2. Machine Learning
- 8.3.3. Automated Reasoning
- 8.3.4. Technology Snapshot
- 8.4. Market Analysis, Insights and Forecast - by End-user Industry
- 8.4.1. BFSI
- 8.4.2. Manufacturing
- 8.4.3. IT & telecommunication
- 8.4.4. Aerospace and Defense
- 8.4.5. Healthcare
- 8.4.6. Retail and Consumer Goods
- 8.4.7. Other End-user Industries
- 8.1. Market Analysis, Insights and Forecast - by Deployment
- 9. Rest of the World Cognitive Analytics Market Analysis, Insights and Forecast, 2019-2031
- 9.1. Market Analysis, Insights and Forecast - by Deployment
- 9.1.1. On-Premise
- 9.1.2. On-Demand
- 9.2. Market Analysis, Insights and Forecast - by Component Type
- 9.2.1. Tools
- 9.2.2. Services
- 9.3. Market Analysis, Insights and Forecast - by Technology Type
- 9.3.1. Natural Language Processing (NLP)
- 9.3.2. Machine Learning
- 9.3.3. Automated Reasoning
- 9.3.4. Technology Snapshot
- 9.4. Market Analysis, Insights and Forecast - by End-user Industry
- 9.4.1. BFSI
- 9.4.2. Manufacturing
- 9.4.3. IT & telecommunication
- 9.4.4. Aerospace and Defense
- 9.4.5. Healthcare
- 9.4.6. Retail and Consumer Goods
- 9.4.7. Other End-user Industries
- 9.1. Market Analysis, Insights and Forecast - by Deployment
- 10. North America Cognitive Analytics Market Analysis, Insights and Forecast, 2019-2031
- 10.1. Market Analysis, Insights and Forecast - By Country/Sub-region
- 10.1.1 United States
- 10.1.2 Canada
- 10.1.3 Mexico
- 11. Europe Cognitive Analytics Market Analysis, Insights and Forecast, 2019-2031
- 11.1. Market Analysis, Insights and Forecast - By Country/Sub-region
- 11.1.1 Germany
- 11.1.2 United Kingdom
- 11.1.3 France
- 11.1.4 Spain
- 11.1.5 Italy
- 11.1.6 Spain
- 11.1.7 Belgium
- 11.1.8 Netherland
- 11.1.9 Nordics
- 11.1.10 Rest of Europe
- 12. Asia Pacific Cognitive Analytics Market Analysis, Insights and Forecast, 2019-2031
- 12.1. Market Analysis, Insights and Forecast - By Country/Sub-region
- 12.1.1 China
- 12.1.2 Japan
- 12.1.3 India
- 12.1.4 South Korea
- 12.1.5 Southeast Asia
- 12.1.6 Australia
- 12.1.7 Indonesia
- 12.1.8 Phillipes
- 12.1.9 Singapore
- 12.1.10 Thailandc
- 12.1.11 Rest of Asia Pacific
- 13. South America Cognitive Analytics Market Analysis, Insights and Forecast, 2019-2031
- 13.1. Market Analysis, Insights and Forecast - By Country/Sub-region
- 13.1.1 Brazil
- 13.1.2 Argentina
- 13.1.3 Peru
- 13.1.4 Chile
- 13.1.5 Colombia
- 13.1.6 Ecuador
- 13.1.7 Venezuela
- 13.1.8 Rest of South America
- 14. North America Cognitive Analytics Market Analysis, Insights and Forecast, 2019-2031
- 14.1. Market Analysis, Insights and Forecast - By Country/Sub-region
- 14.1.1 United States
- 14.1.2 Canada
- 14.1.3 Mexico
- 15. MEA Cognitive Analytics Market Analysis, Insights and Forecast, 2019-2031
- 15.1. Market Analysis, Insights and Forecast - By Country/Sub-region
- 15.1.1 United Arab Emirates
- 15.1.2 Saudi Arabia
- 15.1.3 South Africa
- 15.1.4 Rest of Middle East and Africa
- 16. Competitive Analysis
- 16.1. Global Market Share Analysis 2024
- 16.2. Company Profiles
- 16.2.1 Nuance Communications Inc
- 16.2.1.1. Overview
- 16.2.1.2. Products
- 16.2.1.3. SWOT Analysis
- 16.2.1.4. Recent Developments
- 16.2.1.5. Financials (Based on Availability)
- 16.2.2 Amazon Web Services
- 16.2.2.1. Overview
- 16.2.2.2. Products
- 16.2.2.3. SWOT Analysis
- 16.2.2.4. Recent Developments
- 16.2.2.5. Financials (Based on Availability)
- 16.2.3 IBM Corporation
- 16.2.3.1. Overview
- 16.2.3.2. Products
- 16.2.3.3. SWOT Analysis
- 16.2.3.4. Recent Developments
- 16.2.3.5. Financials (Based on Availability)
- 16.2.4 Google LLC
- 16.2.4.1. Overview
- 16.2.4.2. Products
- 16.2.4.3. SWOT Analysis
- 16.2.4.4. Recent Developments
- 16.2.4.5. Financials (Based on Availability)
- 16.2.5 Cisco Systems Inc
- 16.2.5.1. Overview
- 16.2.5.2. Products
- 16.2.5.3. SWOT Analysis
- 16.2.5.4. Recent Developments
- 16.2.5.5. Financials (Based on Availability)
- 16.2.6 Microsoft Corporation
- 16.2.6.1. Overview
- 16.2.6.2. Products
- 16.2.6.3. SWOT Analysis
- 16.2.6.4. Recent Developments
- 16.2.6.5. Financials (Based on Availability)
- 16.2.7 SAS Institute
- 16.2.7.1. Overview
- 16.2.7.2. Products
- 16.2.7.3. SWOT Analysis
- 16.2.7.4. Recent Developments
- 16.2.7.5. Financials (Based on Availability)
- 16.2.8 Oracle Corporation
- 16.2.8.1. Overview
- 16.2.8.2. Products
- 16.2.8.3. SWOT Analysis
- 16.2.8.4. Recent Developments
- 16.2.8.5. Financials (Based on Availability)
- 16.2.9 Narrative Science
- 16.2.9.1. Overview
- 16.2.9.2. Products
- 16.2.9.3. SWOT Analysis
- 16.2.9.4. Recent Developments
- 16.2.9.5. Financials (Based on Availability)
- 16.2.10 Sinequa
- 16.2.10.1. Overview
- 16.2.10.2. Products
- 16.2.10.3. SWOT Analysis
- 16.2.10.4. Recent Developments
- 16.2.10.5. Financials (Based on Availability)
- 16.2.1 Nuance Communications Inc
List of Figures
- Figure 1: Global Cognitive Analytics Market Revenue Breakdown (Million, %) by Region 2024 & 2032
- Figure 2: Global Cognitive Analytics Market Volume Breakdown (K Unit, %) by Region 2024 & 2032
- Figure 3: North America Cognitive Analytics Market Revenue (Million), by Country 2024 & 2032
- Figure 4: North America Cognitive Analytics Market Volume (K Unit), by Country 2024 & 2032
- Figure 5: North America Cognitive Analytics Market Revenue Share (%), by Country 2024 & 2032
- Figure 6: North America Cognitive Analytics Market Volume Share (%), by Country 2024 & 2032
- Figure 7: Europe Cognitive Analytics Market Revenue (Million), by Country 2024 & 2032
- Figure 8: Europe Cognitive Analytics Market Volume (K Unit), by Country 2024 & 2032
- Figure 9: Europe Cognitive Analytics Market Revenue Share (%), by Country 2024 & 2032
- Figure 10: Europe Cognitive Analytics Market Volume Share (%), by Country 2024 & 2032
- Figure 11: Asia Pacific Cognitive Analytics Market Revenue (Million), by Country 2024 & 2032
- Figure 12: Asia Pacific Cognitive Analytics Market Volume (K Unit), by Country 2024 & 2032
- Figure 13: Asia Pacific Cognitive Analytics Market Revenue Share (%), by Country 2024 & 2032
- Figure 14: Asia Pacific Cognitive Analytics Market Volume Share (%), by Country 2024 & 2032
- Figure 15: South America Cognitive Analytics Market Revenue (Million), by Country 2024 & 2032
- Figure 16: South America Cognitive Analytics Market Volume (K Unit), by Country 2024 & 2032
- Figure 17: South America Cognitive Analytics Market Revenue Share (%), by Country 2024 & 2032
- Figure 18: South America Cognitive Analytics Market Volume Share (%), by Country 2024 & 2032
- Figure 19: North America Cognitive Analytics Market Revenue (Million), by Country 2024 & 2032
- Figure 20: North America Cognitive Analytics Market Volume (K Unit), by Country 2024 & 2032
- Figure 21: North America Cognitive Analytics Market Revenue Share (%), by Country 2024 & 2032
- Figure 22: North America Cognitive Analytics Market Volume Share (%), by Country 2024 & 2032
- Figure 23: MEA Cognitive Analytics Market Revenue (Million), by Country 2024 & 2032
- Figure 24: MEA Cognitive Analytics Market Volume (K Unit), by Country 2024 & 2032
- Figure 25: MEA Cognitive Analytics Market Revenue Share (%), by Country 2024 & 2032
- Figure 26: MEA Cognitive Analytics Market Volume Share (%), by Country 2024 & 2032
- Figure 27: North America Cognitive Analytics Market Revenue (Million), by Deployment 2024 & 2032
- Figure 28: North America Cognitive Analytics Market Volume (K Unit), by Deployment 2024 & 2032
- Figure 29: North America Cognitive Analytics Market Revenue Share (%), by Deployment 2024 & 2032
- Figure 30: North America Cognitive Analytics Market Volume Share (%), by Deployment 2024 & 2032
- Figure 31: North America Cognitive Analytics Market Revenue (Million), by Component Type 2024 & 2032
- Figure 32: North America Cognitive Analytics Market Volume (K Unit), by Component Type 2024 & 2032
- Figure 33: North America Cognitive Analytics Market Revenue Share (%), by Component Type 2024 & 2032
- Figure 34: North America Cognitive Analytics Market Volume Share (%), by Component Type 2024 & 2032
- Figure 35: North America Cognitive Analytics Market Revenue (Million), by Technology Type 2024 & 2032
- Figure 36: North America Cognitive Analytics Market Volume (K Unit), by Technology Type 2024 & 2032
- Figure 37: North America Cognitive Analytics Market Revenue Share (%), by Technology Type 2024 & 2032
- Figure 38: North America Cognitive Analytics Market Volume Share (%), by Technology Type 2024 & 2032
- Figure 39: North America Cognitive Analytics Market Revenue (Million), by End-user Industry 2024 & 2032
- Figure 40: North America Cognitive Analytics Market Volume (K Unit), by End-user Industry 2024 & 2032
- Figure 41: North America Cognitive Analytics Market Revenue Share (%), by End-user Industry 2024 & 2032
- Figure 42: North America Cognitive Analytics Market Volume Share (%), by End-user Industry 2024 & 2032
- Figure 43: North America Cognitive Analytics Market Revenue (Million), by Country 2024 & 2032
- Figure 44: North America Cognitive Analytics Market Volume (K Unit), by Country 2024 & 2032
- Figure 45: North America Cognitive Analytics Market Revenue Share (%), by Country 2024 & 2032
- Figure 46: North America Cognitive Analytics Market Volume Share (%), by Country 2024 & 2032
- Figure 47: Europe Cognitive Analytics Market Revenue (Million), by Deployment 2024 & 2032
- Figure 48: Europe Cognitive Analytics Market Volume (K Unit), by Deployment 2024 & 2032
- Figure 49: Europe Cognitive Analytics Market Revenue Share (%), by Deployment 2024 & 2032
- Figure 50: Europe Cognitive Analytics Market Volume Share (%), by Deployment 2024 & 2032
- Figure 51: Europe Cognitive Analytics Market Revenue (Million), by Component Type 2024 & 2032
- Figure 52: Europe Cognitive Analytics Market Volume (K Unit), by Component Type 2024 & 2032
- Figure 53: Europe Cognitive Analytics Market Revenue Share (%), by Component Type 2024 & 2032
- Figure 54: Europe Cognitive Analytics Market Volume Share (%), by Component Type 2024 & 2032
- Figure 55: Europe Cognitive Analytics Market Revenue (Million), by Technology Type 2024 & 2032
- Figure 56: Europe Cognitive Analytics Market Volume (K Unit), by Technology Type 2024 & 2032
- Figure 57: Europe Cognitive Analytics Market Revenue Share (%), by Technology Type 2024 & 2032
- Figure 58: Europe Cognitive Analytics Market Volume Share (%), by Technology Type 2024 & 2032
- Figure 59: Europe Cognitive Analytics Market Revenue (Million), by End-user Industry 2024 & 2032
- Figure 60: Europe Cognitive Analytics Market Volume (K Unit), by End-user Industry 2024 & 2032
- Figure 61: Europe Cognitive Analytics Market Revenue Share (%), by End-user Industry 2024 & 2032
- Figure 62: Europe Cognitive Analytics Market Volume Share (%), by End-user Industry 2024 & 2032
- Figure 63: Europe Cognitive Analytics Market Revenue (Million), by Country 2024 & 2032
- Figure 64: Europe Cognitive Analytics Market Volume (K Unit), by Country 2024 & 2032
- Figure 65: Europe Cognitive Analytics Market Revenue Share (%), by Country 2024 & 2032
- Figure 66: Europe Cognitive Analytics Market Volume Share (%), by Country 2024 & 2032
- Figure 67: Asia Pacific Cognitive Analytics Market Revenue (Million), by Deployment 2024 & 2032
- Figure 68: Asia Pacific Cognitive Analytics Market Volume (K Unit), by Deployment 2024 & 2032
- Figure 69: Asia Pacific Cognitive Analytics Market Revenue Share (%), by Deployment 2024 & 2032
- Figure 70: Asia Pacific Cognitive Analytics Market Volume Share (%), by Deployment 2024 & 2032
- Figure 71: Asia Pacific Cognitive Analytics Market Revenue (Million), by Component Type 2024 & 2032
- Figure 72: Asia Pacific Cognitive Analytics Market Volume (K Unit), by Component Type 2024 & 2032
- Figure 73: Asia Pacific Cognitive Analytics Market Revenue Share (%), by Component Type 2024 & 2032
- Figure 74: Asia Pacific Cognitive Analytics Market Volume Share (%), by Component Type 2024 & 2032
- Figure 75: Asia Pacific Cognitive Analytics Market Revenue (Million), by Technology Type 2024 & 2032
- Figure 76: Asia Pacific Cognitive Analytics Market Volume (K Unit), by Technology Type 2024 & 2032
- Figure 77: Asia Pacific Cognitive Analytics Market Revenue Share (%), by Technology Type 2024 & 2032
- Figure 78: Asia Pacific Cognitive Analytics Market Volume Share (%), by Technology Type 2024 & 2032
- Figure 79: Asia Pacific Cognitive Analytics Market Revenue (Million), by End-user Industry 2024 & 2032
- Figure 80: Asia Pacific Cognitive Analytics Market Volume (K Unit), by End-user Industry 2024 & 2032
- Figure 81: Asia Pacific Cognitive Analytics Market Revenue Share (%), by End-user Industry 2024 & 2032
- Figure 82: Asia Pacific Cognitive Analytics Market Volume Share (%), by End-user Industry 2024 & 2032
- Figure 83: Asia Pacific Cognitive Analytics Market Revenue (Million), by Country 2024 & 2032
- Figure 84: Asia Pacific Cognitive Analytics Market Volume (K Unit), by Country 2024 & 2032
- Figure 85: Asia Pacific Cognitive Analytics Market Revenue Share (%), by Country 2024 & 2032
- Figure 86: Asia Pacific Cognitive Analytics Market Volume Share (%), by Country 2024 & 2032
- Figure 87: Rest of the World Cognitive Analytics Market Revenue (Million), by Deployment 2024 & 2032
- Figure 88: Rest of the World Cognitive Analytics Market Volume (K Unit), by Deployment 2024 & 2032
- Figure 89: Rest of the World Cognitive Analytics Market Revenue Share (%), by Deployment 2024 & 2032
- Figure 90: Rest of the World Cognitive Analytics Market Volume Share (%), by Deployment 2024 & 2032
- Figure 91: Rest of the World Cognitive Analytics Market Revenue (Million), by Component Type 2024 & 2032
- Figure 92: Rest of the World Cognitive Analytics Market Volume (K Unit), by Component Type 2024 & 2032
- Figure 93: Rest of the World Cognitive Analytics Market Revenue Share (%), by Component Type 2024 & 2032
- Figure 94: Rest of the World Cognitive Analytics Market Volume Share (%), by Component Type 2024 & 2032
- Figure 95: Rest of the World Cognitive Analytics Market Revenue (Million), by Technology Type 2024 & 2032
- Figure 96: Rest of the World Cognitive Analytics Market Volume (K Unit), by Technology Type 2024 & 2032
- Figure 97: Rest of the World Cognitive Analytics Market Revenue Share (%), by Technology Type 2024 & 2032
- Figure 98: Rest of the World Cognitive Analytics Market Volume Share (%), by Technology Type 2024 & 2032
- Figure 99: Rest of the World Cognitive Analytics Market Revenue (Million), by End-user Industry 2024 & 2032
- Figure 100: Rest of the World Cognitive Analytics Market Volume (K Unit), by End-user Industry 2024 & 2032
- Figure 101: Rest of the World Cognitive Analytics Market Revenue Share (%), by End-user Industry 2024 & 2032
- Figure 102: Rest of the World Cognitive Analytics Market Volume Share (%), by End-user Industry 2024 & 2032
- Figure 103: Rest of the World Cognitive Analytics Market Revenue (Million), by Country 2024 & 2032
- Figure 104: Rest of the World Cognitive Analytics Market Volume (K Unit), by Country 2024 & 2032
- Figure 105: Rest of the World Cognitive Analytics Market Revenue Share (%), by Country 2024 & 2032
- Figure 106: Rest of the World Cognitive Analytics Market Volume Share (%), by Country 2024 & 2032
List of Tables
- Table 1: Global Cognitive Analytics Market Revenue Million Forecast, by Region 2019 & 2032
- Table 2: Global Cognitive Analytics Market Volume K Unit Forecast, by Region 2019 & 2032
- Table 3: Global Cognitive Analytics Market Revenue Million Forecast, by Deployment 2019 & 2032
- Table 4: Global Cognitive Analytics Market Volume K Unit Forecast, by Deployment 2019 & 2032
- Table 5: Global Cognitive Analytics Market Revenue Million Forecast, by Component Type 2019 & 2032
- Table 6: Global Cognitive Analytics Market Volume K Unit Forecast, by Component Type 2019 & 2032
- Table 7: Global Cognitive Analytics Market Revenue Million Forecast, by Technology Type 2019 & 2032
- Table 8: Global Cognitive Analytics Market Volume K Unit Forecast, by Technology Type 2019 & 2032
- Table 9: Global Cognitive Analytics Market Revenue Million Forecast, by End-user Industry 2019 & 2032
- Table 10: Global Cognitive Analytics Market Volume K Unit Forecast, by End-user Industry 2019 & 2032
- Table 11: Global Cognitive Analytics Market Revenue Million Forecast, by Region 2019 & 2032
- Table 12: Global Cognitive Analytics Market Volume K Unit Forecast, by Region 2019 & 2032
- Table 13: Global Cognitive Analytics Market Revenue Million Forecast, by Country 2019 & 2032
- Table 14: Global Cognitive Analytics Market Volume K Unit Forecast, by Country 2019 & 2032
- Table 15: United States Cognitive Analytics Market Revenue (Million) Forecast, by Application 2019 & 2032
- Table 16: United States Cognitive Analytics Market Volume (K Unit) Forecast, by Application 2019 & 2032
- Table 17: Canada Cognitive Analytics Market Revenue (Million) Forecast, by Application 2019 & 2032
- Table 18: Canada Cognitive Analytics Market Volume (K Unit) Forecast, by Application 2019 & 2032
- Table 19: Mexico Cognitive Analytics Market Revenue (Million) Forecast, by Application 2019 & 2032
- Table 20: Mexico Cognitive Analytics Market Volume (K Unit) Forecast, by Application 2019 & 2032
- Table 21: Global Cognitive Analytics Market Revenue Million Forecast, by Country 2019 & 2032
- Table 22: Global Cognitive Analytics Market Volume K Unit Forecast, by Country 2019 & 2032
- Table 23: Germany Cognitive Analytics Market Revenue (Million) Forecast, by Application 2019 & 2032
- Table 24: Germany Cognitive Analytics Market Volume (K Unit) Forecast, by Application 2019 & 2032
- Table 25: United Kingdom Cognitive Analytics Market Revenue (Million) Forecast, by Application 2019 & 2032
- Table 26: United Kingdom Cognitive Analytics Market Volume (K Unit) Forecast, by Application 2019 & 2032
- Table 27: France Cognitive Analytics Market Revenue (Million) Forecast, by Application 2019 & 2032
- Table 28: France Cognitive Analytics Market Volume (K Unit) Forecast, by Application 2019 & 2032
- Table 29: Spain Cognitive Analytics Market Revenue (Million) Forecast, by Application 2019 & 2032
- Table 30: Spain Cognitive Analytics Market Volume (K Unit) Forecast, by Application 2019 & 2032
- Table 31: Italy Cognitive Analytics Market Revenue (Million) Forecast, by Application 2019 & 2032
- Table 32: Italy Cognitive Analytics Market Volume (K Unit) Forecast, by Application 2019 & 2032
- Table 33: Spain Cognitive Analytics Market Revenue (Million) Forecast, by Application 2019 & 2032
- Table 34: Spain Cognitive Analytics Market Volume (K Unit) Forecast, by Application 2019 & 2032
- Table 35: Belgium Cognitive Analytics Market Revenue (Million) Forecast, by Application 2019 & 2032
- Table 36: Belgium Cognitive Analytics Market Volume (K Unit) Forecast, by Application 2019 & 2032
- Table 37: Netherland Cognitive Analytics Market Revenue (Million) Forecast, by Application 2019 & 2032
- Table 38: Netherland Cognitive Analytics Market Volume (K Unit) Forecast, by Application 2019 & 2032
- Table 39: Nordics Cognitive Analytics Market Revenue (Million) Forecast, by Application 2019 & 2032
- Table 40: Nordics Cognitive Analytics Market Volume (K Unit) Forecast, by Application 2019 & 2032
- Table 41: Rest of Europe Cognitive Analytics Market Revenue (Million) Forecast, by Application 2019 & 2032
- Table 42: Rest of Europe Cognitive Analytics Market Volume (K Unit) Forecast, by Application 2019 & 2032
- Table 43: Global Cognitive Analytics Market Revenue Million Forecast, by Country 2019 & 2032
- Table 44: Global Cognitive Analytics Market Volume K Unit Forecast, by Country 2019 & 2032
- Table 45: China Cognitive Analytics Market Revenue (Million) Forecast, by Application 2019 & 2032
- Table 46: China Cognitive Analytics Market Volume (K Unit) Forecast, by Application 2019 & 2032
- Table 47: Japan Cognitive Analytics Market Revenue (Million) Forecast, by Application 2019 & 2032
- Table 48: Japan Cognitive Analytics Market Volume (K Unit) Forecast, by Application 2019 & 2032
- Table 49: India Cognitive Analytics Market Revenue (Million) Forecast, by Application 2019 & 2032
- Table 50: India Cognitive Analytics Market Volume (K Unit) Forecast, by Application 2019 & 2032
- Table 51: South Korea Cognitive Analytics Market Revenue (Million) Forecast, by Application 2019 & 2032
- Table 52: South Korea Cognitive Analytics Market Volume (K Unit) Forecast, by Application 2019 & 2032
- Table 53: Southeast Asia Cognitive Analytics Market Revenue (Million) Forecast, by Application 2019 & 2032
- Table 54: Southeast Asia Cognitive Analytics Market Volume (K Unit) Forecast, by Application 2019 & 2032
- Table 55: Australia Cognitive Analytics Market Revenue (Million) Forecast, by Application 2019 & 2032
- Table 56: Australia Cognitive Analytics Market Volume (K Unit) Forecast, by Application 2019 & 2032
- Table 57: Indonesia Cognitive Analytics Market Revenue (Million) Forecast, by Application 2019 & 2032
- Table 58: Indonesia Cognitive Analytics Market Volume (K Unit) Forecast, by Application 2019 & 2032
- Table 59: Phillipes Cognitive Analytics Market Revenue (Million) Forecast, by Application 2019 & 2032
- Table 60: Phillipes Cognitive Analytics Market Volume (K Unit) Forecast, by Application 2019 & 2032
- Table 61: Singapore Cognitive Analytics Market Revenue (Million) Forecast, by Application 2019 & 2032
- Table 62: Singapore Cognitive Analytics Market Volume (K Unit) Forecast, by Application 2019 & 2032
- Table 63: Thailandc Cognitive Analytics Market Revenue (Million) Forecast, by Application 2019 & 2032
- Table 64: Thailandc Cognitive Analytics Market Volume (K Unit) Forecast, by Application 2019 & 2032
- Table 65: Rest of Asia Pacific Cognitive Analytics Market Revenue (Million) Forecast, by Application 2019 & 2032
- Table 66: Rest of Asia Pacific Cognitive Analytics Market Volume (K Unit) Forecast, by Application 2019 & 2032
- Table 67: Global Cognitive Analytics Market Revenue Million Forecast, by Country 2019 & 2032
- Table 68: Global Cognitive Analytics Market Volume K Unit Forecast, by Country 2019 & 2032
- Table 69: Brazil Cognitive Analytics Market Revenue (Million) Forecast, by Application 2019 & 2032
- Table 70: Brazil Cognitive Analytics Market Volume (K Unit) Forecast, by Application 2019 & 2032
- Table 71: Argentina Cognitive Analytics Market Revenue (Million) Forecast, by Application 2019 & 2032
- Table 72: Argentina Cognitive Analytics Market Volume (K Unit) Forecast, by Application 2019 & 2032
- Table 73: Peru Cognitive Analytics Market Revenue (Million) Forecast, by Application 2019 & 2032
- Table 74: Peru Cognitive Analytics Market Volume (K Unit) Forecast, by Application 2019 & 2032
- Table 75: Chile Cognitive Analytics Market Revenue (Million) Forecast, by Application 2019 & 2032
- Table 76: Chile Cognitive Analytics Market Volume (K Unit) Forecast, by Application 2019 & 2032
- Table 77: Colombia Cognitive Analytics Market Revenue (Million) Forecast, by Application 2019 & 2032
- Table 78: Colombia Cognitive Analytics Market Volume (K Unit) Forecast, by Application 2019 & 2032
- Table 79: Ecuador Cognitive Analytics Market Revenue (Million) Forecast, by Application 2019 & 2032
- Table 80: Ecuador Cognitive Analytics Market Volume (K Unit) Forecast, by Application 2019 & 2032
- Table 81: Venezuela Cognitive Analytics Market Revenue (Million) Forecast, by Application 2019 & 2032
- Table 82: Venezuela Cognitive Analytics Market Volume (K Unit) Forecast, by Application 2019 & 2032
- Table 83: Rest of South America Cognitive Analytics Market Revenue (Million) Forecast, by Application 2019 & 2032
- Table 84: Rest of South America Cognitive Analytics Market Volume (K Unit) Forecast, by Application 2019 & 2032
- Table 85: Global Cognitive Analytics Market Revenue Million Forecast, by Country 2019 & 2032
- Table 86: Global Cognitive Analytics Market Volume K Unit Forecast, by Country 2019 & 2032
- Table 87: United States Cognitive Analytics Market Revenue (Million) Forecast, by Application 2019 & 2032
- Table 88: United States Cognitive Analytics Market Volume (K Unit) Forecast, by Application 2019 & 2032
- Table 89: Canada Cognitive Analytics Market Revenue (Million) Forecast, by Application 2019 & 2032
- Table 90: Canada Cognitive Analytics Market Volume (K Unit) Forecast, by Application 2019 & 2032
- Table 91: Mexico Cognitive Analytics Market Revenue (Million) Forecast, by Application 2019 & 2032
- Table 92: Mexico Cognitive Analytics Market Volume (K Unit) Forecast, by Application 2019 & 2032
- Table 93: Global Cognitive Analytics Market Revenue Million Forecast, by Country 2019 & 2032
- Table 94: Global Cognitive Analytics Market Volume K Unit Forecast, by Country 2019 & 2032
- Table 95: United Arab Emirates Cognitive Analytics Market Revenue (Million) Forecast, by Application 2019 & 2032
- Table 96: United Arab Emirates Cognitive Analytics Market Volume (K Unit) Forecast, by Application 2019 & 2032
- Table 97: Saudi Arabia Cognitive Analytics Market Revenue (Million) Forecast, by Application 2019 & 2032
- Table 98: Saudi Arabia Cognitive Analytics Market Volume (K Unit) Forecast, by Application 2019 & 2032
- Table 99: South Africa Cognitive Analytics Market Revenue (Million) Forecast, by Application 2019 & 2032
- Table 100: South Africa Cognitive Analytics Market Volume (K Unit) Forecast, by Application 2019 & 2032
- Table 101: Rest of Middle East and Africa Cognitive Analytics Market Revenue (Million) Forecast, by Application 2019 & 2032
- Table 102: Rest of Middle East and Africa Cognitive Analytics Market Volume (K Unit) Forecast, by Application 2019 & 2032
- Table 103: Global Cognitive Analytics Market Revenue Million Forecast, by Deployment 2019 & 2032
- Table 104: Global Cognitive Analytics Market Volume K Unit Forecast, by Deployment 2019 & 2032
- Table 105: Global Cognitive Analytics Market Revenue Million Forecast, by Component Type 2019 & 2032
- Table 106: Global Cognitive Analytics Market Volume K Unit Forecast, by Component Type 2019 & 2032
- Table 107: Global Cognitive Analytics Market Revenue Million Forecast, by Technology Type 2019 & 2032
- Table 108: Global Cognitive Analytics Market Volume K Unit Forecast, by Technology Type 2019 & 2032
- Table 109: Global Cognitive Analytics Market Revenue Million Forecast, by End-user Industry 2019 & 2032
- Table 110: Global Cognitive Analytics Market Volume K Unit Forecast, by End-user Industry 2019 & 2032
- Table 111: Global Cognitive Analytics Market Revenue Million Forecast, by Country 2019 & 2032
- Table 112: Global Cognitive Analytics Market Volume K Unit Forecast, by Country 2019 & 2032
- Table 113: United States Cognitive Analytics Market Revenue (Million) Forecast, by Application 2019 & 2032
- Table 114: United States Cognitive Analytics Market Volume (K Unit) Forecast, by Application 2019 & 2032
- Table 115: Canada Cognitive Analytics Market Revenue (Million) Forecast, by Application 2019 & 2032
- Table 116: Canada Cognitive Analytics Market Volume (K Unit) Forecast, by Application 2019 & 2032
- Table 117: Global Cognitive Analytics Market Revenue Million Forecast, by Deployment 2019 & 2032
- Table 118: Global Cognitive Analytics Market Volume K Unit Forecast, by Deployment 2019 & 2032
- Table 119: Global Cognitive Analytics Market Revenue Million Forecast, by Component Type 2019 & 2032
- Table 120: Global Cognitive Analytics Market Volume K Unit Forecast, by Component Type 2019 & 2032
- Table 121: Global Cognitive Analytics Market Revenue Million Forecast, by Technology Type 2019 & 2032
- Table 122: Global Cognitive Analytics Market Volume K Unit Forecast, by Technology Type 2019 & 2032
- Table 123: Global Cognitive Analytics Market Revenue Million Forecast, by End-user Industry 2019 & 2032
- Table 124: Global Cognitive Analytics Market Volume K Unit Forecast, by End-user Industry 2019 & 2032
- Table 125: Global Cognitive Analytics Market Revenue Million Forecast, by Country 2019 & 2032
- Table 126: Global Cognitive Analytics Market Volume K Unit Forecast, by Country 2019 & 2032
- Table 127: United Kingdom Cognitive Analytics Market Revenue (Million) Forecast, by Application 2019 & 2032
- Table 128: United Kingdom Cognitive Analytics Market Volume (K Unit) Forecast, by Application 2019 & 2032
- Table 129: Germany Cognitive Analytics Market Revenue (Million) Forecast, by Application 2019 & 2032
- Table 130: Germany Cognitive Analytics Market Volume (K Unit) Forecast, by Application 2019 & 2032
- Table 131: France Cognitive Analytics Market Revenue (Million) Forecast, by Application 2019 & 2032
- Table 132: France Cognitive Analytics Market Volume (K Unit) Forecast, by Application 2019 & 2032
- Table 133: Rest of Europe Cognitive Analytics Market Revenue (Million) Forecast, by Application 2019 & 2032
- Table 134: Rest of Europe Cognitive Analytics Market Volume (K Unit) Forecast, by Application 2019 & 2032
- Table 135: Global Cognitive Analytics Market Revenue Million Forecast, by Deployment 2019 & 2032
- Table 136: Global Cognitive Analytics Market Volume K Unit Forecast, by Deployment 2019 & 2032
- Table 137: Global Cognitive Analytics Market Revenue Million Forecast, by Component Type 2019 & 2032
- Table 138: Global Cognitive Analytics Market Volume K Unit Forecast, by Component Type 2019 & 2032
- Table 139: Global Cognitive Analytics Market Revenue Million Forecast, by Technology Type 2019 & 2032
- Table 140: Global Cognitive Analytics Market Volume K Unit Forecast, by Technology Type 2019 & 2032
- Table 141: Global Cognitive Analytics Market Revenue Million Forecast, by End-user Industry 2019 & 2032
- Table 142: Global Cognitive Analytics Market Volume K Unit Forecast, by End-user Industry 2019 & 2032
- Table 143: Global Cognitive Analytics Market Revenue Million Forecast, by Country 2019 & 2032
- Table 144: Global Cognitive Analytics Market Volume K Unit Forecast, by Country 2019 & 2032
- Table 145: China Cognitive Analytics Market Revenue (Million) Forecast, by Application 2019 & 2032
- Table 146: China Cognitive Analytics Market Volume (K Unit) Forecast, by Application 2019 & 2032
- Table 147: Japan Cognitive Analytics Market Revenue (Million) Forecast, by Application 2019 & 2032
- Table 148: Japan Cognitive Analytics Market Volume (K Unit) Forecast, by Application 2019 & 2032
- Table 149: India Cognitive Analytics Market Revenue (Million) Forecast, by Application 2019 & 2032
- Table 150: India Cognitive Analytics Market Volume (K Unit) Forecast, by Application 2019 & 2032
- Table 151: Australia Cognitive Analytics Market Revenue (Million) Forecast, by Application 2019 & 2032
- Table 152: Australia Cognitive Analytics Market Volume (K Unit) Forecast, by Application 2019 & 2032
- Table 153: Rest of Asia Pacific Cognitive Analytics Market Revenue (Million) Forecast, by Application 2019 & 2032
- Table 154: Rest of Asia Pacific Cognitive Analytics Market Volume (K Unit) Forecast, by Application 2019 & 2032
- Table 155: Global Cognitive Analytics Market Revenue Million Forecast, by Deployment 2019 & 2032
- Table 156: Global Cognitive Analytics Market Volume K Unit Forecast, by Deployment 2019 & 2032
- Table 157: Global Cognitive Analytics Market Revenue Million Forecast, by Component Type 2019 & 2032
- Table 158: Global Cognitive Analytics Market Volume K Unit Forecast, by Component Type 2019 & 2032
- Table 159: Global Cognitive Analytics Market Revenue Million Forecast, by Technology Type 2019 & 2032
- Table 160: Global Cognitive Analytics Market Volume K Unit Forecast, by Technology Type 2019 & 2032
- Table 161: Global Cognitive Analytics Market Revenue Million Forecast, by End-user Industry 2019 & 2032
- Table 162: Global Cognitive Analytics Market Volume K Unit Forecast, by End-user Industry 2019 & 2032
- Table 163: Global Cognitive Analytics Market Revenue Million Forecast, by Country 2019 & 2032
- Table 164: Global Cognitive Analytics Market Volume K Unit Forecast, by Country 2019 & 2032
- Table 165: Latin America Cognitive Analytics Market Revenue (Million) Forecast, by Application 2019 & 2032
- Table 166: Latin America Cognitive Analytics Market Volume (K Unit) Forecast, by Application 2019 & 2032
- Table 167: Middle East Cognitive Analytics Market Revenue (Million) Forecast, by Application 2019 & 2032
- Table 168: Middle East Cognitive Analytics Market Volume (K Unit) Forecast, by Application 2019 & 2032
Frequently Asked Questions
1. What is the projected Compound Annual Growth Rate (CAGR) of the Cognitive Analytics Market?
The projected CAGR is approximately 40.00%.
2. Which companies are prominent players in the Cognitive Analytics Market?
Key companies in the market include Nuance Communications Inc, Amazon Web Services, IBM Corporation, Google LLC, Cisco Systems Inc, Microsoft Corporation, SAS Institute, Oracle Corporation, Narrative Science, Sinequa.
3. What are the main segments of the Cognitive Analytics Market?
The market segments include Deployment, Component Type, Technology Type, End-user Industry.
4. Can you provide details about the market size?
The market size is estimated to be USD XX Million as of 2022.
5. What are some drivers contributing to market growth?
; Rise in Adoption of Cognitive Computing Technology; Increasing Volume of Unstructured Data.
6. What are the notable trends driving market growth?
Healthcare Segment to Witness High Growth.
7. Are there any restraints impacting market growth?
; Complex Analytical Process.
8. Can you provide examples of recent developments in the market?
N/A
9. What pricing options are available for accessing the report?
Pricing options include single-user, multi-user, and enterprise licenses priced at USD 4750, USD 5250, and USD 8750 respectively.
10. Is the market size provided in terms of value or volume?
The market size is provided in terms of value, measured in Million and volume, measured in K Unit.
11. Are there any specific market keywords associated with the report?
Yes, the market keyword associated with the report is "Cognitive Analytics Market," which aids in identifying and referencing the specific market segment covered.
12. How do I determine which pricing option suits my needs best?
The pricing options vary based on user requirements and access needs. Individual users may opt for single-user licenses, while businesses requiring broader access may choose multi-user or enterprise licenses for cost-effective access to the report.
13. Are there any additional resources or data provided in the Cognitive Analytics Market report?
While the report offers comprehensive insights, it's advisable to review the specific contents or supplementary materials provided to ascertain if additional resources or data are available.
14. How can I stay updated on further developments or reports in the Cognitive Analytics Market?
To stay informed about further developments, trends, and reports in the Cognitive Analytics Market, consider subscribing to industry newsletters, following relevant companies and organizations, or regularly checking reputable industry news sources and publications.
Methodology
Step 1 - Identification of Relevant Samples Size from Population Database


Step 2 - Approaches for Defining Global Market Size (Value, Volume* & Price*)

Note*: In applicable scenarios
Step 3 - Data Sources
Primary Research
- Web Analytics
- Survey Reports
- Research Institute
- Latest Research Reports
- Opinion Leaders
Secondary Research
- Annual Reports
- White Paper
- Latest Press Release
- Industry Association
- Paid Database
- Investor Presentations

Step 4 - Data Triangulation
Involves using different sources of information in order to increase the validity of a study
These sources are likely to be stakeholders in a program - participants, other researchers, program staff, other community members, and so on.
Then we put all data in single framework & apply various statistical tools to find out the dynamic on the market.
During the analysis stage, feedback from the stakeholder groups would be compared to determine areas of agreement as well as areas of divergence


