
Key Insights
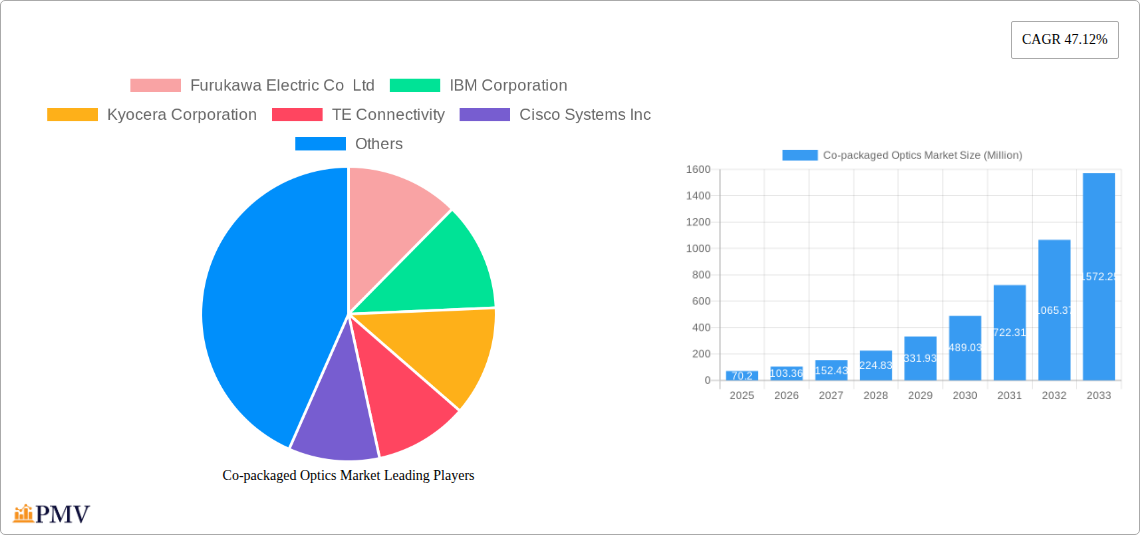
The co-packaged optics (CPO) market is experiencing explosive growth, driven by the increasing demand for higher bandwidth and lower power consumption in data centers and high-performance computing (HPC) environments. The market, valued at $70.20 million in 2025, is projected to exhibit a remarkable Compound Annual Growth Rate (CAGR) of 47.12% from 2025 to 2033. This rapid expansion is fueled by several key factors. The surging adoption of cloud computing and the proliferation of 5G networks are significantly boosting the need for high-speed, energy-efficient optical interconnects. Furthermore, advancements in silicon photonics and packaging technologies are enabling the development of smaller, more cost-effective CPO solutions, further accelerating market penetration. While initial high costs and technological complexities present some restraints, ongoing innovation and economies of scale are mitigating these challenges. Major players like Cisco, IBM, and Huawei are heavily investing in R&D and strategic partnerships to strengthen their market positions. Segment-wise, higher data rate segments are expected to witness the fastest growth due to the increasing bandwidth requirements of data-intensive applications. Geographically, North America and Asia-Pacific are anticipated to dominate the market, driven by robust technological advancements and substantial investments in data center infrastructure within these regions.
The competitive landscape is characterized by a mix of established players and emerging startups. Established companies leverage their existing infrastructure and expertise in optical communication technologies, while innovative startups are introducing disruptive technologies and business models. The market is likely to witness further consolidation and strategic alliances as companies strive to secure a dominant position. The forecast period (2025-2033) promises significant opportunities for market players. Focus on technological innovation, strategic partnerships, and expansion into emerging markets will be crucial for success in this dynamic and rapidly evolving market segment. The continued miniaturization of CPO modules and the development of more power-efficient solutions will be key drivers for future growth, particularly in the context of sustainable data center operations.
Co-packaged Optics Market: A Comprehensive Report (2019-2033)
This comprehensive report provides an in-depth analysis of the Co-packaged Optics (CPO) market, offering valuable insights for stakeholders across the value chain. The study period spans from 2019 to 2033, with 2025 serving as the base and estimated year. The report forecasts market trends from 2025 to 2033, building upon historical data from 2019 to 2024. Key players like Furukawa Electric Co Ltd, IBM Corporation, Kyocera Corporation, TE Connectivity, Cisco Systems Inc, Broadcom Inc, Microsoft Corporation, Ayar Labs Inc, Huawei Technologies Co Ltd, SENKO Advanced Components Inc, Hisense Broadband Multimedia Technology Co Ltd, Sumitomo Electric Industries Lt, Intel Corporation, and POET Technologies are analyzed, providing a 360-degree view of the competitive landscape. The report segments the market by data rates (less than xx, xx - xx, xx and above) and provides detailed regional analysis. The market is projected to reach xx Million by 2033, exhibiting a CAGR of xx%.
Co-packaged Optics Market Market Structure & Competitive Dynamics
The Co-packaged Optics market is characterized by a moderately concentrated structure, with a few key players holding significant market share. However, the emergence of innovative startups and increased M&A activity is reshaping the competitive dynamics. The market's innovation ecosystem is vibrant, driven by advancements in silicon photonics and the increasing demand for high-bandwidth data transmission. Regulatory frameworks, while largely supportive of technological advancements, present some challenges related to standardization and interoperability. Product substitutes, such as traditional optical transceivers, continue to compete, though CPO's advantages in terms of power efficiency and cost-effectiveness are gradually increasing their market penetration. End-user trends are strongly influenced by the growth of data centers, high-performance computing (HPC), and artificial intelligence (AI), creating a powerful tailwind for CPO adoption.
- Market Concentration: The top 5 players hold approximately xx% of the market share in 2025, with a slight decrease expected by 2033 to xx%.
- M&A Activity: Over the past five years, there have been approximately xx M&A deals in the CPO market, with a total value exceeding xx Million. These deals reflect a strategic consolidation and expansion efforts in the sector.
- Innovation Ecosystem: Significant investments in R&D by both established players and startups are fostering continuous improvements in technology and manufacturing processes.
- Regulatory Landscape: While generally favorable, regulatory frameworks are continually evolving to address issues of data security and interoperability in high-speed networks.
Co-packaged Optics Market Industry Trends & Insights
The Co-packaged Optics market is experiencing rapid growth, propelled by several key factors. The exponential rise of data centers, fueled by cloud computing and the proliferation of data-intensive applications like AI and machine learning, is a primary growth driver. Technological advancements in silicon photonics are enabling the development of smaller, more energy-efficient, and higher-bandwidth CPO solutions. Consumer preferences are shifting towards faster and more reliable data transmission capabilities, creating a demand for high-performance solutions like CPO. The competitive landscape is dynamic, with both established players and new entrants vying for market share through innovation and strategic partnerships. The market is expected to witness a CAGR of xx% during the forecast period, with market penetration increasing from xx% in 2025 to xx% by 2033. The increasing adoption of 5G and the deployment of next-generation data centers are also major contributors to the market's impressive growth trajectory. Increased competition is leading to price reductions, making CPO solutions more accessible across various sectors.

Dominant Markets & Segments in Co-packaged Optics Market
The North American region currently holds the largest share of the Co-packaged Optics market, driven by the high concentration of hyperscale data centers and strong demand from the technology sector. Within this region, the United States is the dominant country due to its robust technological infrastructure, supportive government policies, and substantial investments in R&D. The segment of "Less than xx Gbps" data rates currently holds the largest market share due to its widespread adoption across various applications. However, growth is expected to shift significantly towards higher data rate segments (xx Gbps and above) due to rapidly evolving network requirements.
- Key Drivers in North America:
- Extensive deployment of data centers and cloud infrastructure.
- Strong government support for technological advancements.
- High levels of R&D spending by major technology companies.
- Significant investments in 5G network infrastructure.
Co-packaged Optics Market Product Innovations
Recent product innovations focus on increasing data rates, enhancing power efficiency, and reducing costs. New CPO modules are integrating advanced silicon photonics technologies, enabling the development of compact and high-performance solutions. Applications are expanding beyond data centers to include high-performance computing, telecommunications, and automotive industries. The competitive advantages of these innovations lie in their superior bandwidth density, reduced power consumption, and smaller form factors compared to traditional optical transceivers. This makes them particularly attractive for applications with space and power constraints.
Report Segmentation & Scope
This report segments the Co-packaged Optics market by data rates: Less than xx Gbps, xx - xx Gbps, and xx Gbps and above. Each segment presents unique growth projections and competitive dynamics. The "Less than xx Gbps" segment currently holds the largest market share, but higher data rate segments are exhibiting faster growth. Market sizes for each segment are detailed in the full report, providing a granular view of the market's structure and future evolution.
Key Drivers of Co-packaged Optics Market Growth
Several key factors are driving the growth of the Co-packaged Optics market. The ever-increasing demand for high-bandwidth data transmission, fueled by the proliferation of data-intensive applications (AI, cloud computing, 5G), is a primary driver. Technological advancements in silicon photonics, leading to smaller, more efficient, and cost-effective CPO solutions, are another significant factor. Favorable regulatory frameworks and government initiatives supporting technological innovation further boost market growth. The increasing need for improved power efficiency in data centers and network infrastructure also plays a crucial role.
Challenges in the Co-packaged Optics Market Sector
The Co-packaged Optics market faces challenges including the high initial investment costs associated with adopting the technology. Supply chain complexities and potential material shortages can disrupt production and impact market growth. Intense competition among players and the need for standardization to ensure interoperability pose further hurdles. These factors, while significant, are not insurmountable and are expected to be addressed through continuous technological advancements and industry collaboration. The quantifiable impact of these challenges is estimated to slow market growth by approximately xx% in the short term, but this impact is expected to diminish as technology matures and supply chains improve.
Leading Players in the Co-packaged Optics Market Market
- Furukawa Electric Co Ltd
- IBM Corporation
- Kyocera Corporation
- TE Connectivity
- Cisco Systems Inc
- Broadcom Inc
- Microsoft Corporation
- Ayar Labs Inc
- Huawei Technologies Co Ltd
- SENKO Advanced Components Inc
- Hisense Broadband Multimedia Technology Co Ltd
- Sumitomo Electric Industries Lt
- Intel Corporation
- POET Technologies
Key Developments in Co-packaged Optics Market Sector
- March 2024: Intel developed a 4 Tbps bidirectional fully integrated OCI chiplet based on Intel’s in-house silicon photonics technology. This significantly enhances bandwidth capabilities for AI infrastructure.
- September 2023: TSMC collaborated with Broadcom and Nvidia to develop silicon photonics and co-packaged optics (CPO), highlighting the industry's commitment to meeting the escalating demand for high-speed data transmission driven by AI.
Strategic Co-packaged Optics Market Market Outlook
The Co-packaged Optics market is poised for continued strong growth, driven by sustained demand from data centers, high-performance computing, and other data-intensive applications. Strategic opportunities lie in developing innovative CPO solutions with higher data rates, improved power efficiency, and cost reductions. Companies focusing on strategic partnerships, R&D investments, and expansion into emerging markets are expected to gain a competitive edge. The future market potential is significant, with continued growth anticipated across various segments and geographical regions.
Co-packaged Optics Market Segmentation
-
1. Data Rates
- 1.1. Less than 1.6 T
- 1.2. 3.2 T
- 1.3. 6.4 T
Co-packaged Optics Market Segmentation By Geography
- 1. North America
- 2. Europe
- 3. Asia
- 4. Australia and New Zealand
- 5. Latin America
- 6. Middle East and Africa

Co-packaged Optics Market REPORT HIGHLIGHTS
| Aspects | Details |
|---|---|
| Study Period | 2019-2033 |
| Base Year | 2024 |
| Estimated Year | 2025 |
| Forecast Period | 2025-2033 |
| Historical Period | 2019-2024 |
| Growth Rate | CAGR of 47.12% from 2019-2033 |
| Segmentation |
|
Table of Contents
- 1. Introduction
- 1.1. Research Scope
- 1.2. Market Segmentation
- 1.3. Research Methodology
- 1.4. Definitions and Assumptions
- 2. Executive Summary
- 2.1. Introduction
- 3. Market Dynamics
- 3.1. Introduction
- 3.2. Market Drivers
- 3.2.1. Increase in Adoption of Smart Devices and Rise in Data Traffic; Growth in the Importance of Mega Data Centers; Growth in High-performance Computing
- 3.3. Market Restrains
- 3.3.1. Increase in Network Complexity; Device Compatibility and Sustainability Issues
- 3.4. Market Trends
- 3.4.1. Growth in High-performance Computing
- 4. Market Factor Analysis
- 4.1. Porters Five Forces
- 4.2. Supply/Value Chain
- 4.3. PESTEL analysis
- 4.4. Market Entropy
- 4.5. Patent/Trademark Analysis
- 5. Global Co-packaged Optics Market Analysis, Insights and Forecast, 2019-2031
- 5.1. Market Analysis, Insights and Forecast - by Data Rates
- 5.1.1. Less than 1.6 T
- 5.1.2. 3.2 T
- 5.1.3. 6.4 T
- 5.2. Market Analysis, Insights and Forecast - by Region
- 5.2.1. North America
- 5.2.2. Europe
- 5.2.3. Asia
- 5.2.4. Australia and New Zealand
- 5.2.5. Latin America
- 5.2.6. Middle East and Africa
- 5.1. Market Analysis, Insights and Forecast - by Data Rates
- 6. North America Co-packaged Optics Market Analysis, Insights and Forecast, 2019-2031
- 6.1. Market Analysis, Insights and Forecast - by Data Rates
- 6.1.1. Less than 1.6 T
- 6.1.2. 3.2 T
- 6.1.3. 6.4 T
- 6.1. Market Analysis, Insights and Forecast - by Data Rates
- 7. Europe Co-packaged Optics Market Analysis, Insights and Forecast, 2019-2031
- 7.1. Market Analysis, Insights and Forecast - by Data Rates
- 7.1.1. Less than 1.6 T
- 7.1.2. 3.2 T
- 7.1.3. 6.4 T
- 7.1. Market Analysis, Insights and Forecast - by Data Rates
- 8. Asia Co-packaged Optics Market Analysis, Insights and Forecast, 2019-2031
- 8.1. Market Analysis, Insights and Forecast - by Data Rates
- 8.1.1. Less than 1.6 T
- 8.1.2. 3.2 T
- 8.1.3. 6.4 T
- 8.1. Market Analysis, Insights and Forecast - by Data Rates
- 9. Australia and New Zealand Co-packaged Optics Market Analysis, Insights and Forecast, 2019-2031
- 9.1. Market Analysis, Insights and Forecast - by Data Rates
- 9.1.1. Less than 1.6 T
- 9.1.2. 3.2 T
- 9.1.3. 6.4 T
- 9.1. Market Analysis, Insights and Forecast - by Data Rates
- 10. Latin America Co-packaged Optics Market Analysis, Insights and Forecast, 2019-2031
- 10.1. Market Analysis, Insights and Forecast - by Data Rates
- 10.1.1. Less than 1.6 T
- 10.1.2. 3.2 T
- 10.1.3. 6.4 T
- 10.1. Market Analysis, Insights and Forecast - by Data Rates
- 11. Middle East and Africa Co-packaged Optics Market Analysis, Insights and Forecast, 2019-2031
- 11.1. Market Analysis, Insights and Forecast - by Data Rates
- 11.1.1. Less than 1.6 T
- 11.1.2. 3.2 T
- 11.1.3. 6.4 T
- 11.1. Market Analysis, Insights and Forecast - by Data Rates
- 12. North America Co-packaged Optics Market Analysis, Insights and Forecast, 2019-2031
- 12.1. Market Analysis, Insights and Forecast - By Country/Sub-region
- 12.1.1 United States
- 12.1.2 Canada
- 12.1.3 Mexico
- 13. Europe Co-packaged Optics Market Analysis, Insights and Forecast, 2019-2031
- 13.1. Market Analysis, Insights and Forecast - By Country/Sub-region
- 13.1.1 Germany
- 13.1.2 United Kingdom
- 13.1.3 France
- 13.1.4 Spain
- 13.1.5 Italy
- 13.1.6 Spain
- 13.1.7 Belgium
- 13.1.8 Netherland
- 13.1.9 Nordics
- 13.1.10 Rest of Europe
- 14. Asia Pacific Co-packaged Optics Market Analysis, Insights and Forecast, 2019-2031
- 14.1. Market Analysis, Insights and Forecast - By Country/Sub-region
- 14.1.1 China
- 14.1.2 Japan
- 14.1.3 India
- 14.1.4 South Korea
- 14.1.5 Southeast Asia
- 14.1.6 Australia
- 14.1.7 Indonesia
- 14.1.8 Phillipes
- 14.1.9 Singapore
- 14.1.10 Thailandc
- 14.1.11 Rest of Asia Pacific
- 15. South America Co-packaged Optics Market Analysis, Insights and Forecast, 2019-2031
- 15.1. Market Analysis, Insights and Forecast - By Country/Sub-region
- 15.1.1 Brazil
- 15.1.2 Argentina
- 15.1.3 Peru
- 15.1.4 Chile
- 15.1.5 Colombia
- 15.1.6 Ecuador
- 15.1.7 Venezuela
- 15.1.8 Rest of South America
- 16. North America Co-packaged Optics Market Analysis, Insights and Forecast, 2019-2031
- 16.1. Market Analysis, Insights and Forecast - By Country/Sub-region
- 16.1.1 United States
- 16.1.2 Canada
- 16.1.3 Mexico
- 17. MEA Co-packaged Optics Market Analysis, Insights and Forecast, 2019-2031
- 17.1. Market Analysis, Insights and Forecast - By Country/Sub-region
- 17.1.1 United Arab Emirates
- 17.1.2 Saudi Arabia
- 17.1.3 South Africa
- 17.1.4 Rest of Middle East and Africa
- 18. Competitive Analysis
- 18.1. Global Market Share Analysis 2024
- 18.2. Company Profiles
- 18.2.1 Furukawa Electric Co Ltd
- 18.2.1.1. Overview
- 18.2.1.2. Products
- 18.2.1.3. SWOT Analysis
- 18.2.1.4. Recent Developments
- 18.2.1.5. Financials (Based on Availability)
- 18.2.2 IBM Corporation
- 18.2.2.1. Overview
- 18.2.2.2. Products
- 18.2.2.3. SWOT Analysis
- 18.2.2.4. Recent Developments
- 18.2.2.5. Financials (Based on Availability)
- 18.2.3 Kyocera Corporation
- 18.2.3.1. Overview
- 18.2.3.2. Products
- 18.2.3.3. SWOT Analysis
- 18.2.3.4. Recent Developments
- 18.2.3.5. Financials (Based on Availability)
- 18.2.4 TE Connectivity
- 18.2.4.1. Overview
- 18.2.4.2. Products
- 18.2.4.3. SWOT Analysis
- 18.2.4.4. Recent Developments
- 18.2.4.5. Financials (Based on Availability)
- 18.2.5 Cisco Systems Inc
- 18.2.5.1. Overview
- 18.2.5.2. Products
- 18.2.5.3. SWOT Analysis
- 18.2.5.4. Recent Developments
- 18.2.5.5. Financials (Based on Availability)
- 18.2.6 Broadcom Inc
- 18.2.6.1. Overview
- 18.2.6.2. Products
- 18.2.6.3. SWOT Analysis
- 18.2.6.4. Recent Developments
- 18.2.6.5. Financials (Based on Availability)
- 18.2.7 Microsoft Corporation
- 18.2.7.1. Overview
- 18.2.7.2. Products
- 18.2.7.3. SWOT Analysis
- 18.2.7.4. Recent Developments
- 18.2.7.5. Financials (Based on Availability)
- 18.2.8 Ayar Labs Inc
- 18.2.8.1. Overview
- 18.2.8.2. Products
- 18.2.8.3. SWOT Analysis
- 18.2.8.4. Recent Developments
- 18.2.8.5. Financials (Based on Availability)
- 18.2.9 Huawei Technologies Co Ltd
- 18.2.9.1. Overview
- 18.2.9.2. Products
- 18.2.9.3. SWOT Analysis
- 18.2.9.4. Recent Developments
- 18.2.9.5. Financials (Based on Availability)
- 18.2.10 SENKO Advanced Components Inc
- 18.2.10.1. Overview
- 18.2.10.2. Products
- 18.2.10.3. SWOT Analysis
- 18.2.10.4. Recent Developments
- 18.2.10.5. Financials (Based on Availability)
- 18.2.11 Hisense Broadband Multimedia Technology Co Ltd
- 18.2.11.1. Overview
- 18.2.11.2. Products
- 18.2.11.3. SWOT Analysis
- 18.2.11.4. Recent Developments
- 18.2.11.5. Financials (Based on Availability)
- 18.2.12 Sumitomo Electric Industries Lt
- 18.2.12.1. Overview
- 18.2.12.2. Products
- 18.2.12.3. SWOT Analysis
- 18.2.12.4. Recent Developments
- 18.2.12.5. Financials (Based on Availability)
- 18.2.13 Intel Corporation
- 18.2.13.1. Overview
- 18.2.13.2. Products
- 18.2.13.3. SWOT Analysis
- 18.2.13.4. Recent Developments
- 18.2.13.5. Financials (Based on Availability)
- 18.2.14 POET Technologies
- 18.2.14.1. Overview
- 18.2.14.2. Products
- 18.2.14.3. SWOT Analysis
- 18.2.14.4. Recent Developments
- 18.2.14.5. Financials (Based on Availability)
- 18.2.1 Furukawa Electric Co Ltd
List of Figures
- Figure 1: Global Co-packaged Optics Market Revenue Breakdown (Million, %) by Region 2024 & 2032
- Figure 2: Global Co-packaged Optics Market Volume Breakdown (K Unit, %) by Region 2024 & 2032
- Figure 3: North America Co-packaged Optics Market Revenue (Million), by Country 2024 & 2032
- Figure 4: North America Co-packaged Optics Market Volume (K Unit), by Country 2024 & 2032
- Figure 5: North America Co-packaged Optics Market Revenue Share (%), by Country 2024 & 2032
- Figure 6: North America Co-packaged Optics Market Volume Share (%), by Country 2024 & 2032
- Figure 7: Europe Co-packaged Optics Market Revenue (Million), by Country 2024 & 2032
- Figure 8: Europe Co-packaged Optics Market Volume (K Unit), by Country 2024 & 2032
- Figure 9: Europe Co-packaged Optics Market Revenue Share (%), by Country 2024 & 2032
- Figure 10: Europe Co-packaged Optics Market Volume Share (%), by Country 2024 & 2032
- Figure 11: Asia Pacific Co-packaged Optics Market Revenue (Million), by Country 2024 & 2032
- Figure 12: Asia Pacific Co-packaged Optics Market Volume (K Unit), by Country 2024 & 2032
- Figure 13: Asia Pacific Co-packaged Optics Market Revenue Share (%), by Country 2024 & 2032
- Figure 14: Asia Pacific Co-packaged Optics Market Volume Share (%), by Country 2024 & 2032
- Figure 15: South America Co-packaged Optics Market Revenue (Million), by Country 2024 & 2032
- Figure 16: South America Co-packaged Optics Market Volume (K Unit), by Country 2024 & 2032
- Figure 17: South America Co-packaged Optics Market Revenue Share (%), by Country 2024 & 2032
- Figure 18: South America Co-packaged Optics Market Volume Share (%), by Country 2024 & 2032
- Figure 19: North America Co-packaged Optics Market Revenue (Million), by Country 2024 & 2032
- Figure 20: North America Co-packaged Optics Market Volume (K Unit), by Country 2024 & 2032
- Figure 21: North America Co-packaged Optics Market Revenue Share (%), by Country 2024 & 2032
- Figure 22: North America Co-packaged Optics Market Volume Share (%), by Country 2024 & 2032
- Figure 23: MEA Co-packaged Optics Market Revenue (Million), by Country 2024 & 2032
- Figure 24: MEA Co-packaged Optics Market Volume (K Unit), by Country 2024 & 2032
- Figure 25: MEA Co-packaged Optics Market Revenue Share (%), by Country 2024 & 2032
- Figure 26: MEA Co-packaged Optics Market Volume Share (%), by Country 2024 & 2032
- Figure 27: North America Co-packaged Optics Market Revenue (Million), by Data Rates 2024 & 2032
- Figure 28: North America Co-packaged Optics Market Volume (K Unit), by Data Rates 2024 & 2032
- Figure 29: North America Co-packaged Optics Market Revenue Share (%), by Data Rates 2024 & 2032
- Figure 30: North America Co-packaged Optics Market Volume Share (%), by Data Rates 2024 & 2032
- Figure 31: North America Co-packaged Optics Market Revenue (Million), by Country 2024 & 2032
- Figure 32: North America Co-packaged Optics Market Volume (K Unit), by Country 2024 & 2032
- Figure 33: North America Co-packaged Optics Market Revenue Share (%), by Country 2024 & 2032
- Figure 34: North America Co-packaged Optics Market Volume Share (%), by Country 2024 & 2032
- Figure 35: Europe Co-packaged Optics Market Revenue (Million), by Data Rates 2024 & 2032
- Figure 36: Europe Co-packaged Optics Market Volume (K Unit), by Data Rates 2024 & 2032
- Figure 37: Europe Co-packaged Optics Market Revenue Share (%), by Data Rates 2024 & 2032
- Figure 38: Europe Co-packaged Optics Market Volume Share (%), by Data Rates 2024 & 2032
- Figure 39: Europe Co-packaged Optics Market Revenue (Million), by Country 2024 & 2032
- Figure 40: Europe Co-packaged Optics Market Volume (K Unit), by Country 2024 & 2032
- Figure 41: Europe Co-packaged Optics Market Revenue Share (%), by Country 2024 & 2032
- Figure 42: Europe Co-packaged Optics Market Volume Share (%), by Country 2024 & 2032
- Figure 43: Asia Co-packaged Optics Market Revenue (Million), by Data Rates 2024 & 2032
- Figure 44: Asia Co-packaged Optics Market Volume (K Unit), by Data Rates 2024 & 2032
- Figure 45: Asia Co-packaged Optics Market Revenue Share (%), by Data Rates 2024 & 2032
- Figure 46: Asia Co-packaged Optics Market Volume Share (%), by Data Rates 2024 & 2032
- Figure 47: Asia Co-packaged Optics Market Revenue (Million), by Country 2024 & 2032
- Figure 48: Asia Co-packaged Optics Market Volume (K Unit), by Country 2024 & 2032
- Figure 49: Asia Co-packaged Optics Market Revenue Share (%), by Country 2024 & 2032
- Figure 50: Asia Co-packaged Optics Market Volume Share (%), by Country 2024 & 2032
- Figure 51: Australia and New Zealand Co-packaged Optics Market Revenue (Million), by Data Rates 2024 & 2032
- Figure 52: Australia and New Zealand Co-packaged Optics Market Volume (K Unit), by Data Rates 2024 & 2032
- Figure 53: Australia and New Zealand Co-packaged Optics Market Revenue Share (%), by Data Rates 2024 & 2032
- Figure 54: Australia and New Zealand Co-packaged Optics Market Volume Share (%), by Data Rates 2024 & 2032
- Figure 55: Australia and New Zealand Co-packaged Optics Market Revenue (Million), by Country 2024 & 2032
- Figure 56: Australia and New Zealand Co-packaged Optics Market Volume (K Unit), by Country 2024 & 2032
- Figure 57: Australia and New Zealand Co-packaged Optics Market Revenue Share (%), by Country 2024 & 2032
- Figure 58: Australia and New Zealand Co-packaged Optics Market Volume Share (%), by Country 2024 & 2032
- Figure 59: Latin America Co-packaged Optics Market Revenue (Million), by Data Rates 2024 & 2032
- Figure 60: Latin America Co-packaged Optics Market Volume (K Unit), by Data Rates 2024 & 2032
- Figure 61: Latin America Co-packaged Optics Market Revenue Share (%), by Data Rates 2024 & 2032
- Figure 62: Latin America Co-packaged Optics Market Volume Share (%), by Data Rates 2024 & 2032
- Figure 63: Latin America Co-packaged Optics Market Revenue (Million), by Country 2024 & 2032
- Figure 64: Latin America Co-packaged Optics Market Volume (K Unit), by Country 2024 & 2032
- Figure 65: Latin America Co-packaged Optics Market Revenue Share (%), by Country 2024 & 2032
- Figure 66: Latin America Co-packaged Optics Market Volume Share (%), by Country 2024 & 2032
- Figure 67: Middle East and Africa Co-packaged Optics Market Revenue (Million), by Data Rates 2024 & 2032
- Figure 68: Middle East and Africa Co-packaged Optics Market Volume (K Unit), by Data Rates 2024 & 2032
- Figure 69: Middle East and Africa Co-packaged Optics Market Revenue Share (%), by Data Rates 2024 & 2032
- Figure 70: Middle East and Africa Co-packaged Optics Market Volume Share (%), by Data Rates 2024 & 2032
- Figure 71: Middle East and Africa Co-packaged Optics Market Revenue (Million), by Country 2024 & 2032
- Figure 72: Middle East and Africa Co-packaged Optics Market Volume (K Unit), by Country 2024 & 2032
- Figure 73: Middle East and Africa Co-packaged Optics Market Revenue Share (%), by Country 2024 & 2032
- Figure 74: Middle East and Africa Co-packaged Optics Market Volume Share (%), by Country 2024 & 2032
List of Tables
- Table 1: Global Co-packaged Optics Market Revenue Million Forecast, by Region 2019 & 2032
- Table 2: Global Co-packaged Optics Market Volume K Unit Forecast, by Region 2019 & 2032
- Table 3: Global Co-packaged Optics Market Revenue Million Forecast, by Data Rates 2019 & 2032
- Table 4: Global Co-packaged Optics Market Volume K Unit Forecast, by Data Rates 2019 & 2032
- Table 5: Global Co-packaged Optics Market Revenue Million Forecast, by Region 2019 & 2032
- Table 6: Global Co-packaged Optics Market Volume K Unit Forecast, by Region 2019 & 2032
- Table 7: Global Co-packaged Optics Market Revenue Million Forecast, by Country 2019 & 2032
- Table 8: Global Co-packaged Optics Market Volume K Unit Forecast, by Country 2019 & 2032
- Table 9: United States Co-packaged Optics Market Revenue (Million) Forecast, by Application 2019 & 2032
- Table 10: United States Co-packaged Optics Market Volume (K Unit) Forecast, by Application 2019 & 2032
- Table 11: Canada Co-packaged Optics Market Revenue (Million) Forecast, by Application 2019 & 2032
- Table 12: Canada Co-packaged Optics Market Volume (K Unit) Forecast, by Application 2019 & 2032
- Table 13: Mexico Co-packaged Optics Market Revenue (Million) Forecast, by Application 2019 & 2032
- Table 14: Mexico Co-packaged Optics Market Volume (K Unit) Forecast, by Application 2019 & 2032
- Table 15: Global Co-packaged Optics Market Revenue Million Forecast, by Country 2019 & 2032
- Table 16: Global Co-packaged Optics Market Volume K Unit Forecast, by Country 2019 & 2032
- Table 17: Germany Co-packaged Optics Market Revenue (Million) Forecast, by Application 2019 & 2032
- Table 18: Germany Co-packaged Optics Market Volume (K Unit) Forecast, by Application 2019 & 2032
- Table 19: United Kingdom Co-packaged Optics Market Revenue (Million) Forecast, by Application 2019 & 2032
- Table 20: United Kingdom Co-packaged Optics Market Volume (K Unit) Forecast, by Application 2019 & 2032
- Table 21: France Co-packaged Optics Market Revenue (Million) Forecast, by Application 2019 & 2032
- Table 22: France Co-packaged Optics Market Volume (K Unit) Forecast, by Application 2019 & 2032
- Table 23: Spain Co-packaged Optics Market Revenue (Million) Forecast, by Application 2019 & 2032
- Table 24: Spain Co-packaged Optics Market Volume (K Unit) Forecast, by Application 2019 & 2032
- Table 25: Italy Co-packaged Optics Market Revenue (Million) Forecast, by Application 2019 & 2032
- Table 26: Italy Co-packaged Optics Market Volume (K Unit) Forecast, by Application 2019 & 2032
- Table 27: Spain Co-packaged Optics Market Revenue (Million) Forecast, by Application 2019 & 2032
- Table 28: Spain Co-packaged Optics Market Volume (K Unit) Forecast, by Application 2019 & 2032
- Table 29: Belgium Co-packaged Optics Market Revenue (Million) Forecast, by Application 2019 & 2032
- Table 30: Belgium Co-packaged Optics Market Volume (K Unit) Forecast, by Application 2019 & 2032
- Table 31: Netherland Co-packaged Optics Market Revenue (Million) Forecast, by Application 2019 & 2032
- Table 32: Netherland Co-packaged Optics Market Volume (K Unit) Forecast, by Application 2019 & 2032
- Table 33: Nordics Co-packaged Optics Market Revenue (Million) Forecast, by Application 2019 & 2032
- Table 34: Nordics Co-packaged Optics Market Volume (K Unit) Forecast, by Application 2019 & 2032
- Table 35: Rest of Europe Co-packaged Optics Market Revenue (Million) Forecast, by Application 2019 & 2032
- Table 36: Rest of Europe Co-packaged Optics Market Volume (K Unit) Forecast, by Application 2019 & 2032
- Table 37: Global Co-packaged Optics Market Revenue Million Forecast, by Country 2019 & 2032
- Table 38: Global Co-packaged Optics Market Volume K Unit Forecast, by Country 2019 & 2032
- Table 39: China Co-packaged Optics Market Revenue (Million) Forecast, by Application 2019 & 2032
- Table 40: China Co-packaged Optics Market Volume (K Unit) Forecast, by Application 2019 & 2032
- Table 41: Japan Co-packaged Optics Market Revenue (Million) Forecast, by Application 2019 & 2032
- Table 42: Japan Co-packaged Optics Market Volume (K Unit) Forecast, by Application 2019 & 2032
- Table 43: India Co-packaged Optics Market Revenue (Million) Forecast, by Application 2019 & 2032
- Table 44: India Co-packaged Optics Market Volume (K Unit) Forecast, by Application 2019 & 2032
- Table 45: South Korea Co-packaged Optics Market Revenue (Million) Forecast, by Application 2019 & 2032
- Table 46: South Korea Co-packaged Optics Market Volume (K Unit) Forecast, by Application 2019 & 2032
- Table 47: Southeast Asia Co-packaged Optics Market Revenue (Million) Forecast, by Application 2019 & 2032
- Table 48: Southeast Asia Co-packaged Optics Market Volume (K Unit) Forecast, by Application 2019 & 2032
- Table 49: Australia Co-packaged Optics Market Revenue (Million) Forecast, by Application 2019 & 2032
- Table 50: Australia Co-packaged Optics Market Volume (K Unit) Forecast, by Application 2019 & 2032
- Table 51: Indonesia Co-packaged Optics Market Revenue (Million) Forecast, by Application 2019 & 2032
- Table 52: Indonesia Co-packaged Optics Market Volume (K Unit) Forecast, by Application 2019 & 2032
- Table 53: Phillipes Co-packaged Optics Market Revenue (Million) Forecast, by Application 2019 & 2032
- Table 54: Phillipes Co-packaged Optics Market Volume (K Unit) Forecast, by Application 2019 & 2032
- Table 55: Singapore Co-packaged Optics Market Revenue (Million) Forecast, by Application 2019 & 2032
- Table 56: Singapore Co-packaged Optics Market Volume (K Unit) Forecast, by Application 2019 & 2032
- Table 57: Thailandc Co-packaged Optics Market Revenue (Million) Forecast, by Application 2019 & 2032
- Table 58: Thailandc Co-packaged Optics Market Volume (K Unit) Forecast, by Application 2019 & 2032
- Table 59: Rest of Asia Pacific Co-packaged Optics Market Revenue (Million) Forecast, by Application 2019 & 2032
- Table 60: Rest of Asia Pacific Co-packaged Optics Market Volume (K Unit) Forecast, by Application 2019 & 2032
- Table 61: Global Co-packaged Optics Market Revenue Million Forecast, by Country 2019 & 2032
- Table 62: Global Co-packaged Optics Market Volume K Unit Forecast, by Country 2019 & 2032
- Table 63: Brazil Co-packaged Optics Market Revenue (Million) Forecast, by Application 2019 & 2032
- Table 64: Brazil Co-packaged Optics Market Volume (K Unit) Forecast, by Application 2019 & 2032
- Table 65: Argentina Co-packaged Optics Market Revenue (Million) Forecast, by Application 2019 & 2032
- Table 66: Argentina Co-packaged Optics Market Volume (K Unit) Forecast, by Application 2019 & 2032
- Table 67: Peru Co-packaged Optics Market Revenue (Million) Forecast, by Application 2019 & 2032
- Table 68: Peru Co-packaged Optics Market Volume (K Unit) Forecast, by Application 2019 & 2032
- Table 69: Chile Co-packaged Optics Market Revenue (Million) Forecast, by Application 2019 & 2032
- Table 70: Chile Co-packaged Optics Market Volume (K Unit) Forecast, by Application 2019 & 2032
- Table 71: Colombia Co-packaged Optics Market Revenue (Million) Forecast, by Application 2019 & 2032
- Table 72: Colombia Co-packaged Optics Market Volume (K Unit) Forecast, by Application 2019 & 2032
- Table 73: Ecuador Co-packaged Optics Market Revenue (Million) Forecast, by Application 2019 & 2032
- Table 74: Ecuador Co-packaged Optics Market Volume (K Unit) Forecast, by Application 2019 & 2032
- Table 75: Venezuela Co-packaged Optics Market Revenue (Million) Forecast, by Application 2019 & 2032
- Table 76: Venezuela Co-packaged Optics Market Volume (K Unit) Forecast, by Application 2019 & 2032
- Table 77: Rest of South America Co-packaged Optics Market Revenue (Million) Forecast, by Application 2019 & 2032
- Table 78: Rest of South America Co-packaged Optics Market Volume (K Unit) Forecast, by Application 2019 & 2032
- Table 79: Global Co-packaged Optics Market Revenue Million Forecast, by Country 2019 & 2032
- Table 80: Global Co-packaged Optics Market Volume K Unit Forecast, by Country 2019 & 2032
- Table 81: United States Co-packaged Optics Market Revenue (Million) Forecast, by Application 2019 & 2032
- Table 82: United States Co-packaged Optics Market Volume (K Unit) Forecast, by Application 2019 & 2032
- Table 83: Canada Co-packaged Optics Market Revenue (Million) Forecast, by Application 2019 & 2032
- Table 84: Canada Co-packaged Optics Market Volume (K Unit) Forecast, by Application 2019 & 2032
- Table 85: Mexico Co-packaged Optics Market Revenue (Million) Forecast, by Application 2019 & 2032
- Table 86: Mexico Co-packaged Optics Market Volume (K Unit) Forecast, by Application 2019 & 2032
- Table 87: Global Co-packaged Optics Market Revenue Million Forecast, by Country 2019 & 2032
- Table 88: Global Co-packaged Optics Market Volume K Unit Forecast, by Country 2019 & 2032
- Table 89: United Arab Emirates Co-packaged Optics Market Revenue (Million) Forecast, by Application 2019 & 2032
- Table 90: United Arab Emirates Co-packaged Optics Market Volume (K Unit) Forecast, by Application 2019 & 2032
- Table 91: Saudi Arabia Co-packaged Optics Market Revenue (Million) Forecast, by Application 2019 & 2032
- Table 92: Saudi Arabia Co-packaged Optics Market Volume (K Unit) Forecast, by Application 2019 & 2032
- Table 93: South Africa Co-packaged Optics Market Revenue (Million) Forecast, by Application 2019 & 2032
- Table 94: South Africa Co-packaged Optics Market Volume (K Unit) Forecast, by Application 2019 & 2032
- Table 95: Rest of Middle East and Africa Co-packaged Optics Market Revenue (Million) Forecast, by Application 2019 & 2032
- Table 96: Rest of Middle East and Africa Co-packaged Optics Market Volume (K Unit) Forecast, by Application 2019 & 2032
- Table 97: Global Co-packaged Optics Market Revenue Million Forecast, by Data Rates 2019 & 2032
- Table 98: Global Co-packaged Optics Market Volume K Unit Forecast, by Data Rates 2019 & 2032
- Table 99: Global Co-packaged Optics Market Revenue Million Forecast, by Country 2019 & 2032
- Table 100: Global Co-packaged Optics Market Volume K Unit Forecast, by Country 2019 & 2032
- Table 101: Global Co-packaged Optics Market Revenue Million Forecast, by Data Rates 2019 & 2032
- Table 102: Global Co-packaged Optics Market Volume K Unit Forecast, by Data Rates 2019 & 2032
- Table 103: Global Co-packaged Optics Market Revenue Million Forecast, by Country 2019 & 2032
- Table 104: Global Co-packaged Optics Market Volume K Unit Forecast, by Country 2019 & 2032
- Table 105: Global Co-packaged Optics Market Revenue Million Forecast, by Data Rates 2019 & 2032
- Table 106: Global Co-packaged Optics Market Volume K Unit Forecast, by Data Rates 2019 & 2032
- Table 107: Global Co-packaged Optics Market Revenue Million Forecast, by Country 2019 & 2032
- Table 108: Global Co-packaged Optics Market Volume K Unit Forecast, by Country 2019 & 2032
- Table 109: Global Co-packaged Optics Market Revenue Million Forecast, by Data Rates 2019 & 2032
- Table 110: Global Co-packaged Optics Market Volume K Unit Forecast, by Data Rates 2019 & 2032
- Table 111: Global Co-packaged Optics Market Revenue Million Forecast, by Country 2019 & 2032
- Table 112: Global Co-packaged Optics Market Volume K Unit Forecast, by Country 2019 & 2032
- Table 113: Global Co-packaged Optics Market Revenue Million Forecast, by Data Rates 2019 & 2032
- Table 114: Global Co-packaged Optics Market Volume K Unit Forecast, by Data Rates 2019 & 2032
- Table 115: Global Co-packaged Optics Market Revenue Million Forecast, by Country 2019 & 2032
- Table 116: Global Co-packaged Optics Market Volume K Unit Forecast, by Country 2019 & 2032
- Table 117: Global Co-packaged Optics Market Revenue Million Forecast, by Data Rates 2019 & 2032
- Table 118: Global Co-packaged Optics Market Volume K Unit Forecast, by Data Rates 2019 & 2032
- Table 119: Global Co-packaged Optics Market Revenue Million Forecast, by Country 2019 & 2032
- Table 120: Global Co-packaged Optics Market Volume K Unit Forecast, by Country 2019 & 2032
Frequently Asked Questions
1. What is the projected Compound Annual Growth Rate (CAGR) of the Co-packaged Optics Market?
The projected CAGR is approximately 47.12%.
2. Which companies are prominent players in the Co-packaged Optics Market?
Key companies in the market include Furukawa Electric Co Ltd, IBM Corporation, Kyocera Corporation, TE Connectivity, Cisco Systems Inc, Broadcom Inc, Microsoft Corporation, Ayar Labs Inc, Huawei Technologies Co Ltd, SENKO Advanced Components Inc, Hisense Broadband Multimedia Technology Co Ltd, Sumitomo Electric Industries Lt, Intel Corporation, POET Technologies.
3. What are the main segments of the Co-packaged Optics Market?
The market segments include Data Rates.
4. Can you provide details about the market size?
The market size is estimated to be USD 70.20 Million as of 2022.
5. What are some drivers contributing to market growth?
Increase in Adoption of Smart Devices and Rise in Data Traffic; Growth in the Importance of Mega Data Centers; Growth in High-performance Computing.
6. What are the notable trends driving market growth?
Growth in High-performance Computing.
7. Are there any restraints impacting market growth?
Increase in Network Complexity; Device Compatibility and Sustainability Issues.
8. Can you provide examples of recent developments in the market?
March 2024: Intel developed a 4 Tbps bidirectional fully integrated OCI chiplet based on Intel’s in-house silicon photonics technology. This chiplet, or tile, contains a single silicon photonics integrated circuit (PIC) with integrated lasers, an electrical IC (EIC), and a path to incorporate a detachable/re-usable optical connector. The purpose of this development is to address the AI infrastructure’s significant need for bandwidth and to enable future scalability.
9. What pricing options are available for accessing the report?
Pricing options include single-user, multi-user, and enterprise licenses priced at USD 4750, USD 5250, and USD 8750 respectively.
10. Is the market size provided in terms of value or volume?
The market size is provided in terms of value, measured in Million and volume, measured in K Unit.
11. Are there any specific market keywords associated with the report?
Yes, the market keyword associated with the report is "Co-packaged Optics Market," which aids in identifying and referencing the specific market segment covered.
12. How do I determine which pricing option suits my needs best?
The pricing options vary based on user requirements and access needs. Individual users may opt for single-user licenses, while businesses requiring broader access may choose multi-user or enterprise licenses for cost-effective access to the report.
13. Are there any additional resources or data provided in the Co-packaged Optics Market report?
While the report offers comprehensive insights, it's advisable to review the specific contents or supplementary materials provided to ascertain if additional resources or data are available.
14. How can I stay updated on further developments or reports in the Co-packaged Optics Market?
To stay informed about further developments, trends, and reports in the Co-packaged Optics Market, consider subscribing to industry newsletters, following relevant companies and organizations, or regularly checking reputable industry news sources and publications.
Methodology
Step 1 - Identification of Relevant Samples Size from Population Database


Step 2 - Approaches for Defining Global Market Size (Value, Volume* & Price*)

Note*: In applicable scenarios
Step 3 - Data Sources
Primary Research
- Web Analytics
- Survey Reports
- Research Institute
- Latest Research Reports
- Opinion Leaders
Secondary Research
- Annual Reports
- White Paper
- Latest Press Release
- Industry Association
- Paid Database
- Investor Presentations

Step 4 - Data Triangulation
Involves using different sources of information in order to increase the validity of a study
These sources are likely to be stakeholders in a program - participants, other researchers, program staff, other community members, and so on.
Then we put all data in single framework & apply various statistical tools to find out the dynamic on the market.
During the analysis stage, feedback from the stakeholder groups would be compared to determine areas of agreement as well as areas of divergence


