
Key Insights
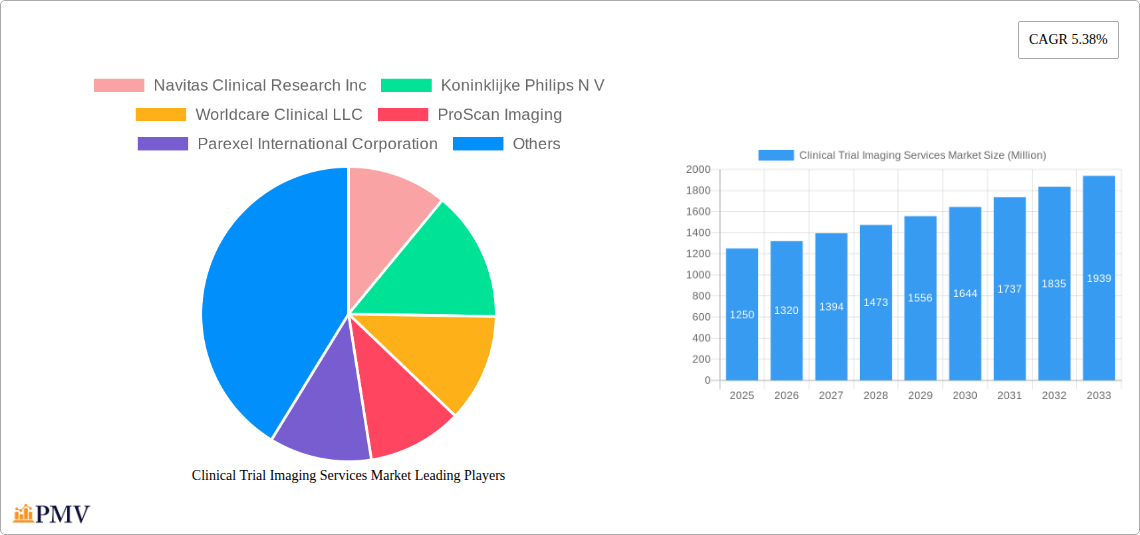
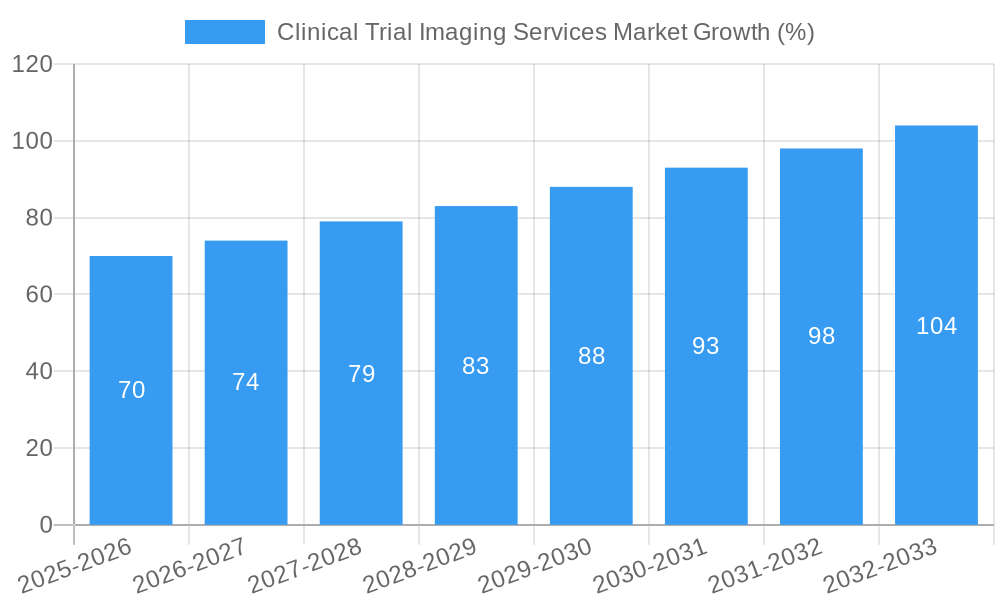
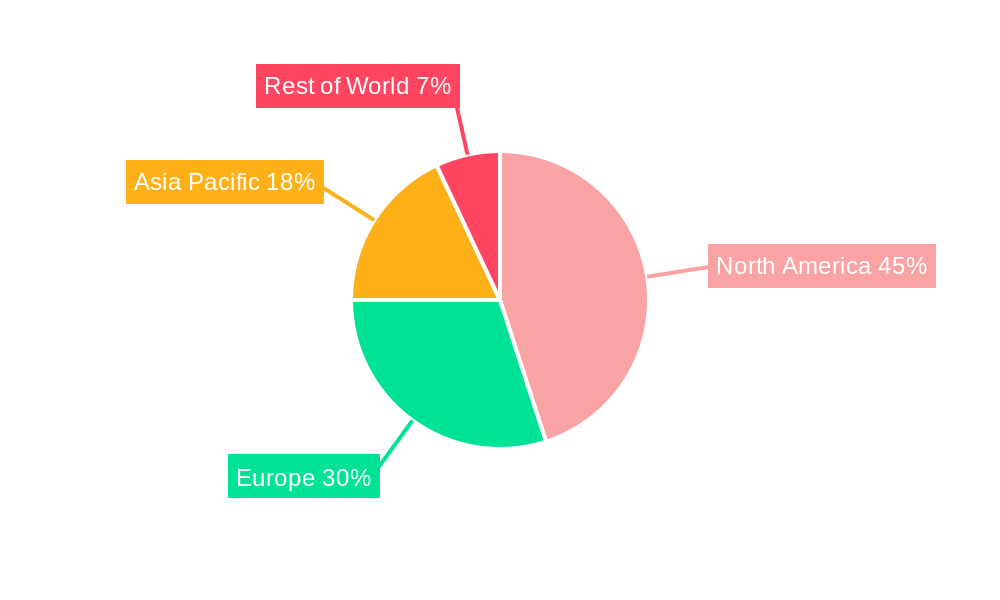
The Clinical Trial Imaging Services market, valued at $1.25 billion in 2025, is projected to experience robust growth, driven by the increasing prevalence of chronic diseases necessitating extensive clinical trials, the rising adoption of advanced imaging technologies like MRI and PET scans for precise diagnosis and monitoring, and the growing demand for efficient trial design and operational imaging services. The market's Compound Annual Growth Rate (CAGR) of 5.38% from 2025 to 2033 signifies a consistent expansion, fueled by technological advancements improving image quality and analysis, leading to faster and more accurate trial outcomes. Pharmaceutical and biotechnology companies are major drivers, increasingly integrating imaging into their trials to accelerate drug development and improve patient outcomes. The segment encompassing Magnetic Resonance Imaging (MRI) and Computed Tomography (CT) scans is expected to dominate due to their widespread use and versatility in various clinical trial applications. However, high costs associated with advanced imaging technologies and the need for skilled professionals to interpret images present potential market restraints. Geographic expansion is expected, with North America maintaining a significant market share due to its advanced healthcare infrastructure and high research funding, followed by Europe and Asia Pacific. The increasing adoption of outsourcing services and the rising focus on data analytics within clinical trials will further propel market growth.
The competitive landscape is characterized by a mix of large multinational companies and specialized service providers. Key players like Philips, Parexel, and Icon PLC are leveraging their expertise and global reach to secure significant market share. Smaller companies are focusing on niche areas like specialized imaging modalities or advanced analytical services to carve out their position. Strategic partnerships and acquisitions are expected to shape the market landscape, driven by the need for comprehensive service offerings and efficient trial management. The growing integration of artificial intelligence (AI) in image analysis is poised to transform the industry, accelerating data processing and interpretation, and leading to further market expansion. Regulatory changes and stringent guidelines related to data privacy and image security will need to be navigated effectively by market participants. Overall, the market shows a strong trajectory toward growth, fueled by innovation and a continuous demand for efficient and accurate clinical trial imaging services.
Clinical Trial Imaging Services Market: A Comprehensive Report (2019-2033)
This in-depth report provides a comprehensive analysis of the Clinical Trial Imaging Services market, offering valuable insights for stakeholders across the pharmaceutical, biotechnology, and medical device industries. The study period covers 2019-2033, with a base year of 2025 and a forecast period of 2025-2033. The report segments the market by product and service, modality, and end-user, providing a granular understanding of market dynamics and growth potential. The market is projected to reach xx Million by 2033, exhibiting a CAGR of xx% during the forecast period.
Clinical Trial Imaging Services Market Market Structure & Competitive Dynamics
The Clinical Trial Imaging Services market is characterized by a moderately concentrated landscape, with key players such as Koninklijke Philips N V, Parexel International Corporation, Icon PLC, and Medpace holding significant market share. Market concentration is influenced by factors including technological advancements, regulatory approvals, and strategic mergers and acquisitions (M&A). The xx Million M&A deal value in the past five years demonstrates significant consolidation within the sector. Innovation ecosystems are crucial, driving the development of advanced imaging technologies and analytical tools. Regulatory frameworks, particularly those governing clinical trials, significantly impact market growth and operations. The availability of substitute technologies, like advanced diagnostic tests, presents competitive pressure, influencing pricing and adoption rates. End-user trends, such as the increasing adoption of personalized medicine, drive demand for specialized imaging services.
- Market Concentration: Moderately concentrated, with top 5 players accounting for approximately xx% of the market share in 2024.
- M&A Activity: Significant M&A activity observed in recent years, with a total deal value exceeding xx Million. Deals focus on expanding service offerings and geographic reach.
- Regulatory Landscape: Stringent regulatory requirements for clinical trial imaging data influence market growth and operational practices.
- Technological Disruptions: Continuous advancements in imaging technologies and data analytics are driving market innovation and competition.
- End-User Trends: Increasing demand for personalized medicine and advanced clinical trial designs is a major growth driver.
Clinical Trial Imaging Services Market Industry Trends & Insights
The Clinical Trial Imaging Services market is experiencing robust growth, driven by several key factors. The rising prevalence of chronic diseases globally fuels the need for advanced diagnostic tools and clinical trials, thereby stimulating demand for specialized imaging services. Technological advancements, such as the integration of artificial intelligence (AI) and machine learning (ML) in image analysis, are revolutionizing the industry, improving efficiency and accuracy. The increasing adoption of decentralized clinical trials (DCTs) is also impacting market dynamics, requiring flexible and adaptable imaging solutions. This adoption has increased the penetration of imaging services in remote areas, contributing to the market’s growth. This growth, however, also brings challenges such as data security, integration of digital systems and patient privacy. Consumer preferences are shifting towards non-invasive imaging modalities and faster turnaround times, influencing the demand for particular services. Competitive dynamics are shaped by technological innovation, strategic partnerships, and the emergence of new market entrants. The market is projected to grow at a CAGR of xx% between 2025 and 2033, reaching an estimated value of xx Million by 2033.
Dominant Markets & Segments in Clinical Trial Imaging Services Market
Leading Region: North America is currently the dominant region, driven by high healthcare expenditure, advanced infrastructure, and a large concentration of pharmaceutical and biotechnology companies. Europe follows as a strong regional market.
Leading Modality: Magnetic Resonance Imaging (MRI) currently holds the largest market share due to its superior soft tissue contrast and versatility in various clinical applications. Computed Tomography (CT) remains significant, especially for applications requiring high spatial resolution.
Leading Product/Service: Operational Imaging Services represents the largest segment, driven by the outsourcing of imaging needs by pharmaceutical and biotechnology companies and CROs. The demand for Read Analysis Services is growing, fueled by the need for accurate and timely image interpretation.
Leading End-User: Pharmaceutical & Biotechnology Companies constitute the largest end-user segment, driving significant market demand due to the extensive use of imaging in drug development and clinical trials.
Key Drivers for Dominant Segments:
- North America: Strong regulatory framework supporting clinical trials, significant investment in healthcare infrastructure, and presence of major pharmaceutical companies.
- MRI: High image quality, versatility in applications, and continuous technological improvements.
- Operational Imaging Services: Cost-effectiveness, operational efficiency, and access to specialized expertise.
- Pharmaceutical & Biotechnology Companies: High investment in R&D and clinical trials, demand for high-quality imaging data for drug development.
Clinical Trial Imaging Services Market Product Innovations
Recent innovations include AI-powered image analysis tools that automate tasks, improving efficiency and accuracy of image interpretation. The development of portable and mobile imaging systems has enhanced accessibility, particularly in decentralized clinical trials. New modalities are being developed as well, alongside improved contrast agents that offer higher sensitivity and specificity. These innovations improve the overall quality of data obtained for clinical trials. The successful integration of these innovations is driving market growth and influencing competitive landscapes.
Report Segmentation & Scope
The report segments the Clinical Trial Imaging Services market across several key aspects:
Product & Service: Trial Design Consulting Services, Read Analysis Services, Operational Imaging Services, Imaging Software. Each segment exhibits varying growth rates and competitive dynamics, shaped by technological advancements and end-user preferences. The Operational Imaging Services segment is projected to witness the highest growth during the forecast period.
Modality: Magnetic Resonance Imaging (MRI), Computed Tomography (CT), Ultrasound, Positron Emission Tomography (PET), X-Ray, Echocardiography, Other Modalities. The MRI and CT modalities dominate the market due to their wide applicability in clinical trials. However, the adoption of other modalities like PET and Ultrasound is growing steadily.
End-User: Pharmaceutical & Biotechnology Companies, Medical Device Manufacturers, Academic and Government Research Institutes. Pharmaceutical and Biotechnology companies drive the majority of market demand, followed by Academic and Government Research Institutes.
Key Drivers of Clinical Trial Imaging Services Market Growth
Several factors drive market growth: the increasing prevalence of chronic diseases leading to a rise in clinical trials; technological advancements, including AI-powered image analysis and portable imaging systems; the growing adoption of decentralized clinical trials; and the rising demand for personalized medicine and targeted therapies which rely on precision imaging. Increased regulatory scrutiny to ensure high quality data is another major driver.
Challenges in the Clinical Trial Imaging Services Market Sector
Challenges include the high cost of advanced imaging technologies, stringent regulatory requirements impacting operational efficiency, the need for skilled professionals to operate and interpret images, the integration of data from various sources, and competitive pressures from emerging market entrants. Data security and patient privacy concerns also pose significant challenges. The global supply chain instability, experienced after the COVID-19 pandemic, impacted procurement of certain imaging devices, leading to temporary delays in clinical trials.
Leading Players in the Clinical Trial Imaging Services Market Market
- Navitas Clinical Research Inc
- Koninklijke Philips N V
- Worldcare Clinical LLC
- ProScan Imaging
- Parexel International Corporation
- Radiant Sage LLC
- WIRB-Copernicus Group
- Ixico PLC
- Clario
- Resonance Health
- Medpace
- Icon PLC
Key Developments in Clinical Trial Imaging Services Market Sector
- May 2022: Bruker launched innovative 7 Tesla and 9.4 Tesla conduction-cooled Maxwell magnets for its preclinical MRI systems, enhancing preclinical research capabilities.
- March 2022: Fujifilm India unveiled a new range of CT, MRI, and ultrasound machines, expanding its market reach in India. This increased the availability of high-quality imaging equipment in the region.
These launches demonstrate a continued focus on technological advancements, aiming to improve image quality, reduce scan times, and broaden accessibility.
Strategic Clinical Trial Imaging Services Market Market Outlook
The Clinical Trial Imaging Services market is poised for continued growth, driven by ongoing technological advancements, increasing demand for personalized medicine, and the expanding global clinical trials landscape. Strategic opportunities lie in developing innovative AI-powered imaging solutions, expanding into emerging markets, and forging strategic partnerships to broaden service offerings. Focusing on enhancing data security and patient privacy will be crucial for continued market success. The growing adoption of DCTs opens new avenues for service providers to innovate and expand their geographic reach.
Clinical Trial Imaging Services Market Segmentation
-
1. Product and Service
- 1.1. Trial Design Consulting Services
- 1.2. Read Analysis Services
- 1.3. Operational Imaging Services
- 1.4. Imaging Software
-
2. Modality
- 2.1. Magnetic Resonance Imaging
- 2.2. Computed Tomography
- 2.3. Ultrasound
- 2.4. Positron Emission Tomography
- 2.5. X-Ray
- 2.6. Echocardiography
- 2.7. Other Modalities
-
3. End-User
- 3.1. Pharmaceutical & Biotechnology Companies
- 3.2. Medical Device Manufacturers
- 3.3. Academic and Government Research Institutes
Clinical Trial Imaging Services Market Segmentation By Geography
-
1. North America
- 1.1. United States
- 1.2. Canada
- 1.3. Mexico
-
2. Europe
- 2.1. Germany
- 2.2. United Kingdom
- 2.3. France
- 2.4. Italy
- 2.5. Spain
- 2.6. Rest of Europe
-
3. Asia Pacific
- 3.1. China
- 3.2. Japan
- 3.3. India
- 3.4. Australia
- 3.5. South Korea
- 3.6. Rest of Asia Pacific
-
4. Middle East and Africa
- 4.1. GCC
- 4.2. South Africa
- 4.3. Rest of Middle East and Africa
-
5. South America
- 5.1. Brazil
- 5.2. Argentina
- 5.3. Rest of South America
Clinical Trial Imaging Services Market REPORT HIGHLIGHTS
| Aspects | Details |
|---|---|
| Study Period | 2019-2033 |
| Base Year | 2024 |
| Estimated Year | 2025 |
| Forecast Period | 2025-2033 |
| Historical Period | 2019-2024 |
| Growth Rate | CAGR of 5.38% from 2019-2033 |
| Segmentation |
|
Table of Contents
- 1. Introduction
- 1.1. Research Scope
- 1.2. Market Segmentation
- 1.3. Research Methodology
- 1.4. Definitions and Assumptions
- 2. Executive Summary
- 2.1. Introduction
- 3. Market Dynamics
- 3.1. Introduction
- 3.2. Market Drivers
- 3.2.1. Increase in R&D Spending by the Pharmaceutical and Biotechnological Companies; Increasing Number of Contract Research Organization & Investment by Them
- 3.3. Market Restrains
- 3.3.1. High Implementation Barriers and Costs of Imaging Systems
- 3.4. Market Trends
- 3.4.1. Computed Tomography is Expected to Witness Rapid Growth Over the Forecast Period
- 4. Market Factor Analysis
- 4.1. Porters Five Forces
- 4.2. Supply/Value Chain
- 4.3. PESTEL analysis
- 4.4. Market Entropy
- 4.5. Patent/Trademark Analysis
- 5. Global Clinical Trial Imaging Services Market Analysis, Insights and Forecast, 2019-2031
- 5.1. Market Analysis, Insights and Forecast - by Product and Service
- 5.1.1. Trial Design Consulting Services
- 5.1.2. Read Analysis Services
- 5.1.3. Operational Imaging Services
- 5.1.4. Imaging Software
- 5.2. Market Analysis, Insights and Forecast - by Modality
- 5.2.1. Magnetic Resonance Imaging
- 5.2.2. Computed Tomography
- 5.2.3. Ultrasound
- 5.2.4. Positron Emission Tomography
- 5.2.5. X-Ray
- 5.2.6. Echocardiography
- 5.2.7. Other Modalities
- 5.3. Market Analysis, Insights and Forecast - by End-User
- 5.3.1. Pharmaceutical & Biotechnology Companies
- 5.3.2. Medical Device Manufacturers
- 5.3.3. Academic and Government Research Institutes
- 5.4. Market Analysis, Insights and Forecast - by Region
- 5.4.1. North America
- 5.4.2. Europe
- 5.4.3. Asia Pacific
- 5.4.4. Middle East and Africa
- 5.4.5. South America
- 5.1. Market Analysis, Insights and Forecast - by Product and Service
- 6. North America Clinical Trial Imaging Services Market Analysis, Insights and Forecast, 2019-2031
- 6.1. Market Analysis, Insights and Forecast - by Product and Service
- 6.1.1. Trial Design Consulting Services
- 6.1.2. Read Analysis Services
- 6.1.3. Operational Imaging Services
- 6.1.4. Imaging Software
- 6.2. Market Analysis, Insights and Forecast - by Modality
- 6.2.1. Magnetic Resonance Imaging
- 6.2.2. Computed Tomography
- 6.2.3. Ultrasound
- 6.2.4. Positron Emission Tomography
- 6.2.5. X-Ray
- 6.2.6. Echocardiography
- 6.2.7. Other Modalities
- 6.3. Market Analysis, Insights and Forecast - by End-User
- 6.3.1. Pharmaceutical & Biotechnology Companies
- 6.3.2. Medical Device Manufacturers
- 6.3.3. Academic and Government Research Institutes
- 6.1. Market Analysis, Insights and Forecast - by Product and Service
- 7. Europe Clinical Trial Imaging Services Market Analysis, Insights and Forecast, 2019-2031
- 7.1. Market Analysis, Insights and Forecast - by Product and Service
- 7.1.1. Trial Design Consulting Services
- 7.1.2. Read Analysis Services
- 7.1.3. Operational Imaging Services
- 7.1.4. Imaging Software
- 7.2. Market Analysis, Insights and Forecast - by Modality
- 7.2.1. Magnetic Resonance Imaging
- 7.2.2. Computed Tomography
- 7.2.3. Ultrasound
- 7.2.4. Positron Emission Tomography
- 7.2.5. X-Ray
- 7.2.6. Echocardiography
- 7.2.7. Other Modalities
- 7.3. Market Analysis, Insights and Forecast - by End-User
- 7.3.1. Pharmaceutical & Biotechnology Companies
- 7.3.2. Medical Device Manufacturers
- 7.3.3. Academic and Government Research Institutes
- 7.1. Market Analysis, Insights and Forecast - by Product and Service
- 8. Asia Pacific Clinical Trial Imaging Services Market Analysis, Insights and Forecast, 2019-2031
- 8.1. Market Analysis, Insights and Forecast - by Product and Service
- 8.1.1. Trial Design Consulting Services
- 8.1.2. Read Analysis Services
- 8.1.3. Operational Imaging Services
- 8.1.4. Imaging Software
- 8.2. Market Analysis, Insights and Forecast - by Modality
- 8.2.1. Magnetic Resonance Imaging
- 8.2.2. Computed Tomography
- 8.2.3. Ultrasound
- 8.2.4. Positron Emission Tomography
- 8.2.5. X-Ray
- 8.2.6. Echocardiography
- 8.2.7. Other Modalities
- 8.3. Market Analysis, Insights and Forecast - by End-User
- 8.3.1. Pharmaceutical & Biotechnology Companies
- 8.3.2. Medical Device Manufacturers
- 8.3.3. Academic and Government Research Institutes
- 8.1. Market Analysis, Insights and Forecast - by Product and Service
- 9. Middle East and Africa Clinical Trial Imaging Services Market Analysis, Insights and Forecast, 2019-2031
- 9.1. Market Analysis, Insights and Forecast - by Product and Service
- 9.1.1. Trial Design Consulting Services
- 9.1.2. Read Analysis Services
- 9.1.3. Operational Imaging Services
- 9.1.4. Imaging Software
- 9.2. Market Analysis, Insights and Forecast - by Modality
- 9.2.1. Magnetic Resonance Imaging
- 9.2.2. Computed Tomography
- 9.2.3. Ultrasound
- 9.2.4. Positron Emission Tomography
- 9.2.5. X-Ray
- 9.2.6. Echocardiography
- 9.2.7. Other Modalities
- 9.3. Market Analysis, Insights and Forecast - by End-User
- 9.3.1. Pharmaceutical & Biotechnology Companies
- 9.3.2. Medical Device Manufacturers
- 9.3.3. Academic and Government Research Institutes
- 9.1. Market Analysis, Insights and Forecast - by Product and Service
- 10. South America Clinical Trial Imaging Services Market Analysis, Insights and Forecast, 2019-2031
- 10.1. Market Analysis, Insights and Forecast - by Product and Service
- 10.1.1. Trial Design Consulting Services
- 10.1.2. Read Analysis Services
- 10.1.3. Operational Imaging Services
- 10.1.4. Imaging Software
- 10.2. Market Analysis, Insights and Forecast - by Modality
- 10.2.1. Magnetic Resonance Imaging
- 10.2.2. Computed Tomography
- 10.2.3. Ultrasound
- 10.2.4. Positron Emission Tomography
- 10.2.5. X-Ray
- 10.2.6. Echocardiography
- 10.2.7. Other Modalities
- 10.3. Market Analysis, Insights and Forecast - by End-User
- 10.3.1. Pharmaceutical & Biotechnology Companies
- 10.3.2. Medical Device Manufacturers
- 10.3.3. Academic and Government Research Institutes
- 10.1. Market Analysis, Insights and Forecast - by Product and Service
- 11. North America Clinical Trial Imaging Services Market Analysis, Insights and Forecast, 2019-2031
- 11.1. Market Analysis, Insights and Forecast - By Country/Sub-region
- 11.1.1 United States
- 11.1.2 Canada
- 11.1.3 Mexico
- 12. Europe Clinical Trial Imaging Services Market Analysis, Insights and Forecast, 2019-2031
- 12.1. Market Analysis, Insights and Forecast - By Country/Sub-region
- 12.1.1 Germany
- 12.1.2 United Kingdom
- 12.1.3 France
- 12.1.4 Italy
- 12.1.5 Spain
- 12.1.6 Rest of Europe
- 13. Asia Pacific Clinical Trial Imaging Services Market Analysis, Insights and Forecast, 2019-2031
- 13.1. Market Analysis, Insights and Forecast - By Country/Sub-region
- 13.1.1 China
- 13.1.2 Japan
- 13.1.3 India
- 13.1.4 Australia
- 13.1.5 South Korea
- 13.1.6 Rest of Asia Pacific
- 14. Middle East and Africa Clinical Trial Imaging Services Market Analysis, Insights and Forecast, 2019-2031
- 14.1. Market Analysis, Insights and Forecast - By Country/Sub-region
- 14.1.1 GCC
- 14.1.2 South Africa
- 14.1.3 Rest of Middle East and Africa
- 15. South America Clinical Trial Imaging Services Market Analysis, Insights and Forecast, 2019-2031
- 15.1. Market Analysis, Insights and Forecast - By Country/Sub-region
- 15.1.1 Brazil
- 15.1.2 Argentina
- 15.1.3 Rest of South America
- 16. Competitive Analysis
- 16.1. Global Market Share Analysis 2024
- 16.2. Company Profiles
- 16.2.1 Navitas Clinical Research Inc
- 16.2.1.1. Overview
- 16.2.1.2. Products
- 16.2.1.3. SWOT Analysis
- 16.2.1.4. Recent Developments
- 16.2.1.5. Financials (Based on Availability)
- 16.2.2 Koninklijke Philips N V
- 16.2.2.1. Overview
- 16.2.2.2. Products
- 16.2.2.3. SWOT Analysis
- 16.2.2.4. Recent Developments
- 16.2.2.5. Financials (Based on Availability)
- 16.2.3 Worldcare Clinical LLC
- 16.2.3.1. Overview
- 16.2.3.2. Products
- 16.2.3.3. SWOT Analysis
- 16.2.3.4. Recent Developments
- 16.2.3.5. Financials (Based on Availability)
- 16.2.4 ProScan Imaging
- 16.2.4.1. Overview
- 16.2.4.2. Products
- 16.2.4.3. SWOT Analysis
- 16.2.4.4. Recent Developments
- 16.2.4.5. Financials (Based on Availability)
- 16.2.5 Parexel International Corporation
- 16.2.5.1. Overview
- 16.2.5.2. Products
- 16.2.5.3. SWOT Analysis
- 16.2.5.4. Recent Developments
- 16.2.5.5. Financials (Based on Availability)
- 16.2.6 Radiant Sage LLC
- 16.2.6.1. Overview
- 16.2.6.2. Products
- 16.2.6.3. SWOT Analysis
- 16.2.6.4. Recent Developments
- 16.2.6.5. Financials (Based on Availability)
- 16.2.7 WIRB-Copernicus Group
- 16.2.7.1. Overview
- 16.2.7.2. Products
- 16.2.7.3. SWOT Analysis
- 16.2.7.4. Recent Developments
- 16.2.7.5. Financials (Based on Availability)
- 16.2.8 Ixico PLC
- 16.2.8.1. Overview
- 16.2.8.2. Products
- 16.2.8.3. SWOT Analysis
- 16.2.8.4. Recent Developments
- 16.2.8.5. Financials (Based on Availability)
- 16.2.9 Clario
- 16.2.9.1. Overview
- 16.2.9.2. Products
- 16.2.9.3. SWOT Analysis
- 16.2.9.4. Recent Developments
- 16.2.9.5. Financials (Based on Availability)
- 16.2.10 Resonance Health
- 16.2.10.1. Overview
- 16.2.10.2. Products
- 16.2.10.3. SWOT Analysis
- 16.2.10.4. Recent Developments
- 16.2.10.5. Financials (Based on Availability)
- 16.2.11 Medpace
- 16.2.11.1. Overview
- 16.2.11.2. Products
- 16.2.11.3. SWOT Analysis
- 16.2.11.4. Recent Developments
- 16.2.11.5. Financials (Based on Availability)
- 16.2.12 Icon PLC
- 16.2.12.1. Overview
- 16.2.12.2. Products
- 16.2.12.3. SWOT Analysis
- 16.2.12.4. Recent Developments
- 16.2.12.5. Financials (Based on Availability)
- 16.2.1 Navitas Clinical Research Inc
List of Figures
- Figure 1: Global Clinical Trial Imaging Services Market Revenue Breakdown (Million, %) by Region 2024 & 2032
- Figure 2: North America Clinical Trial Imaging Services Market Revenue (Million), by Country 2024 & 2032
- Figure 3: North America Clinical Trial Imaging Services Market Revenue Share (%), by Country 2024 & 2032
- Figure 4: Europe Clinical Trial Imaging Services Market Revenue (Million), by Country 2024 & 2032
- Figure 5: Europe Clinical Trial Imaging Services Market Revenue Share (%), by Country 2024 & 2032
- Figure 6: Asia Pacific Clinical Trial Imaging Services Market Revenue (Million), by Country 2024 & 2032
- Figure 7: Asia Pacific Clinical Trial Imaging Services Market Revenue Share (%), by Country 2024 & 2032
- Figure 8: Middle East and Africa Clinical Trial Imaging Services Market Revenue (Million), by Country 2024 & 2032
- Figure 9: Middle East and Africa Clinical Trial Imaging Services Market Revenue Share (%), by Country 2024 & 2032
- Figure 10: South America Clinical Trial Imaging Services Market Revenue (Million), by Country 2024 & 2032
- Figure 11: South America Clinical Trial Imaging Services Market Revenue Share (%), by Country 2024 & 2032
- Figure 12: North America Clinical Trial Imaging Services Market Revenue (Million), by Product and Service 2024 & 2032
- Figure 13: North America Clinical Trial Imaging Services Market Revenue Share (%), by Product and Service 2024 & 2032
- Figure 14: North America Clinical Trial Imaging Services Market Revenue (Million), by Modality 2024 & 2032
- Figure 15: North America Clinical Trial Imaging Services Market Revenue Share (%), by Modality 2024 & 2032
- Figure 16: North America Clinical Trial Imaging Services Market Revenue (Million), by End-User 2024 & 2032
- Figure 17: North America Clinical Trial Imaging Services Market Revenue Share (%), by End-User 2024 & 2032
- Figure 18: North America Clinical Trial Imaging Services Market Revenue (Million), by Country 2024 & 2032
- Figure 19: North America Clinical Trial Imaging Services Market Revenue Share (%), by Country 2024 & 2032
- Figure 20: Europe Clinical Trial Imaging Services Market Revenue (Million), by Product and Service 2024 & 2032
- Figure 21: Europe Clinical Trial Imaging Services Market Revenue Share (%), by Product and Service 2024 & 2032
- Figure 22: Europe Clinical Trial Imaging Services Market Revenue (Million), by Modality 2024 & 2032
- Figure 23: Europe Clinical Trial Imaging Services Market Revenue Share (%), by Modality 2024 & 2032
- Figure 24: Europe Clinical Trial Imaging Services Market Revenue (Million), by End-User 2024 & 2032
- Figure 25: Europe Clinical Trial Imaging Services Market Revenue Share (%), by End-User 2024 & 2032
- Figure 26: Europe Clinical Trial Imaging Services Market Revenue (Million), by Country 2024 & 2032
- Figure 27: Europe Clinical Trial Imaging Services Market Revenue Share (%), by Country 2024 & 2032
- Figure 28: Asia Pacific Clinical Trial Imaging Services Market Revenue (Million), by Product and Service 2024 & 2032
- Figure 29: Asia Pacific Clinical Trial Imaging Services Market Revenue Share (%), by Product and Service 2024 & 2032
- Figure 30: Asia Pacific Clinical Trial Imaging Services Market Revenue (Million), by Modality 2024 & 2032
- Figure 31: Asia Pacific Clinical Trial Imaging Services Market Revenue Share (%), by Modality 2024 & 2032
- Figure 32: Asia Pacific Clinical Trial Imaging Services Market Revenue (Million), by End-User 2024 & 2032
- Figure 33: Asia Pacific Clinical Trial Imaging Services Market Revenue Share (%), by End-User 2024 & 2032
- Figure 34: Asia Pacific Clinical Trial Imaging Services Market Revenue (Million), by Country 2024 & 2032
- Figure 35: Asia Pacific Clinical Trial Imaging Services Market Revenue Share (%), by Country 2024 & 2032
- Figure 36: Middle East and Africa Clinical Trial Imaging Services Market Revenue (Million), by Product and Service 2024 & 2032
- Figure 37: Middle East and Africa Clinical Trial Imaging Services Market Revenue Share (%), by Product and Service 2024 & 2032
- Figure 38: Middle East and Africa Clinical Trial Imaging Services Market Revenue (Million), by Modality 2024 & 2032
- Figure 39: Middle East and Africa Clinical Trial Imaging Services Market Revenue Share (%), by Modality 2024 & 2032
- Figure 40: Middle East and Africa Clinical Trial Imaging Services Market Revenue (Million), by End-User 2024 & 2032
- Figure 41: Middle East and Africa Clinical Trial Imaging Services Market Revenue Share (%), by End-User 2024 & 2032
- Figure 42: Middle East and Africa Clinical Trial Imaging Services Market Revenue (Million), by Country 2024 & 2032
- Figure 43: Middle East and Africa Clinical Trial Imaging Services Market Revenue Share (%), by Country 2024 & 2032
- Figure 44: South America Clinical Trial Imaging Services Market Revenue (Million), by Product and Service 2024 & 2032
- Figure 45: South America Clinical Trial Imaging Services Market Revenue Share (%), by Product and Service 2024 & 2032
- Figure 46: South America Clinical Trial Imaging Services Market Revenue (Million), by Modality 2024 & 2032
- Figure 47: South America Clinical Trial Imaging Services Market Revenue Share (%), by Modality 2024 & 2032
- Figure 48: South America Clinical Trial Imaging Services Market Revenue (Million), by End-User 2024 & 2032
- Figure 49: South America Clinical Trial Imaging Services Market Revenue Share (%), by End-User 2024 & 2032
- Figure 50: South America Clinical Trial Imaging Services Market Revenue (Million), by Country 2024 & 2032
- Figure 51: South America Clinical Trial Imaging Services Market Revenue Share (%), by Country 2024 & 2032
List of Tables
- Table 1: Global Clinical Trial Imaging Services Market Revenue Million Forecast, by Region 2019 & 2032
- Table 2: Global Clinical Trial Imaging Services Market Revenue Million Forecast, by Product and Service 2019 & 2032
- Table 3: Global Clinical Trial Imaging Services Market Revenue Million Forecast, by Modality 2019 & 2032
- Table 4: Global Clinical Trial Imaging Services Market Revenue Million Forecast, by End-User 2019 & 2032
- Table 5: Global Clinical Trial Imaging Services Market Revenue Million Forecast, by Region 2019 & 2032
- Table 6: Global Clinical Trial Imaging Services Market Revenue Million Forecast, by Country 2019 & 2032
- Table 7: United States Clinical Trial Imaging Services Market Revenue (Million) Forecast, by Application 2019 & 2032
- Table 8: Canada Clinical Trial Imaging Services Market Revenue (Million) Forecast, by Application 2019 & 2032
- Table 9: Mexico Clinical Trial Imaging Services Market Revenue (Million) Forecast, by Application 2019 & 2032
- Table 10: Global Clinical Trial Imaging Services Market Revenue Million Forecast, by Country 2019 & 2032
- Table 11: Germany Clinical Trial Imaging Services Market Revenue (Million) Forecast, by Application 2019 & 2032
- Table 12: United Kingdom Clinical Trial Imaging Services Market Revenue (Million) Forecast, by Application 2019 & 2032
- Table 13: France Clinical Trial Imaging Services Market Revenue (Million) Forecast, by Application 2019 & 2032
- Table 14: Italy Clinical Trial Imaging Services Market Revenue (Million) Forecast, by Application 2019 & 2032
- Table 15: Spain Clinical Trial Imaging Services Market Revenue (Million) Forecast, by Application 2019 & 2032
- Table 16: Rest of Europe Clinical Trial Imaging Services Market Revenue (Million) Forecast, by Application 2019 & 2032
- Table 17: Global Clinical Trial Imaging Services Market Revenue Million Forecast, by Country 2019 & 2032
- Table 18: China Clinical Trial Imaging Services Market Revenue (Million) Forecast, by Application 2019 & 2032
- Table 19: Japan Clinical Trial Imaging Services Market Revenue (Million) Forecast, by Application 2019 & 2032
- Table 20: India Clinical Trial Imaging Services Market Revenue (Million) Forecast, by Application 2019 & 2032
- Table 21: Australia Clinical Trial Imaging Services Market Revenue (Million) Forecast, by Application 2019 & 2032
- Table 22: South Korea Clinical Trial Imaging Services Market Revenue (Million) Forecast, by Application 2019 & 2032
- Table 23: Rest of Asia Pacific Clinical Trial Imaging Services Market Revenue (Million) Forecast, by Application 2019 & 2032
- Table 24: Global Clinical Trial Imaging Services Market Revenue Million Forecast, by Country 2019 & 2032
- Table 25: GCC Clinical Trial Imaging Services Market Revenue (Million) Forecast, by Application 2019 & 2032
- Table 26: South Africa Clinical Trial Imaging Services Market Revenue (Million) Forecast, by Application 2019 & 2032
- Table 27: Rest of Middle East and Africa Clinical Trial Imaging Services Market Revenue (Million) Forecast, by Application 2019 & 2032
- Table 28: Global Clinical Trial Imaging Services Market Revenue Million Forecast, by Country 2019 & 2032
- Table 29: Brazil Clinical Trial Imaging Services Market Revenue (Million) Forecast, by Application 2019 & 2032
- Table 30: Argentina Clinical Trial Imaging Services Market Revenue (Million) Forecast, by Application 2019 & 2032
- Table 31: Rest of South America Clinical Trial Imaging Services Market Revenue (Million) Forecast, by Application 2019 & 2032
- Table 32: Global Clinical Trial Imaging Services Market Revenue Million Forecast, by Product and Service 2019 & 2032
- Table 33: Global Clinical Trial Imaging Services Market Revenue Million Forecast, by Modality 2019 & 2032
- Table 34: Global Clinical Trial Imaging Services Market Revenue Million Forecast, by End-User 2019 & 2032
- Table 35: Global Clinical Trial Imaging Services Market Revenue Million Forecast, by Country 2019 & 2032
- Table 36: United States Clinical Trial Imaging Services Market Revenue (Million) Forecast, by Application 2019 & 2032
- Table 37: Canada Clinical Trial Imaging Services Market Revenue (Million) Forecast, by Application 2019 & 2032
- Table 38: Mexico Clinical Trial Imaging Services Market Revenue (Million) Forecast, by Application 2019 & 2032
- Table 39: Global Clinical Trial Imaging Services Market Revenue Million Forecast, by Product and Service 2019 & 2032
- Table 40: Global Clinical Trial Imaging Services Market Revenue Million Forecast, by Modality 2019 & 2032
- Table 41: Global Clinical Trial Imaging Services Market Revenue Million Forecast, by End-User 2019 & 2032
- Table 42: Global Clinical Trial Imaging Services Market Revenue Million Forecast, by Country 2019 & 2032
- Table 43: Germany Clinical Trial Imaging Services Market Revenue (Million) Forecast, by Application 2019 & 2032
- Table 44: United Kingdom Clinical Trial Imaging Services Market Revenue (Million) Forecast, by Application 2019 & 2032
- Table 45: France Clinical Trial Imaging Services Market Revenue (Million) Forecast, by Application 2019 & 2032
- Table 46: Italy Clinical Trial Imaging Services Market Revenue (Million) Forecast, by Application 2019 & 2032
- Table 47: Spain Clinical Trial Imaging Services Market Revenue (Million) Forecast, by Application 2019 & 2032
- Table 48: Rest of Europe Clinical Trial Imaging Services Market Revenue (Million) Forecast, by Application 2019 & 2032
- Table 49: Global Clinical Trial Imaging Services Market Revenue Million Forecast, by Product and Service 2019 & 2032
- Table 50: Global Clinical Trial Imaging Services Market Revenue Million Forecast, by Modality 2019 & 2032
- Table 51: Global Clinical Trial Imaging Services Market Revenue Million Forecast, by End-User 2019 & 2032
- Table 52: Global Clinical Trial Imaging Services Market Revenue Million Forecast, by Country 2019 & 2032
- Table 53: China Clinical Trial Imaging Services Market Revenue (Million) Forecast, by Application 2019 & 2032
- Table 54: Japan Clinical Trial Imaging Services Market Revenue (Million) Forecast, by Application 2019 & 2032
- Table 55: India Clinical Trial Imaging Services Market Revenue (Million) Forecast, by Application 2019 & 2032
- Table 56: Australia Clinical Trial Imaging Services Market Revenue (Million) Forecast, by Application 2019 & 2032
- Table 57: South Korea Clinical Trial Imaging Services Market Revenue (Million) Forecast, by Application 2019 & 2032
- Table 58: Rest of Asia Pacific Clinical Trial Imaging Services Market Revenue (Million) Forecast, by Application 2019 & 2032
- Table 59: Global Clinical Trial Imaging Services Market Revenue Million Forecast, by Product and Service 2019 & 2032
- Table 60: Global Clinical Trial Imaging Services Market Revenue Million Forecast, by Modality 2019 & 2032
- Table 61: Global Clinical Trial Imaging Services Market Revenue Million Forecast, by End-User 2019 & 2032
- Table 62: Global Clinical Trial Imaging Services Market Revenue Million Forecast, by Country 2019 & 2032
- Table 63: GCC Clinical Trial Imaging Services Market Revenue (Million) Forecast, by Application 2019 & 2032
- Table 64: South Africa Clinical Trial Imaging Services Market Revenue (Million) Forecast, by Application 2019 & 2032
- Table 65: Rest of Middle East and Africa Clinical Trial Imaging Services Market Revenue (Million) Forecast, by Application 2019 & 2032
- Table 66: Global Clinical Trial Imaging Services Market Revenue Million Forecast, by Product and Service 2019 & 2032
- Table 67: Global Clinical Trial Imaging Services Market Revenue Million Forecast, by Modality 2019 & 2032
- Table 68: Global Clinical Trial Imaging Services Market Revenue Million Forecast, by End-User 2019 & 2032
- Table 69: Global Clinical Trial Imaging Services Market Revenue Million Forecast, by Country 2019 & 2032
- Table 70: Brazil Clinical Trial Imaging Services Market Revenue (Million) Forecast, by Application 2019 & 2032
- Table 71: Argentina Clinical Trial Imaging Services Market Revenue (Million) Forecast, by Application 2019 & 2032
- Table 72: Rest of South America Clinical Trial Imaging Services Market Revenue (Million) Forecast, by Application 2019 & 2032
Frequently Asked Questions
1. What is the projected Compound Annual Growth Rate (CAGR) of the Clinical Trial Imaging Services Market?
The projected CAGR is approximately 5.38%.
2. Which companies are prominent players in the Clinical Trial Imaging Services Market?
Key companies in the market include Navitas Clinical Research Inc, Koninklijke Philips N V, Worldcare Clinical LLC, ProScan Imaging, Parexel International Corporation, Radiant Sage LLC, WIRB-Copernicus Group, Ixico PLC, Clario, Resonance Health, Medpace, Icon PLC.
3. What are the main segments of the Clinical Trial Imaging Services Market?
The market segments include Product and Service, Modality, End-User.
4. Can you provide details about the market size?
The market size is estimated to be USD 1.25 Million as of 2022.
5. What are some drivers contributing to market growth?
Increase in R&D Spending by the Pharmaceutical and Biotechnological Companies; Increasing Number of Contract Research Organization & Investment by Them.
6. What are the notable trends driving market growth?
Computed Tomography is Expected to Witness Rapid Growth Over the Forecast Period.
7. Are there any restraints impacting market growth?
High Implementation Barriers and Costs of Imaging Systems.
8. Can you provide examples of recent developments in the market?
In May 2022, at the International Society for Magnetic Resonance in Medicine (ISMRM) 2022 conference, Bruker launched innovative 7 Tesla and 9.4 Tesla conduction-cooled Maxwell magnets for its market-leading preclinical magnetic resonance imaging (MRI) systems portfolio.
9. What pricing options are available for accessing the report?
Pricing options include single-user, multi-user, and enterprise licenses priced at USD 4750, USD 5250, and USD 8750 respectively.
10. Is the market size provided in terms of value or volume?
The market size is provided in terms of value, measured in Million.
11. Are there any specific market keywords associated with the report?
Yes, the market keyword associated with the report is "Clinical Trial Imaging Services Market," which aids in identifying and referencing the specific market segment covered.
12. How do I determine which pricing option suits my needs best?
The pricing options vary based on user requirements and access needs. Individual users may opt for single-user licenses, while businesses requiring broader access may choose multi-user or enterprise licenses for cost-effective access to the report.
13. Are there any additional resources or data provided in the Clinical Trial Imaging Services Market report?
While the report offers comprehensive insights, it's advisable to review the specific contents or supplementary materials provided to ascertain if additional resources or data are available.
14. How can I stay updated on further developments or reports in the Clinical Trial Imaging Services Market?
To stay informed about further developments, trends, and reports in the Clinical Trial Imaging Services Market, consider subscribing to industry newsletters, following relevant companies and organizations, or regularly checking reputable industry news sources and publications.
Methodology
Step 1 - Identification of Relevant Samples Size from Population Database


Step 2 - Approaches for Defining Global Market Size (Value, Volume* & Price*)

Note*: In applicable scenarios
Step 3 - Data Sources
Primary Research
- Web Analytics
- Survey Reports
- Research Institute
- Latest Research Reports
- Opinion Leaders
Secondary Research
- Annual Reports
- White Paper
- Latest Press Release
- Industry Association
- Paid Database
- Investor Presentations

Step 4 - Data Triangulation
Involves using different sources of information in order to increase the validity of a study
These sources are likely to be stakeholders in a program - participants, other researchers, program staff, other community members, and so on.
Then we put all data in single framework & apply various statistical tools to find out the dynamic on the market.
During the analysis stage, feedback from the stakeholder groups would be compared to determine areas of agreement as well as areas of divergence


