
Key Insights
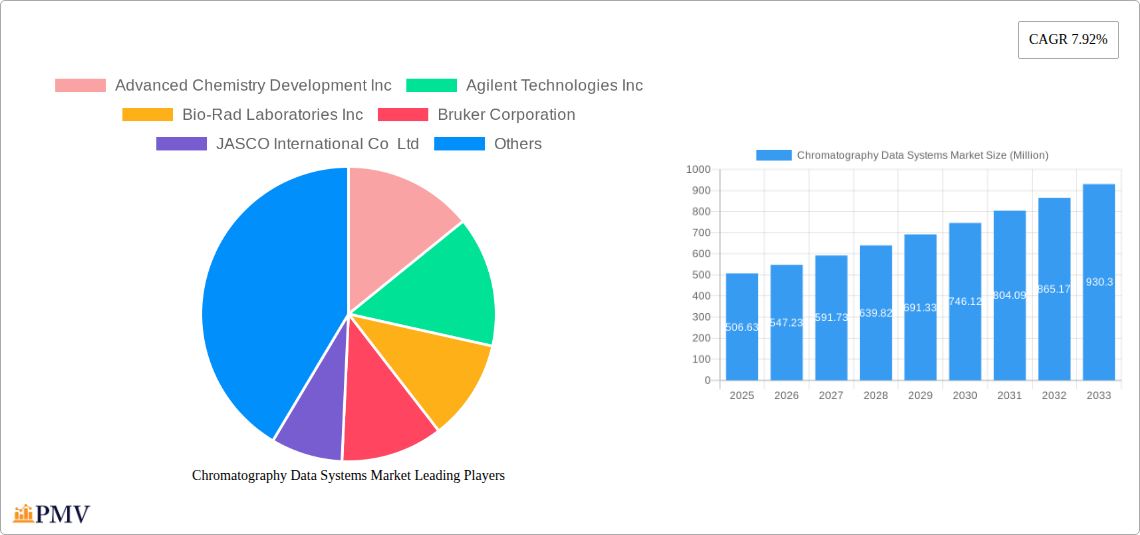
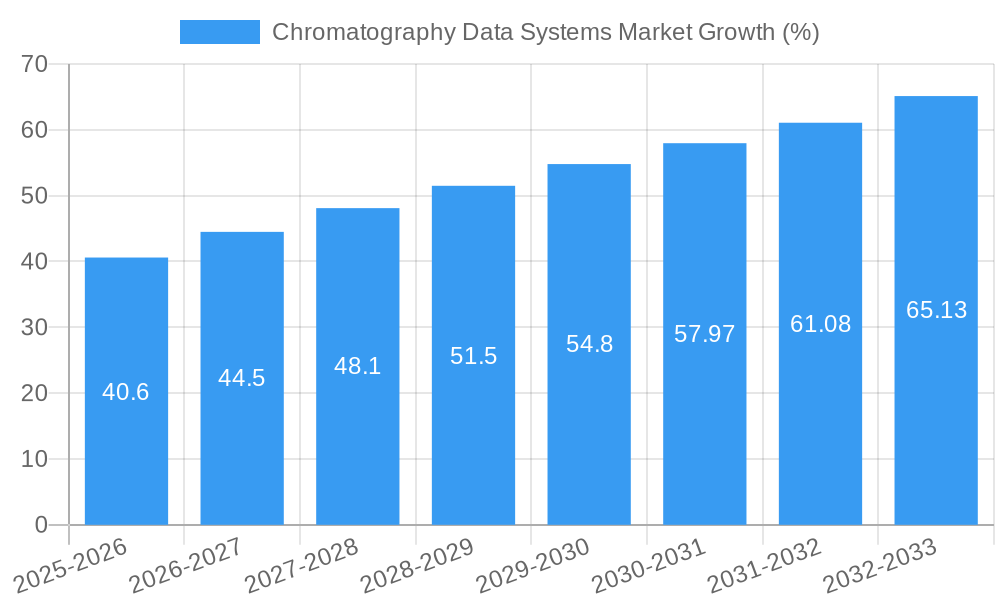
The Chromatography Data Systems (CDS) market, valued at $506.63 million in 2025, is projected to experience robust growth, driven by increasing demand for high-throughput screening in pharmaceutical and biopharmaceutical research, coupled with the rising adoption of advanced analytical techniques in various industries. The market's Compound Annual Growth Rate (CAGR) of 7.92% from 2019 to 2024 indicates a consistently expanding market. Key drivers include the need for improved data management and analysis capabilities, the growing complexity of chromatographic separations, and the increasing regulatory pressures for data integrity and traceability in regulated industries like pharmaceuticals. The integration of CDS with laboratory information management systems (LIMS) and other analytical software is also a significant trend fueling market expansion. However, the high initial investment costs associated with CDS implementation and the need for specialized training can act as restraints. The market is segmented by various factors such as instrument type (GC, HPLC, UHPLC), end-user industry (pharmaceutical, biotechnology, environmental monitoring), and software functionality. Major players like Thermo Fisher Scientific, Agilent Technologies, and Waters Corporation dominate the market through their comprehensive product portfolios and strong global presence. The forecast period of 2025-2033 anticipates continued growth, propelled by technological advancements such as AI-powered data analysis and the development of cloud-based CDS solutions.
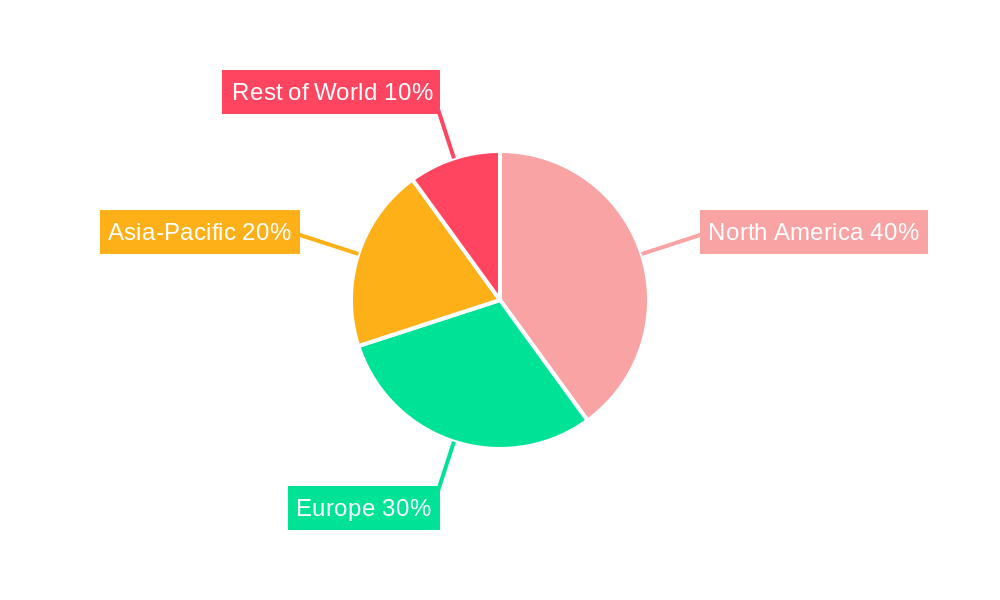
The competitive landscape is marked by intense innovation and strategic acquisitions. Companies are focusing on developing user-friendly interfaces, enhanced data visualization tools, and improved integration with other laboratory instruments to gain a competitive edge. The market shows significant regional variations, with North America and Europe currently holding substantial market share. However, emerging economies in Asia-Pacific and Latin America are expected to exhibit significant growth potential in the coming years, driven by increasing investments in research and development infrastructure and expanding pharmaceutical and biotechnology industries. This projected growth is largely attributed to improving healthcare infrastructure and a rising awareness of the importance of sophisticated analytical techniques in various sectors. The market's future outlook remains positive, with opportunities for growth in specialized applications and emerging technologies promising further expansion.
Chromatography Data Systems Market: A Comprehensive Report (2019-2033)
This in-depth report provides a comprehensive analysis of the Chromatography Data Systems (CDS) market, covering market structure, competitive dynamics, industry trends, and future growth prospects. The study period spans from 2019 to 2033, with 2025 as the base and estimated year. The report offers actionable insights for stakeholders across the CDS value chain, including manufacturers, vendors, and end-users. The market is projected to reach xx Million by 2033, exhibiting a CAGR of xx% during the forecast period (2025-2033).
Chromatography Data Systems Market Market Structure & Competitive Dynamics
The Chromatography Data Systems market exhibits a moderately consolidated structure, with several key players holding significant market share. The competitive landscape is characterized by intense innovation, strategic partnerships, and mergers & acquisitions (M&A) activity. Regulatory frameworks, particularly those related to data integrity and compliance (e.g., 21 CFR Part 11), significantly influence market dynamics. Product substitutes, such as manual data processing techniques, are gradually declining in prevalence due to the increasing demand for automation and data analysis capabilities. End-user trends, driven by the growing adoption of advanced analytical techniques in various industries, are shaping market growth.
- Market Concentration: The top five players account for approximately xx% of the global market share in 2025.
- Innovation Ecosystems: Significant investments in R&D are driving the development of sophisticated CDS solutions with enhanced functionalities, including AI-powered data analysis and cloud-based platforms.
- Regulatory Frameworks: Stringent regulatory compliance requirements (e.g., 21 CFR Part 11) necessitate the adoption of validated CDS solutions.
- Product Substitutes: Manual data processing methods are gradually being replaced by automated CDS solutions.
- End-User Trends: The increasing demand for high-throughput screening and advanced data analysis across various industries fuels market growth.
- M&A Activity: The market has witnessed several M&A activities in the past five years, valued at approximately xx Million, primarily focused on expanding product portfolios and geographic reach.
Chromatography Data Systems Market Industry Trends & Insights
The Chromatography Data Systems market is experiencing robust growth, driven by several factors. The rising adoption of advanced analytical techniques in pharmaceuticals, biotechnology, environmental monitoring, and food & beverage industries is a key growth driver. Technological advancements, particularly in the areas of data analytics, cloud computing, and AI, are transforming the CDS landscape. Consumer preferences are shifting towards integrated solutions that offer seamless data integration, enhanced data visualization, and improved user experience. The competitive dynamics are marked by continuous innovation, strategic partnerships, and the introduction of new functionalities. The market penetration of CDS in emerging economies is also contributing to market expansion.
The global Chromatography Data Systems market is projected to witness significant growth during the forecast period (2025-2033). The market is driven by several factors including increased demand from various industries, technological advancements, and regulatory compliance requirements. The rising adoption of advanced analytical techniques in research and development and quality control processes across various end-use sectors fuels the market's growth. The CAGR of the global market is expected to be xx% during the forecast period.
Dominant Markets & Segments in Chromatography Data Systems Market
North America currently holds the largest market share in the Chromatography Data Systems market, driven by the strong presence of major players, substantial research and development investments, and stringent regulatory compliance standards. The region's dominance is further solidified by a robust healthcare infrastructure and significant investments in the pharmaceutical and biotechnology sectors.
- Key Drivers of North American Dominance:
- Strong regulatory frameworks promoting data integrity and compliance.
- Significant investments in R&D within the pharmaceutical and biotechnology sectors.
- High adoption rates of advanced analytical techniques in various industries.
- Presence of major market players with advanced CDS solutions.
- Well-established healthcare infrastructure supporting advanced research.
The European market is also expected to experience significant growth, driven by increasing investments in research and development and the adoption of advanced analytical techniques. The Asia Pacific region is expected to show the highest growth rate, driven by increasing industrialization and the adoption of advanced technologies.
Chromatography Data Systems Market Product Innovations
Recent product innovations in the Chromatography Data Systems market focus on enhancing data processing speed and accuracy, improving data visualization capabilities, and integrating AI-powered analytics. New products offer advanced features like seamless data integration from multiple instruments, improved data security and compliance features, and streamlined workflows for enhanced productivity. The market is witnessing a surge in cloud-based CDS solutions, offering flexible access, scalability, and cost-effectiveness. These innovations cater to the growing demands of high-throughput screening and data-intensive analytical workflows across various industries.
Report Segmentation & Scope
This report segments the Chromatography Data Systems market based on several factors:
By Type: Gas Chromatography Data Systems (GC-CDS), High-Performance Liquid Chromatography Data Systems (HPLC-CDS), and others. The HPLC-CDS segment currently holds the largest market share due to its widespread use in pharmaceutical and biopharmaceutical applications. However, the GC-CDS segment is expected to exhibit robust growth due to rising demand in environmental monitoring and food safety testing.
By Application: Pharmaceutical & Biotechnology, Environmental Monitoring, Food & Beverage, Chemical & Materials, and others. The pharmaceutical & biotechnology segment accounts for the highest market share, driven by stringent quality control requirements and the need for reliable data analysis in drug development.
By Geography: North America, Europe, Asia Pacific, and the Rest of the World. North America commands the leading market share.
Key Drivers of Chromatography Data Systems Market Growth
The Chromatography Data Systems market growth is fueled by several factors: the rising demand for advanced analytical techniques in various industries, the growing need for efficient and reliable data analysis, stringent regulatory compliance requirements, and continuous technological advancements in data processing and analysis capabilities. The increasing adoption of cloud-based CDS solutions, coupled with the integration of artificial intelligence and machine learning algorithms, further enhances market growth.
Challenges in the Chromatography Data Systems Market Sector
The Chromatography Data Systems market faces challenges including high initial investment costs for advanced systems, the complexity of integrating various analytical instruments with CDS, and the need for specialized training to effectively utilize advanced CDS features. Furthermore, ensuring data security and compliance with stringent regulatory guidelines poses a significant challenge. Competitive pressures from emerging players also impact the market. These challenges are estimated to collectively reduce market growth by approximately xx% annually.
Leading Players in the Chromatography Data Systems Market Market
- Advanced Chemistry Development Inc
- Agilent Technologies Inc
- Bio-Rad Laboratories Inc
- Bruker Corporation
- JASCO International Co Ltd
- Justice Innovations Inc
- PerkinElmer Inc
- Shimadzu Corporation
- Thermo Fisher Scientific Inc
- Waters Corporation
Key Developments in Chromatography Data Systems Market Sector
- June 2022: PerkinElmer Inc. launched the GC 2400 Platform with the SimplicityChrom CDS, enhancing workflow efficiency and compliance.
- January 2023: Waters Corporation introduced waters_connect System Monitoring, improving real-time instrument monitoring via its Empower software.
- May 2023: Sciex Corporation launched the BioPhase 8800 driver, facilitating seamless integration with Waters' Empower CDS.
Strategic Chromatography Data Systems Market Market Outlook
The Chromatography Data Systems market is poised for continued growth, driven by increasing demand for advanced analytical capabilities across various industries. Strategic opportunities lie in developing innovative CDS solutions with AI-powered analytics, enhanced data visualization tools, and cloud-based platforms. Focusing on seamless integration with various analytical instruments and addressing regulatory compliance will be crucial for sustained market success. The market's future growth will be influenced by the ongoing evolution of analytical techniques and the increasing adoption of digital technologies in various sectors.
Chromatography Data Systems Market Segmentation
-
1. Type
- 1.1. Integrated
- 1.2. Standalone
-
2. Deployment
- 2.1. Cloud
- 2.2. On-Premise
-
3. Enterprise Size
- 3.1. Large Enterprises
- 3.2. Small & Medium Enterprises
-
4. End-User
- 4.1. Academic Institutes
- 4.2. Food & Beverage Industry
- 4.3. Pharmaceutical & Biopharmaceutical Industry
- 4.4. Others (
Chromatography Data Systems Market Segmentation By Geography
-
1. North America
- 1.1. United States
- 1.2. Canada
- 1.3. Mexico
-
2. Europe
- 2.1. Germany
- 2.2. United Kingdom
- 2.3. France
- 2.4. Italy
- 2.5. Spain
- 2.6. Rest of Europe
-
3. Asia Pacific
- 3.1. China
- 3.2. Japan
- 3.3. India
- 3.4. Australia
- 3.5. South Korea
- 3.6. Rest of Asia Pacific
-
4. Middle East and Africa
- 4.1. GCC
- 4.2. South Africa
- 4.3. Rest of Middle East and Africa
-
5. South America
- 5.1. Brazil
- 5.2. Argentina
- 5.3. Rest of South America
Chromatography Data Systems Market REPORT HIGHLIGHTS
| Aspects | Details |
|---|---|
| Study Period | 2019-2033 |
| Base Year | 2024 |
| Estimated Year | 2025 |
| Forecast Period | 2025-2033 |
| Historical Period | 2019-2024 |
| Growth Rate | CAGR of 7.92% from 2019-2033 |
| Segmentation |
|
Table of Contents
- 1. Introduction
- 1.1. Research Scope
- 1.2. Market Segmentation
- 1.3. Research Methodology
- 1.4. Definitions and Assumptions
- 2. Executive Summary
- 2.1. Introduction
- 3. Market Dynamics
- 3.1. Introduction
- 3.2. Market Drivers
- 3.2.1. Rising Expenses on Research and Development From Life Sciences Sector; Growing Demand for Food Testing
- 3.3. Market Restrains
- 3.3.1. Rising Expenses on Research and Development From Life Sciences Sector; Growing Demand for Food Testing
- 3.4. Market Trends
- 3.4.1. The Cloud Segment is Expected to Witness Substantial Growth Over the Forecast Period
- 4. Market Factor Analysis
- 4.1. Porters Five Forces
- 4.2. Supply/Value Chain
- 4.3. PESTEL analysis
- 4.4. Market Entropy
- 4.5. Patent/Trademark Analysis
- 5. Global Chromatography Data Systems Market Analysis, Insights and Forecast, 2019-2031
- 5.1. Market Analysis, Insights and Forecast - by Type
- 5.1.1. Integrated
- 5.1.2. Standalone
- 5.2. Market Analysis, Insights and Forecast - by Deployment
- 5.2.1. Cloud
- 5.2.2. On-Premise
- 5.3. Market Analysis, Insights and Forecast - by Enterprise Size
- 5.3.1. Large Enterprises
- 5.3.2. Small & Medium Enterprises
- 5.4. Market Analysis, Insights and Forecast - by End-User
- 5.4.1. Academic Institutes
- 5.4.2. Food & Beverage Industry
- 5.4.3. Pharmaceutical & Biopharmaceutical Industry
- 5.4.4. Others (
- 5.5. Market Analysis, Insights and Forecast - by Region
- 5.5.1. North America
- 5.5.2. Europe
- 5.5.3. Asia Pacific
- 5.5.4. Middle East and Africa
- 5.5.5. South America
- 5.1. Market Analysis, Insights and Forecast - by Type
- 6. North America Chromatography Data Systems Market Analysis, Insights and Forecast, 2019-2031
- 6.1. Market Analysis, Insights and Forecast - by Type
- 6.1.1. Integrated
- 6.1.2. Standalone
- 6.2. Market Analysis, Insights and Forecast - by Deployment
- 6.2.1. Cloud
- 6.2.2. On-Premise
- 6.3. Market Analysis, Insights and Forecast - by Enterprise Size
- 6.3.1. Large Enterprises
- 6.3.2. Small & Medium Enterprises
- 6.4. Market Analysis, Insights and Forecast - by End-User
- 6.4.1. Academic Institutes
- 6.4.2. Food & Beverage Industry
- 6.4.3. Pharmaceutical & Biopharmaceutical Industry
- 6.4.4. Others (
- 6.1. Market Analysis, Insights and Forecast - by Type
- 7. Europe Chromatography Data Systems Market Analysis, Insights and Forecast, 2019-2031
- 7.1. Market Analysis, Insights and Forecast - by Type
- 7.1.1. Integrated
- 7.1.2. Standalone
- 7.2. Market Analysis, Insights and Forecast - by Deployment
- 7.2.1. Cloud
- 7.2.2. On-Premise
- 7.3. Market Analysis, Insights and Forecast - by Enterprise Size
- 7.3.1. Large Enterprises
- 7.3.2. Small & Medium Enterprises
- 7.4. Market Analysis, Insights and Forecast - by End-User
- 7.4.1. Academic Institutes
- 7.4.2. Food & Beverage Industry
- 7.4.3. Pharmaceutical & Biopharmaceutical Industry
- 7.4.4. Others (
- 7.1. Market Analysis, Insights and Forecast - by Type
- 8. Asia Pacific Chromatography Data Systems Market Analysis, Insights and Forecast, 2019-2031
- 8.1. Market Analysis, Insights and Forecast - by Type
- 8.1.1. Integrated
- 8.1.2. Standalone
- 8.2. Market Analysis, Insights and Forecast - by Deployment
- 8.2.1. Cloud
- 8.2.2. On-Premise
- 8.3. Market Analysis, Insights and Forecast - by Enterprise Size
- 8.3.1. Large Enterprises
- 8.3.2. Small & Medium Enterprises
- 8.4. Market Analysis, Insights and Forecast - by End-User
- 8.4.1. Academic Institutes
- 8.4.2. Food & Beverage Industry
- 8.4.3. Pharmaceutical & Biopharmaceutical Industry
- 8.4.4. Others (
- 8.1. Market Analysis, Insights and Forecast - by Type
- 9. Middle East and Africa Chromatography Data Systems Market Analysis, Insights and Forecast, 2019-2031
- 9.1. Market Analysis, Insights and Forecast - by Type
- 9.1.1. Integrated
- 9.1.2. Standalone
- 9.2. Market Analysis, Insights and Forecast - by Deployment
- 9.2.1. Cloud
- 9.2.2. On-Premise
- 9.3. Market Analysis, Insights and Forecast - by Enterprise Size
- 9.3.1. Large Enterprises
- 9.3.2. Small & Medium Enterprises
- 9.4. Market Analysis, Insights and Forecast - by End-User
- 9.4.1. Academic Institutes
- 9.4.2. Food & Beverage Industry
- 9.4.3. Pharmaceutical & Biopharmaceutical Industry
- 9.4.4. Others (
- 9.1. Market Analysis, Insights and Forecast - by Type
- 10. South America Chromatography Data Systems Market Analysis, Insights and Forecast, 2019-2031
- 10.1. Market Analysis, Insights and Forecast - by Type
- 10.1.1. Integrated
- 10.1.2. Standalone
- 10.2. Market Analysis, Insights and Forecast - by Deployment
- 10.2.1. Cloud
- 10.2.2. On-Premise
- 10.3. Market Analysis, Insights and Forecast - by Enterprise Size
- 10.3.1. Large Enterprises
- 10.3.2. Small & Medium Enterprises
- 10.4. Market Analysis, Insights and Forecast - by End-User
- 10.4.1. Academic Institutes
- 10.4.2. Food & Beverage Industry
- 10.4.3. Pharmaceutical & Biopharmaceutical Industry
- 10.4.4. Others (
- 10.1. Market Analysis, Insights and Forecast - by Type
- 11. Competitive Analysis
- 11.1. Global Market Share Analysis 2024
- 11.2. Company Profiles
- 11.2.1 Advanced Chemistry Development Inc
- 11.2.1.1. Overview
- 11.2.1.2. Products
- 11.2.1.3. SWOT Analysis
- 11.2.1.4. Recent Developments
- 11.2.1.5. Financials (Based on Availability)
- 11.2.2 Agilent Technologies Inc
- 11.2.2.1. Overview
- 11.2.2.2. Products
- 11.2.2.3. SWOT Analysis
- 11.2.2.4. Recent Developments
- 11.2.2.5. Financials (Based on Availability)
- 11.2.3 Bio-Rad Laboratories Inc
- 11.2.3.1. Overview
- 11.2.3.2. Products
- 11.2.3.3. SWOT Analysis
- 11.2.3.4. Recent Developments
- 11.2.3.5. Financials (Based on Availability)
- 11.2.4 Bruker Corporation
- 11.2.4.1. Overview
- 11.2.4.2. Products
- 11.2.4.3. SWOT Analysis
- 11.2.4.4. Recent Developments
- 11.2.4.5. Financials (Based on Availability)
- 11.2.5 JASCO International Co Ltd
- 11.2.5.1. Overview
- 11.2.5.2. Products
- 11.2.5.3. SWOT Analysis
- 11.2.5.4. Recent Developments
- 11.2.5.5. Financials (Based on Availability)
- 11.2.6 Justice Innovations Inc
- 11.2.6.1. Overview
- 11.2.6.2. Products
- 11.2.6.3. SWOT Analysis
- 11.2.6.4. Recent Developments
- 11.2.6.5. Financials (Based on Availability)
- 11.2.7 PerkinElmer Inc
- 11.2.7.1. Overview
- 11.2.7.2. Products
- 11.2.7.3. SWOT Analysis
- 11.2.7.4. Recent Developments
- 11.2.7.5. Financials (Based on Availability)
- 11.2.8 Shimadzu Corporation
- 11.2.8.1. Overview
- 11.2.8.2. Products
- 11.2.8.3. SWOT Analysis
- 11.2.8.4. Recent Developments
- 11.2.8.5. Financials (Based on Availability)
- 11.2.9 Thermo Fisher Scientific Inc
- 11.2.9.1. Overview
- 11.2.9.2. Products
- 11.2.9.3. SWOT Analysis
- 11.2.9.4. Recent Developments
- 11.2.9.5. Financials (Based on Availability)
- 11.2.10 Waters Corporatio
- 11.2.10.1. Overview
- 11.2.10.2. Products
- 11.2.10.3. SWOT Analysis
- 11.2.10.4. Recent Developments
- 11.2.10.5. Financials (Based on Availability)
- 11.2.1 Advanced Chemistry Development Inc
List of Figures
- Figure 1: Global Chromatography Data Systems Market Revenue Breakdown (Million, %) by Region 2024 & 2032
- Figure 2: Global Chromatography Data Systems Market Volume Breakdown (Million, %) by Region 2024 & 2032
- Figure 3: North America Chromatography Data Systems Market Revenue (Million), by Type 2024 & 2032
- Figure 4: North America Chromatography Data Systems Market Volume (Million), by Type 2024 & 2032
- Figure 5: North America Chromatography Data Systems Market Revenue Share (%), by Type 2024 & 2032
- Figure 6: North America Chromatography Data Systems Market Volume Share (%), by Type 2024 & 2032
- Figure 7: North America Chromatography Data Systems Market Revenue (Million), by Deployment 2024 & 2032
- Figure 8: North America Chromatography Data Systems Market Volume (Million), by Deployment 2024 & 2032
- Figure 9: North America Chromatography Data Systems Market Revenue Share (%), by Deployment 2024 & 2032
- Figure 10: North America Chromatography Data Systems Market Volume Share (%), by Deployment 2024 & 2032
- Figure 11: North America Chromatography Data Systems Market Revenue (Million), by Enterprise Size 2024 & 2032
- Figure 12: North America Chromatography Data Systems Market Volume (Million), by Enterprise Size 2024 & 2032
- Figure 13: North America Chromatography Data Systems Market Revenue Share (%), by Enterprise Size 2024 & 2032
- Figure 14: North America Chromatography Data Systems Market Volume Share (%), by Enterprise Size 2024 & 2032
- Figure 15: North America Chromatography Data Systems Market Revenue (Million), by End-User 2024 & 2032
- Figure 16: North America Chromatography Data Systems Market Volume (Million), by End-User 2024 & 2032
- Figure 17: North America Chromatography Data Systems Market Revenue Share (%), by End-User 2024 & 2032
- Figure 18: North America Chromatography Data Systems Market Volume Share (%), by End-User 2024 & 2032
- Figure 19: North America Chromatography Data Systems Market Revenue (Million), by Country 2024 & 2032
- Figure 20: North America Chromatography Data Systems Market Volume (Million), by Country 2024 & 2032
- Figure 21: North America Chromatography Data Systems Market Revenue Share (%), by Country 2024 & 2032
- Figure 22: North America Chromatography Data Systems Market Volume Share (%), by Country 2024 & 2032
- Figure 23: Europe Chromatography Data Systems Market Revenue (Million), by Type 2024 & 2032
- Figure 24: Europe Chromatography Data Systems Market Volume (Million), by Type 2024 & 2032
- Figure 25: Europe Chromatography Data Systems Market Revenue Share (%), by Type 2024 & 2032
- Figure 26: Europe Chromatography Data Systems Market Volume Share (%), by Type 2024 & 2032
- Figure 27: Europe Chromatography Data Systems Market Revenue (Million), by Deployment 2024 & 2032
- Figure 28: Europe Chromatography Data Systems Market Volume (Million), by Deployment 2024 & 2032
- Figure 29: Europe Chromatography Data Systems Market Revenue Share (%), by Deployment 2024 & 2032
- Figure 30: Europe Chromatography Data Systems Market Volume Share (%), by Deployment 2024 & 2032
- Figure 31: Europe Chromatography Data Systems Market Revenue (Million), by Enterprise Size 2024 & 2032
- Figure 32: Europe Chromatography Data Systems Market Volume (Million), by Enterprise Size 2024 & 2032
- Figure 33: Europe Chromatography Data Systems Market Revenue Share (%), by Enterprise Size 2024 & 2032
- Figure 34: Europe Chromatography Data Systems Market Volume Share (%), by Enterprise Size 2024 & 2032
- Figure 35: Europe Chromatography Data Systems Market Revenue (Million), by End-User 2024 & 2032
- Figure 36: Europe Chromatography Data Systems Market Volume (Million), by End-User 2024 & 2032
- Figure 37: Europe Chromatography Data Systems Market Revenue Share (%), by End-User 2024 & 2032
- Figure 38: Europe Chromatography Data Systems Market Volume Share (%), by End-User 2024 & 2032
- Figure 39: Europe Chromatography Data Systems Market Revenue (Million), by Country 2024 & 2032
- Figure 40: Europe Chromatography Data Systems Market Volume (Million), by Country 2024 & 2032
- Figure 41: Europe Chromatography Data Systems Market Revenue Share (%), by Country 2024 & 2032
- Figure 42: Europe Chromatography Data Systems Market Volume Share (%), by Country 2024 & 2032
- Figure 43: Asia Pacific Chromatography Data Systems Market Revenue (Million), by Type 2024 & 2032
- Figure 44: Asia Pacific Chromatography Data Systems Market Volume (Million), by Type 2024 & 2032
- Figure 45: Asia Pacific Chromatography Data Systems Market Revenue Share (%), by Type 2024 & 2032
- Figure 46: Asia Pacific Chromatography Data Systems Market Volume Share (%), by Type 2024 & 2032
- Figure 47: Asia Pacific Chromatography Data Systems Market Revenue (Million), by Deployment 2024 & 2032
- Figure 48: Asia Pacific Chromatography Data Systems Market Volume (Million), by Deployment 2024 & 2032
- Figure 49: Asia Pacific Chromatography Data Systems Market Revenue Share (%), by Deployment 2024 & 2032
- Figure 50: Asia Pacific Chromatography Data Systems Market Volume Share (%), by Deployment 2024 & 2032
- Figure 51: Asia Pacific Chromatography Data Systems Market Revenue (Million), by Enterprise Size 2024 & 2032
- Figure 52: Asia Pacific Chromatography Data Systems Market Volume (Million), by Enterprise Size 2024 & 2032
- Figure 53: Asia Pacific Chromatography Data Systems Market Revenue Share (%), by Enterprise Size 2024 & 2032
- Figure 54: Asia Pacific Chromatography Data Systems Market Volume Share (%), by Enterprise Size 2024 & 2032
- Figure 55: Asia Pacific Chromatography Data Systems Market Revenue (Million), by End-User 2024 & 2032
- Figure 56: Asia Pacific Chromatography Data Systems Market Volume (Million), by End-User 2024 & 2032
- Figure 57: Asia Pacific Chromatography Data Systems Market Revenue Share (%), by End-User 2024 & 2032
- Figure 58: Asia Pacific Chromatography Data Systems Market Volume Share (%), by End-User 2024 & 2032
- Figure 59: Asia Pacific Chromatography Data Systems Market Revenue (Million), by Country 2024 & 2032
- Figure 60: Asia Pacific Chromatography Data Systems Market Volume (Million), by Country 2024 & 2032
- Figure 61: Asia Pacific Chromatography Data Systems Market Revenue Share (%), by Country 2024 & 2032
- Figure 62: Asia Pacific Chromatography Data Systems Market Volume Share (%), by Country 2024 & 2032
- Figure 63: Middle East and Africa Chromatography Data Systems Market Revenue (Million), by Type 2024 & 2032
- Figure 64: Middle East and Africa Chromatography Data Systems Market Volume (Million), by Type 2024 & 2032
- Figure 65: Middle East and Africa Chromatography Data Systems Market Revenue Share (%), by Type 2024 & 2032
- Figure 66: Middle East and Africa Chromatography Data Systems Market Volume Share (%), by Type 2024 & 2032
- Figure 67: Middle East and Africa Chromatography Data Systems Market Revenue (Million), by Deployment 2024 & 2032
- Figure 68: Middle East and Africa Chromatography Data Systems Market Volume (Million), by Deployment 2024 & 2032
- Figure 69: Middle East and Africa Chromatography Data Systems Market Revenue Share (%), by Deployment 2024 & 2032
- Figure 70: Middle East and Africa Chromatography Data Systems Market Volume Share (%), by Deployment 2024 & 2032
- Figure 71: Middle East and Africa Chromatography Data Systems Market Revenue (Million), by Enterprise Size 2024 & 2032
- Figure 72: Middle East and Africa Chromatography Data Systems Market Volume (Million), by Enterprise Size 2024 & 2032
- Figure 73: Middle East and Africa Chromatography Data Systems Market Revenue Share (%), by Enterprise Size 2024 & 2032
- Figure 74: Middle East and Africa Chromatography Data Systems Market Volume Share (%), by Enterprise Size 2024 & 2032
- Figure 75: Middle East and Africa Chromatography Data Systems Market Revenue (Million), by End-User 2024 & 2032
- Figure 76: Middle East and Africa Chromatography Data Systems Market Volume (Million), by End-User 2024 & 2032
- Figure 77: Middle East and Africa Chromatography Data Systems Market Revenue Share (%), by End-User 2024 & 2032
- Figure 78: Middle East and Africa Chromatography Data Systems Market Volume Share (%), by End-User 2024 & 2032
- Figure 79: Middle East and Africa Chromatography Data Systems Market Revenue (Million), by Country 2024 & 2032
- Figure 80: Middle East and Africa Chromatography Data Systems Market Volume (Million), by Country 2024 & 2032
- Figure 81: Middle East and Africa Chromatography Data Systems Market Revenue Share (%), by Country 2024 & 2032
- Figure 82: Middle East and Africa Chromatography Data Systems Market Volume Share (%), by Country 2024 & 2032
- Figure 83: South America Chromatography Data Systems Market Revenue (Million), by Type 2024 & 2032
- Figure 84: South America Chromatography Data Systems Market Volume (Million), by Type 2024 & 2032
- Figure 85: South America Chromatography Data Systems Market Revenue Share (%), by Type 2024 & 2032
- Figure 86: South America Chromatography Data Systems Market Volume Share (%), by Type 2024 & 2032
- Figure 87: South America Chromatography Data Systems Market Revenue (Million), by Deployment 2024 & 2032
- Figure 88: South America Chromatography Data Systems Market Volume (Million), by Deployment 2024 & 2032
- Figure 89: South America Chromatography Data Systems Market Revenue Share (%), by Deployment 2024 & 2032
- Figure 90: South America Chromatography Data Systems Market Volume Share (%), by Deployment 2024 & 2032
- Figure 91: South America Chromatography Data Systems Market Revenue (Million), by Enterprise Size 2024 & 2032
- Figure 92: South America Chromatography Data Systems Market Volume (Million), by Enterprise Size 2024 & 2032
- Figure 93: South America Chromatography Data Systems Market Revenue Share (%), by Enterprise Size 2024 & 2032
- Figure 94: South America Chromatography Data Systems Market Volume Share (%), by Enterprise Size 2024 & 2032
- Figure 95: South America Chromatography Data Systems Market Revenue (Million), by End-User 2024 & 2032
- Figure 96: South America Chromatography Data Systems Market Volume (Million), by End-User 2024 & 2032
- Figure 97: South America Chromatography Data Systems Market Revenue Share (%), by End-User 2024 & 2032
- Figure 98: South America Chromatography Data Systems Market Volume Share (%), by End-User 2024 & 2032
- Figure 99: South America Chromatography Data Systems Market Revenue (Million), by Country 2024 & 2032
- Figure 100: South America Chromatography Data Systems Market Volume (Million), by Country 2024 & 2032
- Figure 101: South America Chromatography Data Systems Market Revenue Share (%), by Country 2024 & 2032
- Figure 102: South America Chromatography Data Systems Market Volume Share (%), by Country 2024 & 2032
List of Tables
- Table 1: Global Chromatography Data Systems Market Revenue Million Forecast, by Region 2019 & 2032
- Table 2: Global Chromatography Data Systems Market Volume Million Forecast, by Region 2019 & 2032
- Table 3: Global Chromatography Data Systems Market Revenue Million Forecast, by Type 2019 & 2032
- Table 4: Global Chromatography Data Systems Market Volume Million Forecast, by Type 2019 & 2032
- Table 5: Global Chromatography Data Systems Market Revenue Million Forecast, by Deployment 2019 & 2032
- Table 6: Global Chromatography Data Systems Market Volume Million Forecast, by Deployment 2019 & 2032
- Table 7: Global Chromatography Data Systems Market Revenue Million Forecast, by Enterprise Size 2019 & 2032
- Table 8: Global Chromatography Data Systems Market Volume Million Forecast, by Enterprise Size 2019 & 2032
- Table 9: Global Chromatography Data Systems Market Revenue Million Forecast, by End-User 2019 & 2032
- Table 10: Global Chromatography Data Systems Market Volume Million Forecast, by End-User 2019 & 2032
- Table 11: Global Chromatography Data Systems Market Revenue Million Forecast, by Region 2019 & 2032
- Table 12: Global Chromatography Data Systems Market Volume Million Forecast, by Region 2019 & 2032
- Table 13: Global Chromatography Data Systems Market Revenue Million Forecast, by Type 2019 & 2032
- Table 14: Global Chromatography Data Systems Market Volume Million Forecast, by Type 2019 & 2032
- Table 15: Global Chromatography Data Systems Market Revenue Million Forecast, by Deployment 2019 & 2032
- Table 16: Global Chromatography Data Systems Market Volume Million Forecast, by Deployment 2019 & 2032
- Table 17: Global Chromatography Data Systems Market Revenue Million Forecast, by Enterprise Size 2019 & 2032
- Table 18: Global Chromatography Data Systems Market Volume Million Forecast, by Enterprise Size 2019 & 2032
- Table 19: Global Chromatography Data Systems Market Revenue Million Forecast, by End-User 2019 & 2032
- Table 20: Global Chromatography Data Systems Market Volume Million Forecast, by End-User 2019 & 2032
- Table 21: Global Chromatography Data Systems Market Revenue Million Forecast, by Country 2019 & 2032
- Table 22: Global Chromatography Data Systems Market Volume Million Forecast, by Country 2019 & 2032
- Table 23: United States Chromatography Data Systems Market Revenue (Million) Forecast, by Application 2019 & 2032
- Table 24: United States Chromatography Data Systems Market Volume (Million) Forecast, by Application 2019 & 2032
- Table 25: Canada Chromatography Data Systems Market Revenue (Million) Forecast, by Application 2019 & 2032
- Table 26: Canada Chromatography Data Systems Market Volume (Million) Forecast, by Application 2019 & 2032
- Table 27: Mexico Chromatography Data Systems Market Revenue (Million) Forecast, by Application 2019 & 2032
- Table 28: Mexico Chromatography Data Systems Market Volume (Million) Forecast, by Application 2019 & 2032
- Table 29: Global Chromatography Data Systems Market Revenue Million Forecast, by Type 2019 & 2032
- Table 30: Global Chromatography Data Systems Market Volume Million Forecast, by Type 2019 & 2032
- Table 31: Global Chromatography Data Systems Market Revenue Million Forecast, by Deployment 2019 & 2032
- Table 32: Global Chromatography Data Systems Market Volume Million Forecast, by Deployment 2019 & 2032
- Table 33: Global Chromatography Data Systems Market Revenue Million Forecast, by Enterprise Size 2019 & 2032
- Table 34: Global Chromatography Data Systems Market Volume Million Forecast, by Enterprise Size 2019 & 2032
- Table 35: Global Chromatography Data Systems Market Revenue Million Forecast, by End-User 2019 & 2032
- Table 36: Global Chromatography Data Systems Market Volume Million Forecast, by End-User 2019 & 2032
- Table 37: Global Chromatography Data Systems Market Revenue Million Forecast, by Country 2019 & 2032
- Table 38: Global Chromatography Data Systems Market Volume Million Forecast, by Country 2019 & 2032
- Table 39: Germany Chromatography Data Systems Market Revenue (Million) Forecast, by Application 2019 & 2032
- Table 40: Germany Chromatography Data Systems Market Volume (Million) Forecast, by Application 2019 & 2032
- Table 41: United Kingdom Chromatography Data Systems Market Revenue (Million) Forecast, by Application 2019 & 2032
- Table 42: United Kingdom Chromatography Data Systems Market Volume (Million) Forecast, by Application 2019 & 2032
- Table 43: France Chromatography Data Systems Market Revenue (Million) Forecast, by Application 2019 & 2032
- Table 44: France Chromatography Data Systems Market Volume (Million) Forecast, by Application 2019 & 2032
- Table 45: Italy Chromatography Data Systems Market Revenue (Million) Forecast, by Application 2019 & 2032
- Table 46: Italy Chromatography Data Systems Market Volume (Million) Forecast, by Application 2019 & 2032
- Table 47: Spain Chromatography Data Systems Market Revenue (Million) Forecast, by Application 2019 & 2032
- Table 48: Spain Chromatography Data Systems Market Volume (Million) Forecast, by Application 2019 & 2032
- Table 49: Rest of Europe Chromatography Data Systems Market Revenue (Million) Forecast, by Application 2019 & 2032
- Table 50: Rest of Europe Chromatography Data Systems Market Volume (Million) Forecast, by Application 2019 & 2032
- Table 51: Global Chromatography Data Systems Market Revenue Million Forecast, by Type 2019 & 2032
- Table 52: Global Chromatography Data Systems Market Volume Million Forecast, by Type 2019 & 2032
- Table 53: Global Chromatography Data Systems Market Revenue Million Forecast, by Deployment 2019 & 2032
- Table 54: Global Chromatography Data Systems Market Volume Million Forecast, by Deployment 2019 & 2032
- Table 55: Global Chromatography Data Systems Market Revenue Million Forecast, by Enterprise Size 2019 & 2032
- Table 56: Global Chromatography Data Systems Market Volume Million Forecast, by Enterprise Size 2019 & 2032
- Table 57: Global Chromatography Data Systems Market Revenue Million Forecast, by End-User 2019 & 2032
- Table 58: Global Chromatography Data Systems Market Volume Million Forecast, by End-User 2019 & 2032
- Table 59: Global Chromatography Data Systems Market Revenue Million Forecast, by Country 2019 & 2032
- Table 60: Global Chromatography Data Systems Market Volume Million Forecast, by Country 2019 & 2032
- Table 61: China Chromatography Data Systems Market Revenue (Million) Forecast, by Application 2019 & 2032
- Table 62: China Chromatography Data Systems Market Volume (Million) Forecast, by Application 2019 & 2032
- Table 63: Japan Chromatography Data Systems Market Revenue (Million) Forecast, by Application 2019 & 2032
- Table 64: Japan Chromatography Data Systems Market Volume (Million) Forecast, by Application 2019 & 2032
- Table 65: India Chromatography Data Systems Market Revenue (Million) Forecast, by Application 2019 & 2032
- Table 66: India Chromatography Data Systems Market Volume (Million) Forecast, by Application 2019 & 2032
- Table 67: Australia Chromatography Data Systems Market Revenue (Million) Forecast, by Application 2019 & 2032
- Table 68: Australia Chromatography Data Systems Market Volume (Million) Forecast, by Application 2019 & 2032
- Table 69: South Korea Chromatography Data Systems Market Revenue (Million) Forecast, by Application 2019 & 2032
- Table 70: South Korea Chromatography Data Systems Market Volume (Million) Forecast, by Application 2019 & 2032
- Table 71: Rest of Asia Pacific Chromatography Data Systems Market Revenue (Million) Forecast, by Application 2019 & 2032
- Table 72: Rest of Asia Pacific Chromatography Data Systems Market Volume (Million) Forecast, by Application 2019 & 2032
- Table 73: Global Chromatography Data Systems Market Revenue Million Forecast, by Type 2019 & 2032
- Table 74: Global Chromatography Data Systems Market Volume Million Forecast, by Type 2019 & 2032
- Table 75: Global Chromatography Data Systems Market Revenue Million Forecast, by Deployment 2019 & 2032
- Table 76: Global Chromatography Data Systems Market Volume Million Forecast, by Deployment 2019 & 2032
- Table 77: Global Chromatography Data Systems Market Revenue Million Forecast, by Enterprise Size 2019 & 2032
- Table 78: Global Chromatography Data Systems Market Volume Million Forecast, by Enterprise Size 2019 & 2032
- Table 79: Global Chromatography Data Systems Market Revenue Million Forecast, by End-User 2019 & 2032
- Table 80: Global Chromatography Data Systems Market Volume Million Forecast, by End-User 2019 & 2032
- Table 81: Global Chromatography Data Systems Market Revenue Million Forecast, by Country 2019 & 2032
- Table 82: Global Chromatography Data Systems Market Volume Million Forecast, by Country 2019 & 2032
- Table 83: GCC Chromatography Data Systems Market Revenue (Million) Forecast, by Application 2019 & 2032
- Table 84: GCC Chromatography Data Systems Market Volume (Million) Forecast, by Application 2019 & 2032
- Table 85: South Africa Chromatography Data Systems Market Revenue (Million) Forecast, by Application 2019 & 2032
- Table 86: South Africa Chromatography Data Systems Market Volume (Million) Forecast, by Application 2019 & 2032
- Table 87: Rest of Middle East and Africa Chromatography Data Systems Market Revenue (Million) Forecast, by Application 2019 & 2032
- Table 88: Rest of Middle East and Africa Chromatography Data Systems Market Volume (Million) Forecast, by Application 2019 & 2032
- Table 89: Global Chromatography Data Systems Market Revenue Million Forecast, by Type 2019 & 2032
- Table 90: Global Chromatography Data Systems Market Volume Million Forecast, by Type 2019 & 2032
- Table 91: Global Chromatography Data Systems Market Revenue Million Forecast, by Deployment 2019 & 2032
- Table 92: Global Chromatography Data Systems Market Volume Million Forecast, by Deployment 2019 & 2032
- Table 93: Global Chromatography Data Systems Market Revenue Million Forecast, by Enterprise Size 2019 & 2032
- Table 94: Global Chromatography Data Systems Market Volume Million Forecast, by Enterprise Size 2019 & 2032
- Table 95: Global Chromatography Data Systems Market Revenue Million Forecast, by End-User 2019 & 2032
- Table 96: Global Chromatography Data Systems Market Volume Million Forecast, by End-User 2019 & 2032
- Table 97: Global Chromatography Data Systems Market Revenue Million Forecast, by Country 2019 & 2032
- Table 98: Global Chromatography Data Systems Market Volume Million Forecast, by Country 2019 & 2032
- Table 99: Brazil Chromatography Data Systems Market Revenue (Million) Forecast, by Application 2019 & 2032
- Table 100: Brazil Chromatography Data Systems Market Volume (Million) Forecast, by Application 2019 & 2032
- Table 101: Argentina Chromatography Data Systems Market Revenue (Million) Forecast, by Application 2019 & 2032
- Table 102: Argentina Chromatography Data Systems Market Volume (Million) Forecast, by Application 2019 & 2032
- Table 103: Rest of South America Chromatography Data Systems Market Revenue (Million) Forecast, by Application 2019 & 2032
- Table 104: Rest of South America Chromatography Data Systems Market Volume (Million) Forecast, by Application 2019 & 2032
Frequently Asked Questions
1. What is the projected Compound Annual Growth Rate (CAGR) of the Chromatography Data Systems Market?
The projected CAGR is approximately 7.92%.
2. Which companies are prominent players in the Chromatography Data Systems Market?
Key companies in the market include Advanced Chemistry Development Inc, Agilent Technologies Inc, Bio-Rad Laboratories Inc, Bruker Corporation, JASCO International Co Ltd, Justice Innovations Inc, PerkinElmer Inc, Shimadzu Corporation, Thermo Fisher Scientific Inc, Waters Corporatio.
3. What are the main segments of the Chromatography Data Systems Market?
The market segments include Type, Deployment, Enterprise Size, End-User.
4. Can you provide details about the market size?
The market size is estimated to be USD 506.63 Million as of 2022.
5. What are some drivers contributing to market growth?
Rising Expenses on Research and Development From Life Sciences Sector; Growing Demand for Food Testing.
6. What are the notable trends driving market growth?
The Cloud Segment is Expected to Witness Substantial Growth Over the Forecast Period.
7. Are there any restraints impacting market growth?
Rising Expenses on Research and Development From Life Sciences Sector; Growing Demand for Food Testing.
8. Can you provide examples of recent developments in the market?
May 2023: Sciex Corporation, a United States-based manufacturer of mass spectrometry instrumentation, launched the BioPhase 8800 driver, which enables the easy integration of the BioPhase 8800 system with the Empower chromatography data system from Waters Technologies Corporation.
9. What pricing options are available for accessing the report?
Pricing options include single-user, multi-user, and enterprise licenses priced at USD 4750, USD 5250, and USD 8750 respectively.
10. Is the market size provided in terms of value or volume?
The market size is provided in terms of value, measured in Million and volume, measured in Million.
11. Are there any specific market keywords associated with the report?
Yes, the market keyword associated with the report is "Chromatography Data Systems Market," which aids in identifying and referencing the specific market segment covered.
12. How do I determine which pricing option suits my needs best?
The pricing options vary based on user requirements and access needs. Individual users may opt for single-user licenses, while businesses requiring broader access may choose multi-user or enterprise licenses for cost-effective access to the report.
13. Are there any additional resources or data provided in the Chromatography Data Systems Market report?
While the report offers comprehensive insights, it's advisable to review the specific contents or supplementary materials provided to ascertain if additional resources or data are available.
14. How can I stay updated on further developments or reports in the Chromatography Data Systems Market?
To stay informed about further developments, trends, and reports in the Chromatography Data Systems Market, consider subscribing to industry newsletters, following relevant companies and organizations, or regularly checking reputable industry news sources and publications.
Methodology
Step 1 - Identification of Relevant Samples Size from Population Database


Step 2 - Approaches for Defining Global Market Size (Value, Volume* & Price*)

Note*: In applicable scenarios
Step 3 - Data Sources
Primary Research
- Web Analytics
- Survey Reports
- Research Institute
- Latest Research Reports
- Opinion Leaders
Secondary Research
- Annual Reports
- White Paper
- Latest Press Release
- Industry Association
- Paid Database
- Investor Presentations

Step 4 - Data Triangulation
Involves using different sources of information in order to increase the validity of a study
These sources are likely to be stakeholders in a program - participants, other researchers, program staff, other community members, and so on.
Then we put all data in single framework & apply various statistical tools to find out the dynamic on the market.
During the analysis stage, feedback from the stakeholder groups would be compared to determine areas of agreement as well as areas of divergence


