
Key Insights
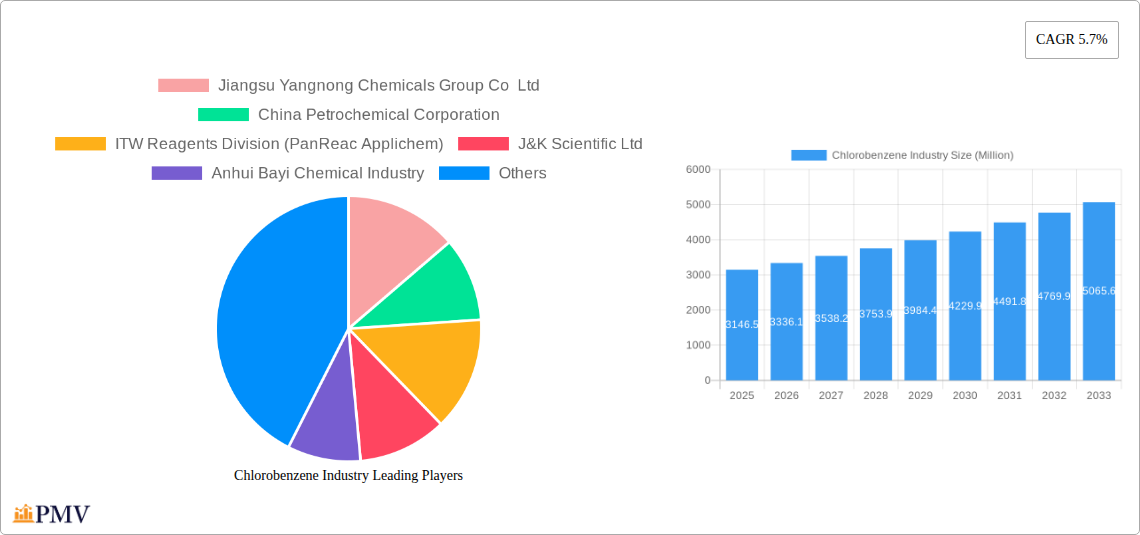
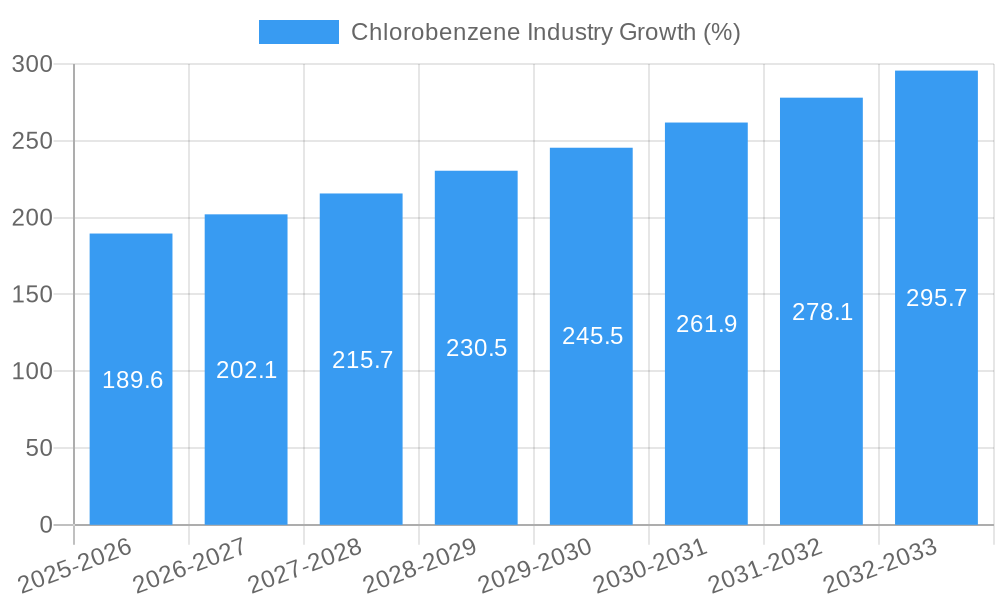
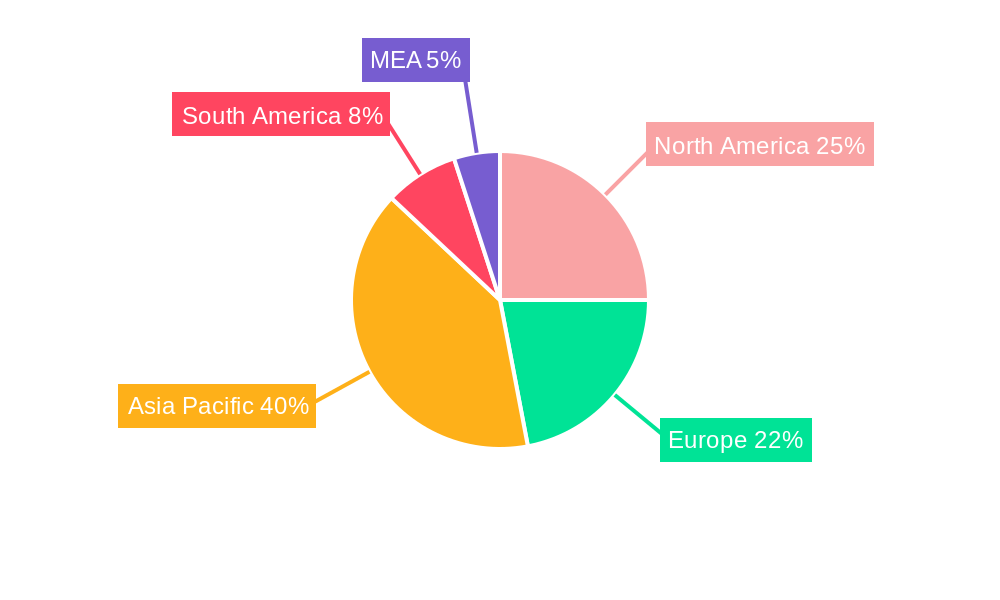
The chlorobenzene market, valued at $3,146.5 million in 2025, is projected to experience robust growth, driven by increasing demand across diverse applications. A Compound Annual Growth Rate (CAGR) of 5.7% from 2025 to 2033 indicates a significant expansion of this market over the forecast period. Key growth drivers include the rising use of chlorobenzene derivatives in the production of pesticides and herbicides within the agriculture sector, the expanding pharmaceutical industry requiring chlorobenzene as an intermediate in drug synthesis, and the steady growth in the production of polymers like polyphenylene sulfide and polysulfone, vital components in various industrial applications. Furthermore, the increasing demand for solvents and deodorants in personal care and household products contributes significantly to market expansion. While specific restraints aren't detailed, potential challenges could include fluctuating raw material prices, stringent environmental regulations surrounding chlorobenzene production and disposal, and the emergence of alternative chemical intermediates. Market segmentation reveals a diverse landscape, with monochlorobenzene dominating by volume due to its widespread use as a solvent and in pesticide manufacturing. The strong geographical presence of major chlorobenzene producers in Asia-Pacific, particularly China, positions this region as a key market driver. North America and Europe also contribute significantly, fueled by strong demand from established chemical and pharmaceutical industries.
The competitive landscape is characterized by a mix of large multinational corporations and regional players. Established companies like Jiangsu Yangnong Chemicals Group Co Ltd and China Petrochemical Corporation maintain significant market share due to their large-scale production capacities and established distribution networks. Smaller, specialized chemical companies cater to niche applications and regional demands. Future growth will likely be shaped by technological advancements aimed at improving production efficiency and reducing environmental impact, along with the strategic expansion of production capacities to meet the escalating global demand for chlorobenzene and its derivatives across varied end-use segments. The continuous development of innovative applications and the exploration of new market segments present further opportunities for market expansion and growth in the coming years.
Chlorobenzene Industry Market Report: 2019-2033
This comprehensive report provides a detailed analysis of the global chlorobenzene industry, covering market size, growth drivers, competitive landscape, and future outlook. The study period spans from 2019 to 2033, with a base year of 2025 and a forecast period from 2025 to 2033. This in-depth analysis is crucial for businesses involved in the production, distribution, and application of chlorobenzene and its derivatives. Key players such as Jiangsu Yangnong Chemicals Group Co Ltd, China Petrochemical Corporation, and Lanxess are profiled, offering invaluable insights for strategic decision-making. The report segments the market by type (Monochlorobenzene, o-dichlorobenzene, p-dichlorobenzene, m-Dichlorobenzene, Other Types), application (Moth Control, Nitrochlorobenzenes, Polyphenylene Sulfide, Polysulfone Polymers, Solvents, Room and Sanitary Deodorants, Other Applications), and industry vertical (Agriculture, Textile, Pharmaceutical, Chemical, Paint & Coating, Cosmetic & Personal Care, Others), providing a granular understanding of market dynamics.
Chlorobenzene Industry Market Structure & Competitive Dynamics
The chlorobenzene market exhibits a moderately concentrated structure, with a few major players holding significant market share. The global market is estimated at xx Million in 2025, with a projected CAGR of xx% during the forecast period (2025-2033). Key players such as Jiangsu Yangnong Chemicals Group Co Ltd and China Petrochemical Corporation contribute significantly to overall production volume, commanding a combined xx% market share in 2025. The competitive landscape is characterized by intense pricing pressures and a focus on innovation to differentiate product offerings. Regulatory frameworks, particularly those related to environmental protection and worker safety, are influencing the operational landscape significantly. Product substitutes, like alternative solvents and pest control agents, exert some competitive pressure. M&A activities have been relatively moderate in recent years, with deal values averaging xx Million per transaction. End-user trends towards sustainable solutions are pushing companies to invest in greener manufacturing processes and less harmful chlorobenzene alternatives.
- Market Concentration: Moderately concentrated, with top 5 players holding xx% market share in 2025.
- Innovation Ecosystems: Growing emphasis on sustainable and high-performance chlorobenzene derivatives.
- Regulatory Frameworks: Stringent environmental and safety regulations impacting manufacturing processes.
- Product Substitutes: Increasing competition from alternative solvents and pest control methods.
- M&A Activities: Moderate activity in recent years, with an average deal value of xx Million.
Chlorobenzene Industry Industry Trends & Insights
The global chlorobenzene market is projected to experience substantial growth driven by the increasing demand across diverse applications. The CAGR for the forecast period (2025-2033) is estimated at xx%, driven by factors such as the expanding pharmaceutical and agricultural sectors and the rising demand for specialty chemicals in diverse industrial processes. Technological disruptions are influencing the market through advancements in production efficiency and the development of eco-friendly chlorobenzene variants. Consumer preferences for sustainable products are putting pressure on companies to adopt environmentally conscious production methods and invest in research and development of green alternatives. The competitive dynamics are largely shaped by pricing strategies, innovation, and regulatory compliance, demanding significant investments in technology and compliance measures. Market penetration in emerging economies is anticipated to significantly increase during the forecast period.
Dominant Markets & Segments in Chlorobenzene Industry
The Asia-Pacific region is currently the dominant market for chlorobenzene, driven by robust growth in its manufacturing and chemical industries. China, in particular, plays a crucial role, contributing a substantial portion to global production and consumption. Within the segmentation analysis, Monochlorobenzene represents the largest segment by type, followed by o-dichlorobenzene and p-dichlorobenzene. In terms of application, solvents and the production of Polyphenylene Sulfide and Polysulfone Polymers dominate. The chemical industry represents the largest industry vertical, followed by the pharmaceutical and agricultural sectors.
Key Drivers in Asia-Pacific:
- Rapid industrialization and economic growth.
- Increasing demand from downstream industries (e.g., pharmaceuticals, pesticides).
- Supportive government policies and infrastructure development.
Dominant Segments:
- Type: Monochlorobenzene
- Application: Solvents, Polyphenylene Sulfide, Polysulfone Polymers
- Industry Vertical: Chemical
Chlorobenzene Industry Product Innovations
Recent innovations in chlorobenzene technology focus on enhancing production efficiency, improving product quality, and developing more sustainable manufacturing processes. This includes the development of new catalysts to improve reaction yields and reduce waste generation and the exploration of greener solvents and alternative reaction pathways. These innovations aim to address environmental concerns and meet evolving industry demands for sustainable and high-performance materials. Furthermore, the industry is witnessing a growth in specialized chlorobenzene derivatives tailored for niche applications, enhancing market competitiveness.
Report Segmentation & Scope
This report segments the chlorobenzene market comprehensively by type, application, and industry vertical. Each segment includes detailed analysis of market size, growth projections, and competitive landscape. Growth projections vary by segment, with some showing stronger growth potential than others. Competitive dynamics are analyzed based on factors like market share, pricing strategies, and product differentiation.
- By Type: Monochlorobenzene, o-dichlorobenzene, p-dichlorobenzene, m-Dichlorobenzene, Other Types (Each with market size and growth projections).
- By Application: Moth Control, Nitrochlorobenzenes, Polyphenylene Sulfide, Polysulfone Polymers, Solvents, Room and Sanitary Deodorants, Other Applications (Each with market size and growth projections).
- By Industry Vertical: Agriculture, Textile, Pharmaceutical, Chemical, Paint & Coating, Cosmetic & Personal Care, Others (Each with market size and growth projections).
Key Drivers of Chlorobenzene Industry Growth
The chlorobenzene industry's growth is fueled by several key factors. The increasing demand for solvents in various industries, including paints and coatings, is a major driver. The expanding pharmaceutical and agricultural sectors, which use chlorobenzene as an intermediate in the manufacturing of various products, also significantly contribute. Government policies supporting industrial growth in several regions and continuous technological advancements in manufacturing processes further boost market growth.
Challenges in the Chlorobenzene Industry Sector
The chlorobenzene industry faces several challenges. Stringent environmental regulations concerning the production and disposal of chlorobenzene pose significant hurdles, impacting operating costs. Fluctuations in raw material prices and supply chain disruptions can cause significant volatility in production costs. Intense competition from alternative chemicals and evolving consumer preferences for sustainable alternatives create pressure on producers to innovate and adapt.
Leading Players in the Chlorobenzene Industry Market
- Jiangsu Yangnong Chemicals Group Co Ltd
- China Petrochemical Corporation
- ITW Reagents Division (PanReac Applichem)
- J&K Scientific Ltd
- Anhui Bayi Chemical Industry
- Chemada Fine Chemicals
- Kureha Corporation
- Tianjin Bohai Chemical Industry Co Ltd
- Meryer (Shanghai) Chemical Technology Co Ltd
- Lanxess
Key Developments in Chlorobenzene Industry Sector
- 2022 Q4: Lanxess announced a new sustainable production process for chlorobenzene, reducing carbon emissions by xx%.
- 2023 Q1: Jiangsu Yangnong Chemicals Group Co Ltd invested xx Million in expanding its chlorobenzene production capacity.
- 2023 Q3: A new joint venture was formed between two key players to develop specialized chlorobenzene derivatives for pharmaceutical applications.
Strategic Chlorobenzene Industry Market Outlook
The chlorobenzene industry is poised for continued growth, driven by increasing demand from various sectors and ongoing technological advancements. Strategic opportunities exist in developing sustainable production processes, expanding into emerging markets, and focusing on niche applications with high growth potential. Companies that invest in innovation, sustainability, and strategic partnerships will be best positioned to capitalize on future market opportunities.
Chlorobenzene Industry Segmentation
-
1. Type
- 1.1. Monochlorobenzene
- 1.2. o-dichlorobenzene
- 1.3. p-dichlorobenzene
- 1.4. m-Dichlorobenzene
- 1.5. Other Types
-
2. Application
- 2.1. Moth Control
- 2.2. Nitrochlorobenzenes
- 2.3. Polyphenylene Sulfide
- 2.4. Polysulfone Polymers
- 2.5. Solvents
- 2.6. Room and Sanitary Deodorants
- 2.7. Other Applications
Chlorobenzene Industry Segmentation By Geography
-
1. Asia Pacific
- 1.1. China
- 1.2. India
- 1.3. Japan
- 1.4. South Korea
- 1.5. Malaysia
- 1.6. Thailand
- 1.7. Indonesia
- 1.8. Vietnam
- 1.9. Rest of Asia Pacific
-
2. North America
- 2.1. United States
- 2.2. Canada
- 2.3. Mexico
-
3. Europe
- 3.1. Germany
- 3.2. United Kingdom
- 3.3. France
- 3.4. Italy
- 3.5. Spain
- 3.6. Nordic
- 3.7. Turkey
- 3.8. Russia
- 3.9. Rest of Europe
-
4. South America
- 4.1. Brazil
- 4.2. Argentina
- 4.3. Colombia
- 4.4. Rest of South America
- 5. Middle East
-
6. Saudi Arabia
- 6.1. South Africa
- 6.2. Nigeria
- 6.3. Qatar
- 6.4. Egypt
- 6.5. United Arab Emirates
- 6.6. Rest of Middle East
Chlorobenzene Industry REPORT HIGHLIGHTS
| Aspects | Details |
|---|---|
| Study Period | 2019-2033 |
| Base Year | 2024 |
| Estimated Year | 2025 |
| Forecast Period | 2025-2033 |
| Historical Period | 2019-2024 |
| Growth Rate | CAGR of 5.7% from 2019-2033 |
| Segmentation |
|
Table of Contents
- 1. Introduction
- 1.1. Research Scope
- 1.2. Market Segmentation
- 1.3. Research Methodology
- 1.4. Definitions and Assumptions
- 2. Executive Summary
- 2.1. Introduction
- 3. Market Dynamics
- 3.1. Introduction
- 3.2. Market Drivers
- 3.2.1. Rising demand for Nitrochlorobenzene; Surging Application in the Chemical Industry; Other Drivers
- 3.3. Market Restrains
- 3.3.1. Detrimental Effects of Chlorobenzene Exposure; Other Restraints
- 3.4. Market Trends
- 3.4.1. Nitrochlorobenzenes to Dominate the Market
- 4. Market Factor Analysis
- 4.1. Porters Five Forces
- 4.2. Supply/Value Chain
- 4.3. PESTEL analysis
- 4.4. Market Entropy
- 4.5. Patent/Trademark Analysis
- 5. Global Chlorobenzene Industry Analysis, Insights and Forecast, 2019-2031
- 5.1. Market Analysis, Insights and Forecast - by Type
- 5.1.1. Monochlorobenzene
- 5.1.2. o-dichlorobenzene
- 5.1.3. p-dichlorobenzene
- 5.1.4. m-Dichlorobenzene
- 5.1.5. Other Types
- 5.2. Market Analysis, Insights and Forecast - by Application
- 5.2.1. Moth Control
- 5.2.2. Nitrochlorobenzenes
- 5.2.3. Polyphenylene Sulfide
- 5.2.4. Polysulfone Polymers
- 5.2.5. Solvents
- 5.2.6. Room and Sanitary Deodorants
- 5.2.7. Other Applications
- 5.3. Market Analysis, Insights and Forecast - by Region
- 5.3.1. Asia Pacific
- 5.3.2. North America
- 5.3.3. Europe
- 5.3.4. South America
- 5.3.5. Middle East
- 5.3.6. Saudi Arabia
- 5.1. Market Analysis, Insights and Forecast - by Type
- 6. Asia Pacific Chlorobenzene Industry Analysis, Insights and Forecast, 2019-2031
- 6.1. Market Analysis, Insights and Forecast - by Type
- 6.1.1. Monochlorobenzene
- 6.1.2. o-dichlorobenzene
- 6.1.3. p-dichlorobenzene
- 6.1.4. m-Dichlorobenzene
- 6.1.5. Other Types
- 6.2. Market Analysis, Insights and Forecast - by Application
- 6.2.1. Moth Control
- 6.2.2. Nitrochlorobenzenes
- 6.2.3. Polyphenylene Sulfide
- 6.2.4. Polysulfone Polymers
- 6.2.5. Solvents
- 6.2.6. Room and Sanitary Deodorants
- 6.2.7. Other Applications
- 6.1. Market Analysis, Insights and Forecast - by Type
- 7. North America Chlorobenzene Industry Analysis, Insights and Forecast, 2019-2031
- 7.1. Market Analysis, Insights and Forecast - by Type
- 7.1.1. Monochlorobenzene
- 7.1.2. o-dichlorobenzene
- 7.1.3. p-dichlorobenzene
- 7.1.4. m-Dichlorobenzene
- 7.1.5. Other Types
- 7.2. Market Analysis, Insights and Forecast - by Application
- 7.2.1. Moth Control
- 7.2.2. Nitrochlorobenzenes
- 7.2.3. Polyphenylene Sulfide
- 7.2.4. Polysulfone Polymers
- 7.2.5. Solvents
- 7.2.6. Room and Sanitary Deodorants
- 7.2.7. Other Applications
- 7.1. Market Analysis, Insights and Forecast - by Type
- 8. Europe Chlorobenzene Industry Analysis, Insights and Forecast, 2019-2031
- 8.1. Market Analysis, Insights and Forecast - by Type
- 8.1.1. Monochlorobenzene
- 8.1.2. o-dichlorobenzene
- 8.1.3. p-dichlorobenzene
- 8.1.4. m-Dichlorobenzene
- 8.1.5. Other Types
- 8.2. Market Analysis, Insights and Forecast - by Application
- 8.2.1. Moth Control
- 8.2.2. Nitrochlorobenzenes
- 8.2.3. Polyphenylene Sulfide
- 8.2.4. Polysulfone Polymers
- 8.2.5. Solvents
- 8.2.6. Room and Sanitary Deodorants
- 8.2.7. Other Applications
- 8.1. Market Analysis, Insights and Forecast - by Type
- 9. South America Chlorobenzene Industry Analysis, Insights and Forecast, 2019-2031
- 9.1. Market Analysis, Insights and Forecast - by Type
- 9.1.1. Monochlorobenzene
- 9.1.2. o-dichlorobenzene
- 9.1.3. p-dichlorobenzene
- 9.1.4. m-Dichlorobenzene
- 9.1.5. Other Types
- 9.2. Market Analysis, Insights and Forecast - by Application
- 9.2.1. Moth Control
- 9.2.2. Nitrochlorobenzenes
- 9.2.3. Polyphenylene Sulfide
- 9.2.4. Polysulfone Polymers
- 9.2.5. Solvents
- 9.2.6. Room and Sanitary Deodorants
- 9.2.7. Other Applications
- 9.1. Market Analysis, Insights and Forecast - by Type
- 10. Middle East Chlorobenzene Industry Analysis, Insights and Forecast, 2019-2031
- 10.1. Market Analysis, Insights and Forecast - by Type
- 10.1.1. Monochlorobenzene
- 10.1.2. o-dichlorobenzene
- 10.1.3. p-dichlorobenzene
- 10.1.4. m-Dichlorobenzene
- 10.1.5. Other Types
- 10.2. Market Analysis, Insights and Forecast - by Application
- 10.2.1. Moth Control
- 10.2.2. Nitrochlorobenzenes
- 10.2.3. Polyphenylene Sulfide
- 10.2.4. Polysulfone Polymers
- 10.2.5. Solvents
- 10.2.6. Room and Sanitary Deodorants
- 10.2.7. Other Applications
- 10.1. Market Analysis, Insights and Forecast - by Type
- 11. Saudi Arabia Chlorobenzene Industry Analysis, Insights and Forecast, 2019-2031
- 11.1. Market Analysis, Insights and Forecast - by Type
- 11.1.1. Monochlorobenzene
- 11.1.2. o-dichlorobenzene
- 11.1.3. p-dichlorobenzene
- 11.1.4. m-Dichlorobenzene
- 11.1.5. Other Types
- 11.2. Market Analysis, Insights and Forecast - by Application
- 11.2.1. Moth Control
- 11.2.2. Nitrochlorobenzenes
- 11.2.3. Polyphenylene Sulfide
- 11.2.4. Polysulfone Polymers
- 11.2.5. Solvents
- 11.2.6. Room and Sanitary Deodorants
- 11.2.7. Other Applications
- 11.1. Market Analysis, Insights and Forecast - by Type
- 12. North America Chlorobenzene Industry Analysis, Insights and Forecast, 2019-2031
- 12.1. Market Analysis, Insights and Forecast - By Country/Sub-region
- 12.1.1 United States
- 12.1.2 Canada
- 12.1.3 Mexico
- 13. Europe Chlorobenzene Industry Analysis, Insights and Forecast, 2019-2031
- 13.1. Market Analysis, Insights and Forecast - By Country/Sub-region
- 13.1.1 Germany
- 13.1.2 France
- 13.1.3 Italy
- 13.1.4 United Kingdom
- 13.1.5 Netherlands
- 13.1.6 Rest of Europe
- 14. Asia Pacific Chlorobenzene Industry Analysis, Insights and Forecast, 2019-2031
- 14.1. Market Analysis, Insights and Forecast - By Country/Sub-region
- 14.1.1 China
- 14.1.2 Japan
- 14.1.3 India
- 14.1.4 South Korea
- 14.1.5 Taiwan
- 14.1.6 Australia
- 14.1.7 Rest of Asia-Pacific
- 15. South America Chlorobenzene Industry Analysis, Insights and Forecast, 2019-2031
- 15.1. Market Analysis, Insights and Forecast - By Country/Sub-region
- 15.1.1 Brazil
- 15.1.2 Argentina
- 15.1.3 Rest of South America
- 16. MEA Chlorobenzene Industry Analysis, Insights and Forecast, 2019-2031
- 16.1. Market Analysis, Insights and Forecast - By Country/Sub-region
- 16.1.1 Middle East
- 16.1.2 Africa
- 17. Competitive Analysis
- 17.1. Global Market Share Analysis 2024
- 17.2. Company Profiles
- 17.2.1 Jiangsu Yangnong Chemicals Group Co Ltd
- 17.2.1.1. Overview
- 17.2.1.2. Products
- 17.2.1.3. SWOT Analysis
- 17.2.1.4. Recent Developments
- 17.2.1.5. Financials (Based on Availability)
- 17.2.2 China Petrochemical Corporation
- 17.2.2.1. Overview
- 17.2.2.2. Products
- 17.2.2.3. SWOT Analysis
- 17.2.2.4. Recent Developments
- 17.2.2.5. Financials (Based on Availability)
- 17.2.3 ITW Reagents Division (PanReac Applichem)
- 17.2.3.1. Overview
- 17.2.3.2. Products
- 17.2.3.3. SWOT Analysis
- 17.2.3.4. Recent Developments
- 17.2.3.5. Financials (Based on Availability)
- 17.2.4 J&K Scientific Ltd
- 17.2.4.1. Overview
- 17.2.4.2. Products
- 17.2.4.3. SWOT Analysis
- 17.2.4.4. Recent Developments
- 17.2.4.5. Financials (Based on Availability)
- 17.2.5 Anhui Bayi Chemical Industry
- 17.2.5.1. Overview
- 17.2.5.2. Products
- 17.2.5.3. SWOT Analysis
- 17.2.5.4. Recent Developments
- 17.2.5.5. Financials (Based on Availability)
- 17.2.6 Chemada Fine Chemicals
- 17.2.6.1. Overview
- 17.2.6.2. Products
- 17.2.6.3. SWOT Analysis
- 17.2.6.4. Recent Developments
- 17.2.6.5. Financials (Based on Availability)
- 17.2.7 Kureha Corporation
- 17.2.7.1. Overview
- 17.2.7.2. Products
- 17.2.7.3. SWOT Analysis
- 17.2.7.4. Recent Developments
- 17.2.7.5. Financials (Based on Availability)
- 17.2.8 Tianjin Bohai Chemical Industry Co Ltd
- 17.2.8.1. Overview
- 17.2.8.2. Products
- 17.2.8.3. SWOT Analysis
- 17.2.8.4. Recent Developments
- 17.2.8.5. Financials (Based on Availability)
- 17.2.9 Meryer (Shanghai) Chemical Technology Co Ltd
- 17.2.9.1. Overview
- 17.2.9.2. Products
- 17.2.9.3. SWOT Analysis
- 17.2.9.4. Recent Developments
- 17.2.9.5. Financials (Based on Availability)
- 17.2.10 Lanxess
- 17.2.10.1. Overview
- 17.2.10.2. Products
- 17.2.10.3. SWOT Analysis
- 17.2.10.4. Recent Developments
- 17.2.10.5. Financials (Based on Availability)
- 17.2.1 Jiangsu Yangnong Chemicals Group Co Ltd
List of Figures
- Figure 1: Global Chlorobenzene Industry Revenue Breakdown (Million, %) by Region 2024 & 2032
- Figure 2: Global Chlorobenzene Industry Volume Breakdown (K Tons, %) by Region 2024 & 2032
- Figure 3: North America Chlorobenzene Industry Revenue (Million), by Country 2024 & 2032
- Figure 4: North America Chlorobenzene Industry Volume (K Tons), by Country 2024 & 2032
- Figure 5: North America Chlorobenzene Industry Revenue Share (%), by Country 2024 & 2032
- Figure 6: North America Chlorobenzene Industry Volume Share (%), by Country 2024 & 2032
- Figure 7: Europe Chlorobenzene Industry Revenue (Million), by Country 2024 & 2032
- Figure 8: Europe Chlorobenzene Industry Volume (K Tons), by Country 2024 & 2032
- Figure 9: Europe Chlorobenzene Industry Revenue Share (%), by Country 2024 & 2032
- Figure 10: Europe Chlorobenzene Industry Volume Share (%), by Country 2024 & 2032
- Figure 11: Asia Pacific Chlorobenzene Industry Revenue (Million), by Country 2024 & 2032
- Figure 12: Asia Pacific Chlorobenzene Industry Volume (K Tons), by Country 2024 & 2032
- Figure 13: Asia Pacific Chlorobenzene Industry Revenue Share (%), by Country 2024 & 2032
- Figure 14: Asia Pacific Chlorobenzene Industry Volume Share (%), by Country 2024 & 2032
- Figure 15: South America Chlorobenzene Industry Revenue (Million), by Country 2024 & 2032
- Figure 16: South America Chlorobenzene Industry Volume (K Tons), by Country 2024 & 2032
- Figure 17: South America Chlorobenzene Industry Revenue Share (%), by Country 2024 & 2032
- Figure 18: South America Chlorobenzene Industry Volume Share (%), by Country 2024 & 2032
- Figure 19: MEA Chlorobenzene Industry Revenue (Million), by Country 2024 & 2032
- Figure 20: MEA Chlorobenzene Industry Volume (K Tons), by Country 2024 & 2032
- Figure 21: MEA Chlorobenzene Industry Revenue Share (%), by Country 2024 & 2032
- Figure 22: MEA Chlorobenzene Industry Volume Share (%), by Country 2024 & 2032
- Figure 23: Asia Pacific Chlorobenzene Industry Revenue (Million), by Type 2024 & 2032
- Figure 24: Asia Pacific Chlorobenzene Industry Volume (K Tons), by Type 2024 & 2032
- Figure 25: Asia Pacific Chlorobenzene Industry Revenue Share (%), by Type 2024 & 2032
- Figure 26: Asia Pacific Chlorobenzene Industry Volume Share (%), by Type 2024 & 2032
- Figure 27: Asia Pacific Chlorobenzene Industry Revenue (Million), by Application 2024 & 2032
- Figure 28: Asia Pacific Chlorobenzene Industry Volume (K Tons), by Application 2024 & 2032
- Figure 29: Asia Pacific Chlorobenzene Industry Revenue Share (%), by Application 2024 & 2032
- Figure 30: Asia Pacific Chlorobenzene Industry Volume Share (%), by Application 2024 & 2032
- Figure 31: Asia Pacific Chlorobenzene Industry Revenue (Million), by Country 2024 & 2032
- Figure 32: Asia Pacific Chlorobenzene Industry Volume (K Tons), by Country 2024 & 2032
- Figure 33: Asia Pacific Chlorobenzene Industry Revenue Share (%), by Country 2024 & 2032
- Figure 34: Asia Pacific Chlorobenzene Industry Volume Share (%), by Country 2024 & 2032
- Figure 35: North America Chlorobenzene Industry Revenue (Million), by Type 2024 & 2032
- Figure 36: North America Chlorobenzene Industry Volume (K Tons), by Type 2024 & 2032
- Figure 37: North America Chlorobenzene Industry Revenue Share (%), by Type 2024 & 2032
- Figure 38: North America Chlorobenzene Industry Volume Share (%), by Type 2024 & 2032
- Figure 39: North America Chlorobenzene Industry Revenue (Million), by Application 2024 & 2032
- Figure 40: North America Chlorobenzene Industry Volume (K Tons), by Application 2024 & 2032
- Figure 41: North America Chlorobenzene Industry Revenue Share (%), by Application 2024 & 2032
- Figure 42: North America Chlorobenzene Industry Volume Share (%), by Application 2024 & 2032
- Figure 43: North America Chlorobenzene Industry Revenue (Million), by Country 2024 & 2032
- Figure 44: North America Chlorobenzene Industry Volume (K Tons), by Country 2024 & 2032
- Figure 45: North America Chlorobenzene Industry Revenue Share (%), by Country 2024 & 2032
- Figure 46: North America Chlorobenzene Industry Volume Share (%), by Country 2024 & 2032
- Figure 47: Europe Chlorobenzene Industry Revenue (Million), by Type 2024 & 2032
- Figure 48: Europe Chlorobenzene Industry Volume (K Tons), by Type 2024 & 2032
- Figure 49: Europe Chlorobenzene Industry Revenue Share (%), by Type 2024 & 2032
- Figure 50: Europe Chlorobenzene Industry Volume Share (%), by Type 2024 & 2032
- Figure 51: Europe Chlorobenzene Industry Revenue (Million), by Application 2024 & 2032
- Figure 52: Europe Chlorobenzene Industry Volume (K Tons), by Application 2024 & 2032
- Figure 53: Europe Chlorobenzene Industry Revenue Share (%), by Application 2024 & 2032
- Figure 54: Europe Chlorobenzene Industry Volume Share (%), by Application 2024 & 2032
- Figure 55: Europe Chlorobenzene Industry Revenue (Million), by Country 2024 & 2032
- Figure 56: Europe Chlorobenzene Industry Volume (K Tons), by Country 2024 & 2032
- Figure 57: Europe Chlorobenzene Industry Revenue Share (%), by Country 2024 & 2032
- Figure 58: Europe Chlorobenzene Industry Volume Share (%), by Country 2024 & 2032
- Figure 59: South America Chlorobenzene Industry Revenue (Million), by Type 2024 & 2032
- Figure 60: South America Chlorobenzene Industry Volume (K Tons), by Type 2024 & 2032
- Figure 61: South America Chlorobenzene Industry Revenue Share (%), by Type 2024 & 2032
- Figure 62: South America Chlorobenzene Industry Volume Share (%), by Type 2024 & 2032
- Figure 63: South America Chlorobenzene Industry Revenue (Million), by Application 2024 & 2032
- Figure 64: South America Chlorobenzene Industry Volume (K Tons), by Application 2024 & 2032
- Figure 65: South America Chlorobenzene Industry Revenue Share (%), by Application 2024 & 2032
- Figure 66: South America Chlorobenzene Industry Volume Share (%), by Application 2024 & 2032
- Figure 67: South America Chlorobenzene Industry Revenue (Million), by Country 2024 & 2032
- Figure 68: South America Chlorobenzene Industry Volume (K Tons), by Country 2024 & 2032
- Figure 69: South America Chlorobenzene Industry Revenue Share (%), by Country 2024 & 2032
- Figure 70: South America Chlorobenzene Industry Volume Share (%), by Country 2024 & 2032
- Figure 71: Middle East Chlorobenzene Industry Revenue (Million), by Type 2024 & 2032
- Figure 72: Middle East Chlorobenzene Industry Volume (K Tons), by Type 2024 & 2032
- Figure 73: Middle East Chlorobenzene Industry Revenue Share (%), by Type 2024 & 2032
- Figure 74: Middle East Chlorobenzene Industry Volume Share (%), by Type 2024 & 2032
- Figure 75: Middle East Chlorobenzene Industry Revenue (Million), by Application 2024 & 2032
- Figure 76: Middle East Chlorobenzene Industry Volume (K Tons), by Application 2024 & 2032
- Figure 77: Middle East Chlorobenzene Industry Revenue Share (%), by Application 2024 & 2032
- Figure 78: Middle East Chlorobenzene Industry Volume Share (%), by Application 2024 & 2032
- Figure 79: Middle East Chlorobenzene Industry Revenue (Million), by Country 2024 & 2032
- Figure 80: Middle East Chlorobenzene Industry Volume (K Tons), by Country 2024 & 2032
- Figure 81: Middle East Chlorobenzene Industry Revenue Share (%), by Country 2024 & 2032
- Figure 82: Middle East Chlorobenzene Industry Volume Share (%), by Country 2024 & 2032
- Figure 83: Saudi Arabia Chlorobenzene Industry Revenue (Million), by Type 2024 & 2032
- Figure 84: Saudi Arabia Chlorobenzene Industry Volume (K Tons), by Type 2024 & 2032
- Figure 85: Saudi Arabia Chlorobenzene Industry Revenue Share (%), by Type 2024 & 2032
- Figure 86: Saudi Arabia Chlorobenzene Industry Volume Share (%), by Type 2024 & 2032
- Figure 87: Saudi Arabia Chlorobenzene Industry Revenue (Million), by Application 2024 & 2032
- Figure 88: Saudi Arabia Chlorobenzene Industry Volume (K Tons), by Application 2024 & 2032
- Figure 89: Saudi Arabia Chlorobenzene Industry Revenue Share (%), by Application 2024 & 2032
- Figure 90: Saudi Arabia Chlorobenzene Industry Volume Share (%), by Application 2024 & 2032
- Figure 91: Saudi Arabia Chlorobenzene Industry Revenue (Million), by Country 2024 & 2032
- Figure 92: Saudi Arabia Chlorobenzene Industry Volume (K Tons), by Country 2024 & 2032
- Figure 93: Saudi Arabia Chlorobenzene Industry Revenue Share (%), by Country 2024 & 2032
- Figure 94: Saudi Arabia Chlorobenzene Industry Volume Share (%), by Country 2024 & 2032
List of Tables
- Table 1: Global Chlorobenzene Industry Revenue Million Forecast, by Region 2019 & 2032
- Table 2: Global Chlorobenzene Industry Volume K Tons Forecast, by Region 2019 & 2032
- Table 3: Global Chlorobenzene Industry Revenue Million Forecast, by Type 2019 & 2032
- Table 4: Global Chlorobenzene Industry Volume K Tons Forecast, by Type 2019 & 2032
- Table 5: Global Chlorobenzene Industry Revenue Million Forecast, by Application 2019 & 2032
- Table 6: Global Chlorobenzene Industry Volume K Tons Forecast, by Application 2019 & 2032
- Table 7: Global Chlorobenzene Industry Revenue Million Forecast, by Region 2019 & 2032
- Table 8: Global Chlorobenzene Industry Volume K Tons Forecast, by Region 2019 & 2032
- Table 9: Global Chlorobenzene Industry Revenue Million Forecast, by Country 2019 & 2032
- Table 10: Global Chlorobenzene Industry Volume K Tons Forecast, by Country 2019 & 2032
- Table 11: United States Chlorobenzene Industry Revenue (Million) Forecast, by Application 2019 & 2032
- Table 12: United States Chlorobenzene Industry Volume (K Tons) Forecast, by Application 2019 & 2032
- Table 13: Canada Chlorobenzene Industry Revenue (Million) Forecast, by Application 2019 & 2032
- Table 14: Canada Chlorobenzene Industry Volume (K Tons) Forecast, by Application 2019 & 2032
- Table 15: Mexico Chlorobenzene Industry Revenue (Million) Forecast, by Application 2019 & 2032
- Table 16: Mexico Chlorobenzene Industry Volume (K Tons) Forecast, by Application 2019 & 2032
- Table 17: Global Chlorobenzene Industry Revenue Million Forecast, by Country 2019 & 2032
- Table 18: Global Chlorobenzene Industry Volume K Tons Forecast, by Country 2019 & 2032
- Table 19: Germany Chlorobenzene Industry Revenue (Million) Forecast, by Application 2019 & 2032
- Table 20: Germany Chlorobenzene Industry Volume (K Tons) Forecast, by Application 2019 & 2032
- Table 21: France Chlorobenzene Industry Revenue (Million) Forecast, by Application 2019 & 2032
- Table 22: France Chlorobenzene Industry Volume (K Tons) Forecast, by Application 2019 & 2032
- Table 23: Italy Chlorobenzene Industry Revenue (Million) Forecast, by Application 2019 & 2032
- Table 24: Italy Chlorobenzene Industry Volume (K Tons) Forecast, by Application 2019 & 2032
- Table 25: United Kingdom Chlorobenzene Industry Revenue (Million) Forecast, by Application 2019 & 2032
- Table 26: United Kingdom Chlorobenzene Industry Volume (K Tons) Forecast, by Application 2019 & 2032
- Table 27: Netherlands Chlorobenzene Industry Revenue (Million) Forecast, by Application 2019 & 2032
- Table 28: Netherlands Chlorobenzene Industry Volume (K Tons) Forecast, by Application 2019 & 2032
- Table 29: Rest of Europe Chlorobenzene Industry Revenue (Million) Forecast, by Application 2019 & 2032
- Table 30: Rest of Europe Chlorobenzene Industry Volume (K Tons) Forecast, by Application 2019 & 2032
- Table 31: Global Chlorobenzene Industry Revenue Million Forecast, by Country 2019 & 2032
- Table 32: Global Chlorobenzene Industry Volume K Tons Forecast, by Country 2019 & 2032
- Table 33: China Chlorobenzene Industry Revenue (Million) Forecast, by Application 2019 & 2032
- Table 34: China Chlorobenzene Industry Volume (K Tons) Forecast, by Application 2019 & 2032
- Table 35: Japan Chlorobenzene Industry Revenue (Million) Forecast, by Application 2019 & 2032
- Table 36: Japan Chlorobenzene Industry Volume (K Tons) Forecast, by Application 2019 & 2032
- Table 37: India Chlorobenzene Industry Revenue (Million) Forecast, by Application 2019 & 2032
- Table 38: India Chlorobenzene Industry Volume (K Tons) Forecast, by Application 2019 & 2032
- Table 39: South Korea Chlorobenzene Industry Revenue (Million) Forecast, by Application 2019 & 2032
- Table 40: South Korea Chlorobenzene Industry Volume (K Tons) Forecast, by Application 2019 & 2032
- Table 41: Taiwan Chlorobenzene Industry Revenue (Million) Forecast, by Application 2019 & 2032
- Table 42: Taiwan Chlorobenzene Industry Volume (K Tons) Forecast, by Application 2019 & 2032
- Table 43: Australia Chlorobenzene Industry Revenue (Million) Forecast, by Application 2019 & 2032
- Table 44: Australia Chlorobenzene Industry Volume (K Tons) Forecast, by Application 2019 & 2032
- Table 45: Rest of Asia-Pacific Chlorobenzene Industry Revenue (Million) Forecast, by Application 2019 & 2032
- Table 46: Rest of Asia-Pacific Chlorobenzene Industry Volume (K Tons) Forecast, by Application 2019 & 2032
- Table 47: Global Chlorobenzene Industry Revenue Million Forecast, by Country 2019 & 2032
- Table 48: Global Chlorobenzene Industry Volume K Tons Forecast, by Country 2019 & 2032
- Table 49: Brazil Chlorobenzene Industry Revenue (Million) Forecast, by Application 2019 & 2032
- Table 50: Brazil Chlorobenzene Industry Volume (K Tons) Forecast, by Application 2019 & 2032
- Table 51: Argentina Chlorobenzene Industry Revenue (Million) Forecast, by Application 2019 & 2032
- Table 52: Argentina Chlorobenzene Industry Volume (K Tons) Forecast, by Application 2019 & 2032
- Table 53: Rest of South America Chlorobenzene Industry Revenue (Million) Forecast, by Application 2019 & 2032
- Table 54: Rest of South America Chlorobenzene Industry Volume (K Tons) Forecast, by Application 2019 & 2032
- Table 55: Global Chlorobenzene Industry Revenue Million Forecast, by Country 2019 & 2032
- Table 56: Global Chlorobenzene Industry Volume K Tons Forecast, by Country 2019 & 2032
- Table 57: Middle East Chlorobenzene Industry Revenue (Million) Forecast, by Application 2019 & 2032
- Table 58: Middle East Chlorobenzene Industry Volume (K Tons) Forecast, by Application 2019 & 2032
- Table 59: Africa Chlorobenzene Industry Revenue (Million) Forecast, by Application 2019 & 2032
- Table 60: Africa Chlorobenzene Industry Volume (K Tons) Forecast, by Application 2019 & 2032
- Table 61: Global Chlorobenzene Industry Revenue Million Forecast, by Type 2019 & 2032
- Table 62: Global Chlorobenzene Industry Volume K Tons Forecast, by Type 2019 & 2032
- Table 63: Global Chlorobenzene Industry Revenue Million Forecast, by Application 2019 & 2032
- Table 64: Global Chlorobenzene Industry Volume K Tons Forecast, by Application 2019 & 2032
- Table 65: Global Chlorobenzene Industry Revenue Million Forecast, by Country 2019 & 2032
- Table 66: Global Chlorobenzene Industry Volume K Tons Forecast, by Country 2019 & 2032
- Table 67: China Chlorobenzene Industry Revenue (Million) Forecast, by Application 2019 & 2032
- Table 68: China Chlorobenzene Industry Volume (K Tons) Forecast, by Application 2019 & 2032
- Table 69: India Chlorobenzene Industry Revenue (Million) Forecast, by Application 2019 & 2032
- Table 70: India Chlorobenzene Industry Volume (K Tons) Forecast, by Application 2019 & 2032
- Table 71: Japan Chlorobenzene Industry Revenue (Million) Forecast, by Application 2019 & 2032
- Table 72: Japan Chlorobenzene Industry Volume (K Tons) Forecast, by Application 2019 & 2032
- Table 73: South Korea Chlorobenzene Industry Revenue (Million) Forecast, by Application 2019 & 2032
- Table 74: South Korea Chlorobenzene Industry Volume (K Tons) Forecast, by Application 2019 & 2032
- Table 75: Malaysia Chlorobenzene Industry Revenue (Million) Forecast, by Application 2019 & 2032
- Table 76: Malaysia Chlorobenzene Industry Volume (K Tons) Forecast, by Application 2019 & 2032
- Table 77: Thailand Chlorobenzene Industry Revenue (Million) Forecast, by Application 2019 & 2032
- Table 78: Thailand Chlorobenzene Industry Volume (K Tons) Forecast, by Application 2019 & 2032
- Table 79: Indonesia Chlorobenzene Industry Revenue (Million) Forecast, by Application 2019 & 2032
- Table 80: Indonesia Chlorobenzene Industry Volume (K Tons) Forecast, by Application 2019 & 2032
- Table 81: Vietnam Chlorobenzene Industry Revenue (Million) Forecast, by Application 2019 & 2032
- Table 82: Vietnam Chlorobenzene Industry Volume (K Tons) Forecast, by Application 2019 & 2032
- Table 83: Rest of Asia Pacific Chlorobenzene Industry Revenue (Million) Forecast, by Application 2019 & 2032
- Table 84: Rest of Asia Pacific Chlorobenzene Industry Volume (K Tons) Forecast, by Application 2019 & 2032
- Table 85: Global Chlorobenzene Industry Revenue Million Forecast, by Type 2019 & 2032
- Table 86: Global Chlorobenzene Industry Volume K Tons Forecast, by Type 2019 & 2032
- Table 87: Global Chlorobenzene Industry Revenue Million Forecast, by Application 2019 & 2032
- Table 88: Global Chlorobenzene Industry Volume K Tons Forecast, by Application 2019 & 2032
- Table 89: Global Chlorobenzene Industry Revenue Million Forecast, by Country 2019 & 2032
- Table 90: Global Chlorobenzene Industry Volume K Tons Forecast, by Country 2019 & 2032
- Table 91: United States Chlorobenzene Industry Revenue (Million) Forecast, by Application 2019 & 2032
- Table 92: United States Chlorobenzene Industry Volume (K Tons) Forecast, by Application 2019 & 2032
- Table 93: Canada Chlorobenzene Industry Revenue (Million) Forecast, by Application 2019 & 2032
- Table 94: Canada Chlorobenzene Industry Volume (K Tons) Forecast, by Application 2019 & 2032
- Table 95: Mexico Chlorobenzene Industry Revenue (Million) Forecast, by Application 2019 & 2032
- Table 96: Mexico Chlorobenzene Industry Volume (K Tons) Forecast, by Application 2019 & 2032
- Table 97: Global Chlorobenzene Industry Revenue Million Forecast, by Type 2019 & 2032
- Table 98: Global Chlorobenzene Industry Volume K Tons Forecast, by Type 2019 & 2032
- Table 99: Global Chlorobenzene Industry Revenue Million Forecast, by Application 2019 & 2032
- Table 100: Global Chlorobenzene Industry Volume K Tons Forecast, by Application 2019 & 2032
- Table 101: Global Chlorobenzene Industry Revenue Million Forecast, by Country 2019 & 2032
- Table 102: Global Chlorobenzene Industry Volume K Tons Forecast, by Country 2019 & 2032
- Table 103: Germany Chlorobenzene Industry Revenue (Million) Forecast, by Application 2019 & 2032
- Table 104: Germany Chlorobenzene Industry Volume (K Tons) Forecast, by Application 2019 & 2032
- Table 105: United Kingdom Chlorobenzene Industry Revenue (Million) Forecast, by Application 2019 & 2032
- Table 106: United Kingdom Chlorobenzene Industry Volume (K Tons) Forecast, by Application 2019 & 2032
- Table 107: France Chlorobenzene Industry Revenue (Million) Forecast, by Application 2019 & 2032
- Table 108: France Chlorobenzene Industry Volume (K Tons) Forecast, by Application 2019 & 2032
- Table 109: Italy Chlorobenzene Industry Revenue (Million) Forecast, by Application 2019 & 2032
- Table 110: Italy Chlorobenzene Industry Volume (K Tons) Forecast, by Application 2019 & 2032
- Table 111: Spain Chlorobenzene Industry Revenue (Million) Forecast, by Application 2019 & 2032
- Table 112: Spain Chlorobenzene Industry Volume (K Tons) Forecast, by Application 2019 & 2032
- Table 113: Nordic Chlorobenzene Industry Revenue (Million) Forecast, by Application 2019 & 2032
- Table 114: Nordic Chlorobenzene Industry Volume (K Tons) Forecast, by Application 2019 & 2032
- Table 115: Turkey Chlorobenzene Industry Revenue (Million) Forecast, by Application 2019 & 2032
- Table 116: Turkey Chlorobenzene Industry Volume (K Tons) Forecast, by Application 2019 & 2032
- Table 117: Russia Chlorobenzene Industry Revenue (Million) Forecast, by Application 2019 & 2032
- Table 118: Russia Chlorobenzene Industry Volume (K Tons) Forecast, by Application 2019 & 2032
- Table 119: Rest of Europe Chlorobenzene Industry Revenue (Million) Forecast, by Application 2019 & 2032
- Table 120: Rest of Europe Chlorobenzene Industry Volume (K Tons) Forecast, by Application 2019 & 2032
- Table 121: Global Chlorobenzene Industry Revenue Million Forecast, by Type 2019 & 2032
- Table 122: Global Chlorobenzene Industry Volume K Tons Forecast, by Type 2019 & 2032
- Table 123: Global Chlorobenzene Industry Revenue Million Forecast, by Application 2019 & 2032
- Table 124: Global Chlorobenzene Industry Volume K Tons Forecast, by Application 2019 & 2032
- Table 125: Global Chlorobenzene Industry Revenue Million Forecast, by Country 2019 & 2032
- Table 126: Global Chlorobenzene Industry Volume K Tons Forecast, by Country 2019 & 2032
- Table 127: Brazil Chlorobenzene Industry Revenue (Million) Forecast, by Application 2019 & 2032
- Table 128: Brazil Chlorobenzene Industry Volume (K Tons) Forecast, by Application 2019 & 2032
- Table 129: Argentina Chlorobenzene Industry Revenue (Million) Forecast, by Application 2019 & 2032
- Table 130: Argentina Chlorobenzene Industry Volume (K Tons) Forecast, by Application 2019 & 2032
- Table 131: Colombia Chlorobenzene Industry Revenue (Million) Forecast, by Application 2019 & 2032
- Table 132: Colombia Chlorobenzene Industry Volume (K Tons) Forecast, by Application 2019 & 2032
- Table 133: Rest of South America Chlorobenzene Industry Revenue (Million) Forecast, by Application 2019 & 2032
- Table 134: Rest of South America Chlorobenzene Industry Volume (K Tons) Forecast, by Application 2019 & 2032
- Table 135: Global Chlorobenzene Industry Revenue Million Forecast, by Type 2019 & 2032
- Table 136: Global Chlorobenzene Industry Volume K Tons Forecast, by Type 2019 & 2032
- Table 137: Global Chlorobenzene Industry Revenue Million Forecast, by Application 2019 & 2032
- Table 138: Global Chlorobenzene Industry Volume K Tons Forecast, by Application 2019 & 2032
- Table 139: Global Chlorobenzene Industry Revenue Million Forecast, by Country 2019 & 2032
- Table 140: Global Chlorobenzene Industry Volume K Tons Forecast, by Country 2019 & 2032
- Table 141: Global Chlorobenzene Industry Revenue Million Forecast, by Type 2019 & 2032
- Table 142: Global Chlorobenzene Industry Volume K Tons Forecast, by Type 2019 & 2032
- Table 143: Global Chlorobenzene Industry Revenue Million Forecast, by Application 2019 & 2032
- Table 144: Global Chlorobenzene Industry Volume K Tons Forecast, by Application 2019 & 2032
- Table 145: Global Chlorobenzene Industry Revenue Million Forecast, by Country 2019 & 2032
- Table 146: Global Chlorobenzene Industry Volume K Tons Forecast, by Country 2019 & 2032
- Table 147: South Africa Chlorobenzene Industry Revenue (Million) Forecast, by Application 2019 & 2032
- Table 148: South Africa Chlorobenzene Industry Volume (K Tons) Forecast, by Application 2019 & 2032
- Table 149: Nigeria Chlorobenzene Industry Revenue (Million) Forecast, by Application 2019 & 2032
- Table 150: Nigeria Chlorobenzene Industry Volume (K Tons) Forecast, by Application 2019 & 2032
- Table 151: Qatar Chlorobenzene Industry Revenue (Million) Forecast, by Application 2019 & 2032
- Table 152: Qatar Chlorobenzene Industry Volume (K Tons) Forecast, by Application 2019 & 2032
- Table 153: Egypt Chlorobenzene Industry Revenue (Million) Forecast, by Application 2019 & 2032
- Table 154: Egypt Chlorobenzene Industry Volume (K Tons) Forecast, by Application 2019 & 2032
- Table 155: United Arab Emirates Chlorobenzene Industry Revenue (Million) Forecast, by Application 2019 & 2032
- Table 156: United Arab Emirates Chlorobenzene Industry Volume (K Tons) Forecast, by Application 2019 & 2032
- Table 157: Rest of Middle East Chlorobenzene Industry Revenue (Million) Forecast, by Application 2019 & 2032
- Table 158: Rest of Middle East Chlorobenzene Industry Volume (K Tons) Forecast, by Application 2019 & 2032
Frequently Asked Questions
1. What is the projected Compound Annual Growth Rate (CAGR) of the Chlorobenzene Industry?
The projected CAGR is approximately 5.7%.
2. Which companies are prominent players in the Chlorobenzene Industry?
Key companies in the market include Jiangsu Yangnong Chemicals Group Co Ltd, China Petrochemical Corporation, ITW Reagents Division (PanReac Applichem), J&K Scientific Ltd, Anhui Bayi Chemical Industry, Chemada Fine Chemicals, Kureha Corporation, Tianjin Bohai Chemical Industry Co Ltd , Meryer (Shanghai) Chemical Technology Co Ltd, Lanxess.
3. What are the main segments of the Chlorobenzene Industry?
The market segments include Type, Application.
4. Can you provide details about the market size?
The market size is estimated to be USD 3,146.5 Million as of 2022.
5. What are some drivers contributing to market growth?
Rising demand for Nitrochlorobenzene; Surging Application in the Chemical Industry; Other Drivers.
6. What are the notable trends driving market growth?
Nitrochlorobenzenes to Dominate the Market.
7. Are there any restraints impacting market growth?
Detrimental Effects of Chlorobenzene Exposure; Other Restraints.
8. Can you provide examples of recent developments in the market?
N/A
9. What pricing options are available for accessing the report?
Pricing options include single-user, multi-user, and enterprise licenses priced at USD 4750, USD 5250, and USD 8750 respectively.
10. Is the market size provided in terms of value or volume?
The market size is provided in terms of value, measured in Million and volume, measured in K Tons.
11. Are there any specific market keywords associated with the report?
Yes, the market keyword associated with the report is "Chlorobenzene Industry," which aids in identifying and referencing the specific market segment covered.
12. How do I determine which pricing option suits my needs best?
The pricing options vary based on user requirements and access needs. Individual users may opt for single-user licenses, while businesses requiring broader access may choose multi-user or enterprise licenses for cost-effective access to the report.
13. Are there any additional resources or data provided in the Chlorobenzene Industry report?
While the report offers comprehensive insights, it's advisable to review the specific contents or supplementary materials provided to ascertain if additional resources or data are available.
14. How can I stay updated on further developments or reports in the Chlorobenzene Industry?
To stay informed about further developments, trends, and reports in the Chlorobenzene Industry, consider subscribing to industry newsletters, following relevant companies and organizations, or regularly checking reputable industry news sources and publications.
Methodology
Step 1 - Identification of Relevant Samples Size from Population Database


Step 2 - Approaches for Defining Global Market Size (Value, Volume* & Price*)

Note*: In applicable scenarios
Step 3 - Data Sources
Primary Research
- Web Analytics
- Survey Reports
- Research Institute
- Latest Research Reports
- Opinion Leaders
Secondary Research
- Annual Reports
- White Paper
- Latest Press Release
- Industry Association
- Paid Database
- Investor Presentations

Step 4 - Data Triangulation
Involves using different sources of information in order to increase the validity of a study
These sources are likely to be stakeholders in a program - participants, other researchers, program staff, other community members, and so on.
Then we put all data in single framework & apply various statistical tools to find out the dynamic on the market.
During the analysis stage, feedback from the stakeholder groups would be compared to determine areas of agreement as well as areas of divergence


