
Key Insights
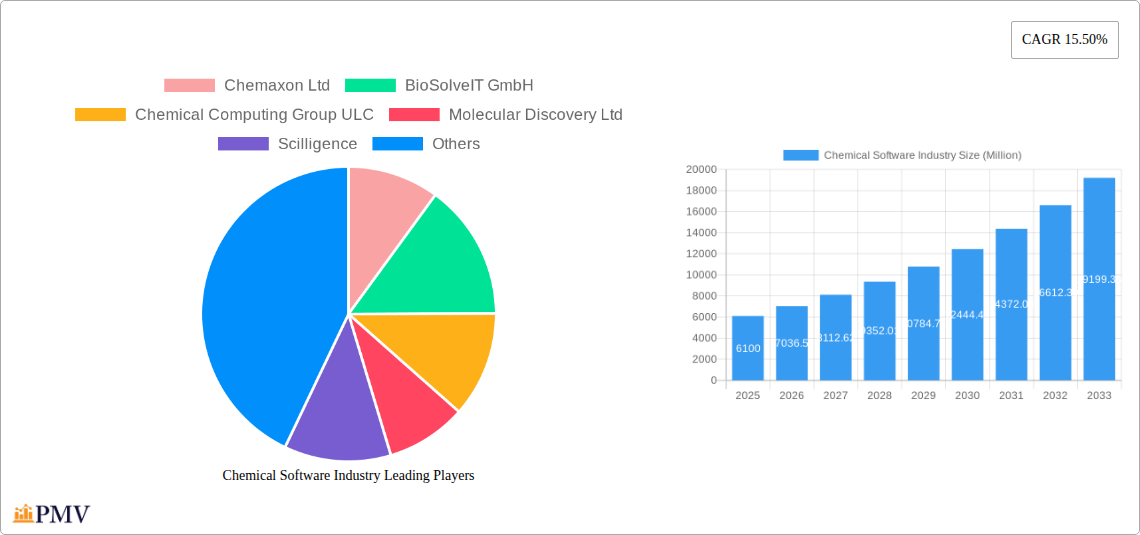
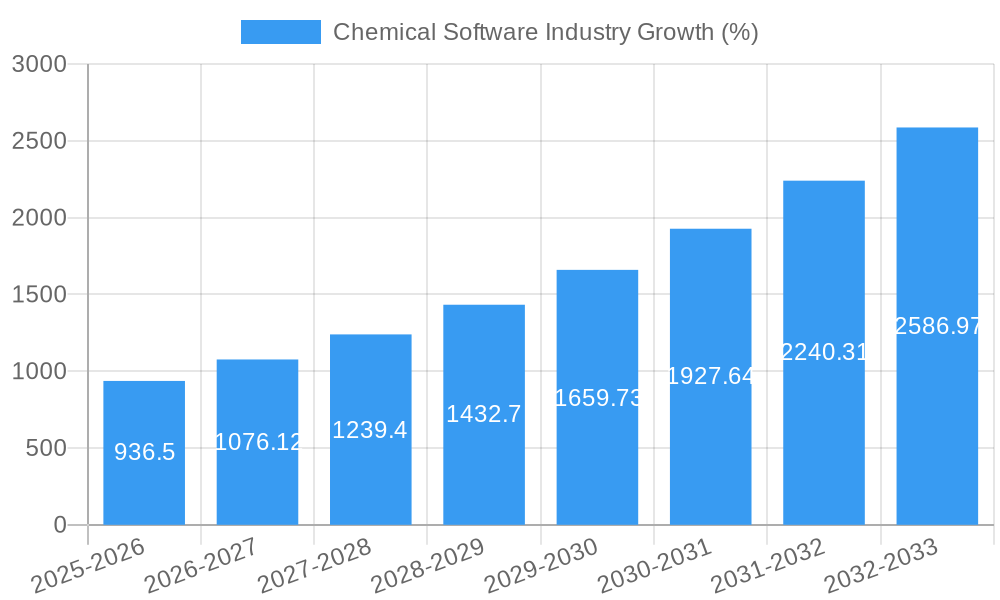
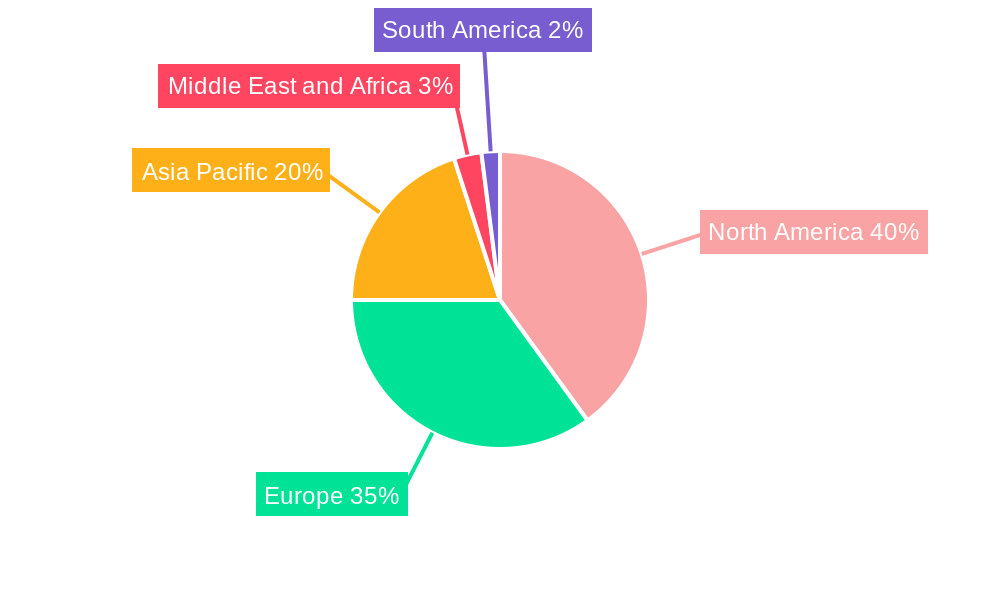
The Chemical Software market, valued at $6.10 billion in 2025, is projected to experience robust growth, exhibiting a Compound Annual Growth Rate (CAGR) of 15.5% from 2025 to 2033. This expansion is fueled by several key drivers. The increasing complexity of chemical research and development necessitates sophisticated software solutions for tasks such as molecular modeling, simulation, and data analysis. Pharmaceutical companies and research institutions are heavily investing in these technologies to accelerate drug discovery and optimize chemical processes, leading to significant market demand. Furthermore, the growing adoption of cloud-based solutions and artificial intelligence (AI) within the chemical industry is boosting efficiency and accessibility, fostering further market growth. The market is segmented by application, with chemical analysis, drug discovery and validation, and virtual screening being prominent areas. Key players such as Chemaxon, BioSolveIT, and Schrödinger are driving innovation through advanced algorithms and user-friendly interfaces. Geographic expansion is also a significant factor, with North America and Europe currently holding substantial market shares but significant growth potential existing in the Asia-Pacific region due to increasing research and development activities in countries like China and India.
The restraints on market growth primarily include the high cost of advanced software licenses and the need for specialized expertise to effectively utilize these tools. However, the long-term benefits of improved efficiency, reduced experimental costs, and accelerated product development are overcoming these challenges. The market's future trajectory suggests continued strong growth driven by technological advancements such as enhanced AI capabilities, improved integration with experimental data, and broader adoption across various chemical industries beyond pharmaceuticals, encompassing materials science and environmental chemistry. The competitive landscape is characterized by both established players and emerging startups offering specialized solutions, resulting in ongoing innovation and expanding market offerings. This dynamic market is likely to see further consolidation and strategic partnerships in the coming years.
This comprehensive report provides an in-depth analysis of the Chemical Software Industry, covering market structure, competitive dynamics, key trends, dominant segments, and future growth prospects. The report covers the period 2019-2033, with a focus on the forecast period 2025-2033 and a base year of 2025. The market size is valued in Millions USD.
Chemical Software Industry Market Structure & Competitive Dynamics
The Chemical Software Industry is characterized by a moderately concentrated market structure with several key players holding significant market share. The market's competitive landscape is dynamic, driven by continuous innovation, strategic mergers and acquisitions (M&A), and evolving regulatory frameworks. Leading players like Schrödinger Inc. and Dassault Systèmes hold substantial market share, estimated at xx% and xx%, respectively, in 2025. Smaller players, such as Chemaxon Ltd and BioSolveIT GmbH, focus on niche applications and innovative solutions to maintain a competitive edge. The industry witnesses a robust innovation ecosystem with frequent product launches and software updates, reflecting the need for enhanced functionalities and computational power. Regulatory frameworks, including data privacy regulations and intellectual property rights, significantly influence market operations. Product substitution is limited due to the specialized nature of chemical software; however, open-source alternatives are emerging, posing a potential challenge to established players. End-user trends, particularly toward cloud-based solutions and AI-driven functionalities, are shaping product development strategies.
M&A activities remain a key growth driver, with significant deals like the October 2023 agreement between Pfizer Inc. and Cadence Molecular Sciences (OpenEye) showcasing industry consolidation and strategic partnerships. While precise M&A deal values are confidential in many cases, the overall value of deals in the past 5 years is estimated to be in the range of $xx Million. Key factors driving M&A include expansion into new markets, acquisition of specialized technologies, and strengthening competitive positions.
Chemical Software Industry Industry Trends & Insights
The Chemical Software Industry is experiencing robust growth, driven by several key factors. The global market is projected to register a Compound Annual Growth Rate (CAGR) of xx% during the forecast period (2025-2033), reaching a market value of $xx Million by 2033. Technological advancements, particularly in artificial intelligence (AI) and machine learning (ML), are significantly impacting the industry. AI-powered solutions are enhancing drug discovery processes, accelerating virtual screening, and improving the accuracy of chemical analysis. Increasing demand for efficient and cost-effective solutions from pharmaceutical and chemical companies is further driving market growth. Market penetration of cloud-based chemical software solutions is increasing, driven by improved accessibility, scalability, and cost-effectiveness. Competitive dynamics, including product innovation and strategic partnerships, fuel continuous improvements in software capabilities and functionalities. The growing adoption of advanced technologies like high-performance computing (HPC) is boosting computational power and enabling simulations of complex chemical systems. Consumer preferences are shifting toward user-friendly interfaces and integrated platforms, pushing developers to enhance software usability and offer better support.
Dominant Markets & Segments in Chemical Software Industry
The North American region currently dominates the Chemical Software Industry, accounting for approximately xx% of the global market in 2025. This dominance is primarily attributed to the high concentration of pharmaceutical and biotechnology companies, coupled with robust research and development investments. Europe follows as a significant market, driven by strong government support for scientific research and a well-established chemical industry.
Key Drivers of North American Dominance:
- Strong presence of pharmaceutical and biotech companies.
- High R&D spending in the life sciences sector.
- Favorable regulatory environment.
- Developed IT infrastructure.
Key Drivers of European Market Growth:
- Government support for scientific research and innovation.
- Established chemical and pharmaceutical industries.
- Focus on sustainable chemistry initiatives.
Segment Analysis:
Drug Discovery and Validation is the largest segment in the Chemical Software market, holding approximately xx% of the market share in 2025. This dominance reflects the critical role of chemical software in accelerating drug development processes and reducing costs. The Virtual Screening segment is experiencing rapid growth, fueled by the increasing adoption of AI-powered tools for early-stage drug discovery. Chemical Analysis software, while a substantial segment, shows slower growth compared to other segments due to the maturity of the technology. Other Applications, a segment encompassing diverse industries, offers significant potential for growth as adoption expands.
Chemical Software Industry Product Innovations
Recent years have witnessed significant advancements in chemical software, with a clear trend toward integrated platforms incorporating AI, machine learning, and high-performance computing. New products boast improved user interfaces, enhanced predictive capabilities, and streamlined workflows. Companies are increasingly focusing on delivering cloud-based solutions to increase accessibility and scalability. This innovation enhances efficiency and reduces the computational costs associated with complex chemical simulations and analyses. This addresses the growing demand for faster, more accurate results across various applications.
Report Segmentation & Scope
The report segments the Chemical Software market based on application:
Chemical Analysis: This segment includes software used for various analytical techniques like spectroscopy, chromatography, and mass spectrometry. Market size in 2025 is estimated at $xx Million, with projected growth at a CAGR of xx% during the forecast period. The market is moderately competitive, with several established players.
Drug Discovery and Validation: This segment focuses on software applications for drug discovery, including molecular modeling, virtual screening, and ADMET prediction. The market size in 2025 is estimated at $xx Million, with a projected CAGR of xx% driven by advancements in AI and high-throughput screening techniques. The segment demonstrates high competitive intensity due to the rapid innovation rate.
Virtual Screening: This segment includes software for identifying potential drug candidates from large chemical libraries. The market size is estimated at $xx Million in 2025, with a significant growth outlook, driven by the increasing adoption of AI and machine learning techniques. This segment witnesses intense competition among innovative players.
Other Applications: This segment encompasses various applications including material science, environmental chemistry, and process chemistry. The market size in 2025 is estimated at $xx Million and is expected to grow steadily over the forecast period. The competitive intensity is relatively lower due to the diverse and niche nature of the applications.
Key Drivers of Chemical Software Industry Growth
The Chemical Software Industry's growth is driven by several factors: the increasing adoption of AI and machine learning for drug discovery and materials science; growing demand for efficient and cost-effective solutions from pharmaceutical and chemical companies; advancements in high-performance computing, enabling complex simulations; and rising government funding for research and development in the life sciences. Regulatory changes focused on accelerating drug development also contribute to market growth.
Challenges in the Chemical Software Industry Sector
The industry faces challenges such as the high cost of software development and maintenance; the need for specialized expertise to operate and interpret results; the intense competition among existing players; and the increasing reliance on high-performance computing resources. The evolving regulatory landscape adds complexity, demanding ongoing compliance updates. Data security and intellectual property protection remain critical concerns, influencing software development strategies and operational processes. Finally, market acceptance of innovative technologies can pose a challenge.
Leading Players in the Chemical Software Industry Market
- Chemaxon Ltd
- BioSolveIT GmbH
- Chemical Computing Group ULC
- Molecular Discovery Ltd
- Scilligence
- Collaborative Drug Discovery Inc
- Jubilant Biosys Ltd
- Cadence Design Systems Inc (OpenEye Scientific Software Inc)
- Schrödinger Inc
- Dassault Systèmes
Key Developments in Chemical Software Industry Sector
- October 2023: Cadence Molecular Sciences (OpenEye) announced an extended agreement with Pfizer Inc. for access to Cadence's molecular design software. This highlights the increasing reliance on AI-driven solutions in pharmaceutical development.
- June 2023: Vox Biomedical received funding to develop an AI-based chemical identification library using GC-DMS technology. This underscores the growing importance of AI in chemical analysis and environmental monitoring.
Strategic Chemical Software Industry Market Outlook
The Chemical Software Industry is poised for continued growth, driven by technological advancements, increasing demand from various sectors, and ongoing R&D investments. Strategic opportunities lie in developing AI-powered solutions for specific applications, expanding into emerging markets, and forging strategic partnerships to enhance market reach. Companies focusing on user-friendly interfaces and integrated platforms are well-positioned to capture significant market share. The future of the industry is intertwined with advancements in AI, machine learning, and high-performance computing, paving the way for further innovation and market expansion.
Chemical Software Industry Segmentation
-
1. Application
-
1.1. Chemical Analysis
- 1.1.1. Chemical Databases
- 1.1.2. Chemometrics
- 1.1.3. Molecular Modelling
- 1.1.4. Other Chemical Analysis
- 1.2. Drug Discovery and Validation
- 1.3. Virtual Screening
- 1.4. Other Applications
-
1.1. Chemical Analysis
Chemical Software Industry Segmentation By Geography
-
1. North America
- 1.1. United States
- 1.2. Canada
- 1.3. Mexico
-
2. Europe
- 2.1. Germany
- 2.2. United Kingdom
- 2.3. France
- 2.4. Italy
- 2.5. Spain
- 2.6. Rest of Europe
-
3. Asia Pacific
- 3.1. China
- 3.2. Japan
- 3.3. India
- 3.4. Australia
- 3.5. South Korea
- 3.6. Rest of Asia Pacific
-
4. Middle East and Africa
- 4.1. GCC
- 4.2. South Africa
- 4.3. Rest of Middle East and Africa
-
5. South America
- 5.1. Brazil
- 5.2. Argentina
- 5.3. Rest of South America
Chemical Software Industry REPORT HIGHLIGHTS
| Aspects | Details |
|---|---|
| Study Period | 2019-2033 |
| Base Year | 2024 |
| Estimated Year | 2025 |
| Forecast Period | 2025-2033 |
| Historical Period | 2019-2024 |
| Growth Rate | CAGR of 15.50% from 2019-2033 |
| Segmentation |
|
Table of Contents
- 1. Introduction
- 1.1. Research Scope
- 1.2. Market Segmentation
- 1.3. Research Methodology
- 1.4. Definitions and Assumptions
- 2. Executive Summary
- 2.1. Introduction
- 3. Market Dynamics
- 3.1. Introduction
- 3.2. Market Drivers
- 3.2.1. Innovations and Advancements in the Drug Development Process; Increased Demand of Personalized Medicine
- 3.3. Market Restrains
- 3.3.1. Lack of Skilled Labors
- 3.4. Market Trends
- 3.4.1. Virtual Screening Segment is Expected to Witness Growth in the Market Over the Forecast Period
- 4. Market Factor Analysis
- 4.1. Porters Five Forces
- 4.2. Supply/Value Chain
- 4.3. PESTEL analysis
- 4.4. Market Entropy
- 4.5. Patent/Trademark Analysis
- 5. Global Chemical Software Industry Analysis, Insights and Forecast, 2019-2031
- 5.1. Market Analysis, Insights and Forecast - by Application
- 5.1.1. Chemical Analysis
- 5.1.1.1. Chemical Databases
- 5.1.1.2. Chemometrics
- 5.1.1.3. Molecular Modelling
- 5.1.1.4. Other Chemical Analysis
- 5.1.2. Drug Discovery and Validation
- 5.1.3. Virtual Screening
- 5.1.4. Other Applications
- 5.1.1. Chemical Analysis
- 5.2. Market Analysis, Insights and Forecast - by Region
- 5.2.1. North America
- 5.2.2. Europe
- 5.2.3. Asia Pacific
- 5.2.4. Middle East and Africa
- 5.2.5. South America
- 5.1. Market Analysis, Insights and Forecast - by Application
- 6. North America Chemical Software Industry Analysis, Insights and Forecast, 2019-2031
- 6.1. Market Analysis, Insights and Forecast - by Application
- 6.1.1. Chemical Analysis
- 6.1.1.1. Chemical Databases
- 6.1.1.2. Chemometrics
- 6.1.1.3. Molecular Modelling
- 6.1.1.4. Other Chemical Analysis
- 6.1.2. Drug Discovery and Validation
- 6.1.3. Virtual Screening
- 6.1.4. Other Applications
- 6.1.1. Chemical Analysis
- 6.1. Market Analysis, Insights and Forecast - by Application
- 7. Europe Chemical Software Industry Analysis, Insights and Forecast, 2019-2031
- 7.1. Market Analysis, Insights and Forecast - by Application
- 7.1.1. Chemical Analysis
- 7.1.1.1. Chemical Databases
- 7.1.1.2. Chemometrics
- 7.1.1.3. Molecular Modelling
- 7.1.1.4. Other Chemical Analysis
- 7.1.2. Drug Discovery and Validation
- 7.1.3. Virtual Screening
- 7.1.4. Other Applications
- 7.1.1. Chemical Analysis
- 7.1. Market Analysis, Insights and Forecast - by Application
- 8. Asia Pacific Chemical Software Industry Analysis, Insights and Forecast, 2019-2031
- 8.1. Market Analysis, Insights and Forecast - by Application
- 8.1.1. Chemical Analysis
- 8.1.1.1. Chemical Databases
- 8.1.1.2. Chemometrics
- 8.1.1.3. Molecular Modelling
- 8.1.1.4. Other Chemical Analysis
- 8.1.2. Drug Discovery and Validation
- 8.1.3. Virtual Screening
- 8.1.4. Other Applications
- 8.1.1. Chemical Analysis
- 8.1. Market Analysis, Insights and Forecast - by Application
- 9. Middle East and Africa Chemical Software Industry Analysis, Insights and Forecast, 2019-2031
- 9.1. Market Analysis, Insights and Forecast - by Application
- 9.1.1. Chemical Analysis
- 9.1.1.1. Chemical Databases
- 9.1.1.2. Chemometrics
- 9.1.1.3. Molecular Modelling
- 9.1.1.4. Other Chemical Analysis
- 9.1.2. Drug Discovery and Validation
- 9.1.3. Virtual Screening
- 9.1.4. Other Applications
- 9.1.1. Chemical Analysis
- 9.1. Market Analysis, Insights and Forecast - by Application
- 10. South America Chemical Software Industry Analysis, Insights and Forecast, 2019-2031
- 10.1. Market Analysis, Insights and Forecast - by Application
- 10.1.1. Chemical Analysis
- 10.1.1.1. Chemical Databases
- 10.1.1.2. Chemometrics
- 10.1.1.3. Molecular Modelling
- 10.1.1.4. Other Chemical Analysis
- 10.1.2. Drug Discovery and Validation
- 10.1.3. Virtual Screening
- 10.1.4. Other Applications
- 10.1.1. Chemical Analysis
- 10.1. Market Analysis, Insights and Forecast - by Application
- 11. North America Chemical Software Industry Analysis, Insights and Forecast, 2019-2031
- 11.1. Market Analysis, Insights and Forecast - By Country/Sub-region
- 11.1.1 United States
- 11.1.2 Canada
- 11.1.3 Mexico
- 12. Europe Chemical Software Industry Analysis, Insights and Forecast, 2019-2031
- 12.1. Market Analysis, Insights and Forecast - By Country/Sub-region
- 12.1.1 Germany
- 12.1.2 United Kingdom
- 12.1.3 France
- 12.1.4 Italy
- 12.1.5 Spain
- 12.1.6 Rest of Europe
- 13. Asia Pacific Chemical Software Industry Analysis, Insights and Forecast, 2019-2031
- 13.1. Market Analysis, Insights and Forecast - By Country/Sub-region
- 13.1.1 China
- 13.1.2 Japan
- 13.1.3 India
- 13.1.4 Australia
- 13.1.5 South Korea
- 13.1.6 Rest of Asia Pacific
- 14. Middle East and Africa Chemical Software Industry Analysis, Insights and Forecast, 2019-2031
- 14.1. Market Analysis, Insights and Forecast - By Country/Sub-region
- 14.1.1 GCC
- 14.1.2 South Africa
- 14.1.3 Rest of Middle East and Africa
- 15. South America Chemical Software Industry Analysis, Insights and Forecast, 2019-2031
- 15.1. Market Analysis, Insights and Forecast - By Country/Sub-region
- 15.1.1 Brazil
- 15.1.2 Argentina
- 15.1.3 Rest of South America
- 16. Competitive Analysis
- 16.1. Global Market Share Analysis 2024
- 16.2. Company Profiles
- 16.2.1 Chemaxon Ltd
- 16.2.1.1. Overview
- 16.2.1.2. Products
- 16.2.1.3. SWOT Analysis
- 16.2.1.4. Recent Developments
- 16.2.1.5. Financials (Based on Availability)
- 16.2.2 BioSolveIT GmbH
- 16.2.2.1. Overview
- 16.2.2.2. Products
- 16.2.2.3. SWOT Analysis
- 16.2.2.4. Recent Developments
- 16.2.2.5. Financials (Based on Availability)
- 16.2.3 Chemical Computing Group ULC
- 16.2.3.1. Overview
- 16.2.3.2. Products
- 16.2.3.3. SWOT Analysis
- 16.2.3.4. Recent Developments
- 16.2.3.5. Financials (Based on Availability)
- 16.2.4 Molecular Discovery Ltd
- 16.2.4.1. Overview
- 16.2.4.2. Products
- 16.2.4.3. SWOT Analysis
- 16.2.4.4. Recent Developments
- 16.2.4.5. Financials (Based on Availability)
- 16.2.5 Scilligence
- 16.2.5.1. Overview
- 16.2.5.2. Products
- 16.2.5.3. SWOT Analysis
- 16.2.5.4. Recent Developments
- 16.2.5.5. Financials (Based on Availability)
- 16.2.6 Collaborative Drug Discovery Inc
- 16.2.6.1. Overview
- 16.2.6.2. Products
- 16.2.6.3. SWOT Analysis
- 16.2.6.4. Recent Developments
- 16.2.6.5. Financials (Based on Availability)
- 16.2.7 Jubilant Biosys Ltd
- 16.2.7.1. Overview
- 16.2.7.2. Products
- 16.2.7.3. SWOT Analysis
- 16.2.7.4. Recent Developments
- 16.2.7.5. Financials (Based on Availability)
- 16.2.8 Cadence Design Systems Inc (OpenEye Scientific Software Inc )
- 16.2.8.1. Overview
- 16.2.8.2. Products
- 16.2.8.3. SWOT Analysis
- 16.2.8.4. Recent Developments
- 16.2.8.5. Financials (Based on Availability)
- 16.2.9 Schrödinger Inc
- 16.2.9.1. Overview
- 16.2.9.2. Products
- 16.2.9.3. SWOT Analysis
- 16.2.9.4. Recent Developments
- 16.2.9.5. Financials (Based on Availability)
- 16.2.10 Dassault Systemes
- 16.2.10.1. Overview
- 16.2.10.2. Products
- 16.2.10.3. SWOT Analysis
- 16.2.10.4. Recent Developments
- 16.2.10.5. Financials (Based on Availability)
- 16.2.1 Chemaxon Ltd
List of Figures
- Figure 1: Global Chemical Software Industry Revenue Breakdown (Million, %) by Region 2024 & 2032
- Figure 2: North America Chemical Software Industry Revenue (Million), by Country 2024 & 2032
- Figure 3: North America Chemical Software Industry Revenue Share (%), by Country 2024 & 2032
- Figure 4: Europe Chemical Software Industry Revenue (Million), by Country 2024 & 2032
- Figure 5: Europe Chemical Software Industry Revenue Share (%), by Country 2024 & 2032
- Figure 6: Asia Pacific Chemical Software Industry Revenue (Million), by Country 2024 & 2032
- Figure 7: Asia Pacific Chemical Software Industry Revenue Share (%), by Country 2024 & 2032
- Figure 8: Middle East and Africa Chemical Software Industry Revenue (Million), by Country 2024 & 2032
- Figure 9: Middle East and Africa Chemical Software Industry Revenue Share (%), by Country 2024 & 2032
- Figure 10: South America Chemical Software Industry Revenue (Million), by Country 2024 & 2032
- Figure 11: South America Chemical Software Industry Revenue Share (%), by Country 2024 & 2032
- Figure 12: North America Chemical Software Industry Revenue (Million), by Application 2024 & 2032
- Figure 13: North America Chemical Software Industry Revenue Share (%), by Application 2024 & 2032
- Figure 14: North America Chemical Software Industry Revenue (Million), by Country 2024 & 2032
- Figure 15: North America Chemical Software Industry Revenue Share (%), by Country 2024 & 2032
- Figure 16: Europe Chemical Software Industry Revenue (Million), by Application 2024 & 2032
- Figure 17: Europe Chemical Software Industry Revenue Share (%), by Application 2024 & 2032
- Figure 18: Europe Chemical Software Industry Revenue (Million), by Country 2024 & 2032
- Figure 19: Europe Chemical Software Industry Revenue Share (%), by Country 2024 & 2032
- Figure 20: Asia Pacific Chemical Software Industry Revenue (Million), by Application 2024 & 2032
- Figure 21: Asia Pacific Chemical Software Industry Revenue Share (%), by Application 2024 & 2032
- Figure 22: Asia Pacific Chemical Software Industry Revenue (Million), by Country 2024 & 2032
- Figure 23: Asia Pacific Chemical Software Industry Revenue Share (%), by Country 2024 & 2032
- Figure 24: Middle East and Africa Chemical Software Industry Revenue (Million), by Application 2024 & 2032
- Figure 25: Middle East and Africa Chemical Software Industry Revenue Share (%), by Application 2024 & 2032
- Figure 26: Middle East and Africa Chemical Software Industry Revenue (Million), by Country 2024 & 2032
- Figure 27: Middle East and Africa Chemical Software Industry Revenue Share (%), by Country 2024 & 2032
- Figure 28: South America Chemical Software Industry Revenue (Million), by Application 2024 & 2032
- Figure 29: South America Chemical Software Industry Revenue Share (%), by Application 2024 & 2032
- Figure 30: South America Chemical Software Industry Revenue (Million), by Country 2024 & 2032
- Figure 31: South America Chemical Software Industry Revenue Share (%), by Country 2024 & 2032
List of Tables
- Table 1: Global Chemical Software Industry Revenue Million Forecast, by Region 2019 & 2032
- Table 2: Global Chemical Software Industry Revenue Million Forecast, by Application 2019 & 2032
- Table 3: Global Chemical Software Industry Revenue Million Forecast, by Region 2019 & 2032
- Table 4: Global Chemical Software Industry Revenue Million Forecast, by Country 2019 & 2032
- Table 5: United States Chemical Software Industry Revenue (Million) Forecast, by Application 2019 & 2032
- Table 6: Canada Chemical Software Industry Revenue (Million) Forecast, by Application 2019 & 2032
- Table 7: Mexico Chemical Software Industry Revenue (Million) Forecast, by Application 2019 & 2032
- Table 8: Global Chemical Software Industry Revenue Million Forecast, by Country 2019 & 2032
- Table 9: Germany Chemical Software Industry Revenue (Million) Forecast, by Application 2019 & 2032
- Table 10: United Kingdom Chemical Software Industry Revenue (Million) Forecast, by Application 2019 & 2032
- Table 11: France Chemical Software Industry Revenue (Million) Forecast, by Application 2019 & 2032
- Table 12: Italy Chemical Software Industry Revenue (Million) Forecast, by Application 2019 & 2032
- Table 13: Spain Chemical Software Industry Revenue (Million) Forecast, by Application 2019 & 2032
- Table 14: Rest of Europe Chemical Software Industry Revenue (Million) Forecast, by Application 2019 & 2032
- Table 15: Global Chemical Software Industry Revenue Million Forecast, by Country 2019 & 2032
- Table 16: China Chemical Software Industry Revenue (Million) Forecast, by Application 2019 & 2032
- Table 17: Japan Chemical Software Industry Revenue (Million) Forecast, by Application 2019 & 2032
- Table 18: India Chemical Software Industry Revenue (Million) Forecast, by Application 2019 & 2032
- Table 19: Australia Chemical Software Industry Revenue (Million) Forecast, by Application 2019 & 2032
- Table 20: South Korea Chemical Software Industry Revenue (Million) Forecast, by Application 2019 & 2032
- Table 21: Rest of Asia Pacific Chemical Software Industry Revenue (Million) Forecast, by Application 2019 & 2032
- Table 22: Global Chemical Software Industry Revenue Million Forecast, by Country 2019 & 2032
- Table 23: GCC Chemical Software Industry Revenue (Million) Forecast, by Application 2019 & 2032
- Table 24: South Africa Chemical Software Industry Revenue (Million) Forecast, by Application 2019 & 2032
- Table 25: Rest of Middle East and Africa Chemical Software Industry Revenue (Million) Forecast, by Application 2019 & 2032
- Table 26: Global Chemical Software Industry Revenue Million Forecast, by Country 2019 & 2032
- Table 27: Brazil Chemical Software Industry Revenue (Million) Forecast, by Application 2019 & 2032
- Table 28: Argentina Chemical Software Industry Revenue (Million) Forecast, by Application 2019 & 2032
- Table 29: Rest of South America Chemical Software Industry Revenue (Million) Forecast, by Application 2019 & 2032
- Table 30: Global Chemical Software Industry Revenue Million Forecast, by Application 2019 & 2032
- Table 31: Global Chemical Software Industry Revenue Million Forecast, by Country 2019 & 2032
- Table 32: United States Chemical Software Industry Revenue (Million) Forecast, by Application 2019 & 2032
- Table 33: Canada Chemical Software Industry Revenue (Million) Forecast, by Application 2019 & 2032
- Table 34: Mexico Chemical Software Industry Revenue (Million) Forecast, by Application 2019 & 2032
- Table 35: Global Chemical Software Industry Revenue Million Forecast, by Application 2019 & 2032
- Table 36: Global Chemical Software Industry Revenue Million Forecast, by Country 2019 & 2032
- Table 37: Germany Chemical Software Industry Revenue (Million) Forecast, by Application 2019 & 2032
- Table 38: United Kingdom Chemical Software Industry Revenue (Million) Forecast, by Application 2019 & 2032
- Table 39: France Chemical Software Industry Revenue (Million) Forecast, by Application 2019 & 2032
- Table 40: Italy Chemical Software Industry Revenue (Million) Forecast, by Application 2019 & 2032
- Table 41: Spain Chemical Software Industry Revenue (Million) Forecast, by Application 2019 & 2032
- Table 42: Rest of Europe Chemical Software Industry Revenue (Million) Forecast, by Application 2019 & 2032
- Table 43: Global Chemical Software Industry Revenue Million Forecast, by Application 2019 & 2032
- Table 44: Global Chemical Software Industry Revenue Million Forecast, by Country 2019 & 2032
- Table 45: China Chemical Software Industry Revenue (Million) Forecast, by Application 2019 & 2032
- Table 46: Japan Chemical Software Industry Revenue (Million) Forecast, by Application 2019 & 2032
- Table 47: India Chemical Software Industry Revenue (Million) Forecast, by Application 2019 & 2032
- Table 48: Australia Chemical Software Industry Revenue (Million) Forecast, by Application 2019 & 2032
- Table 49: South Korea Chemical Software Industry Revenue (Million) Forecast, by Application 2019 & 2032
- Table 50: Rest of Asia Pacific Chemical Software Industry Revenue (Million) Forecast, by Application 2019 & 2032
- Table 51: Global Chemical Software Industry Revenue Million Forecast, by Application 2019 & 2032
- Table 52: Global Chemical Software Industry Revenue Million Forecast, by Country 2019 & 2032
- Table 53: GCC Chemical Software Industry Revenue (Million) Forecast, by Application 2019 & 2032
- Table 54: South Africa Chemical Software Industry Revenue (Million) Forecast, by Application 2019 & 2032
- Table 55: Rest of Middle East and Africa Chemical Software Industry Revenue (Million) Forecast, by Application 2019 & 2032
- Table 56: Global Chemical Software Industry Revenue Million Forecast, by Application 2019 & 2032
- Table 57: Global Chemical Software Industry Revenue Million Forecast, by Country 2019 & 2032
- Table 58: Brazil Chemical Software Industry Revenue (Million) Forecast, by Application 2019 & 2032
- Table 59: Argentina Chemical Software Industry Revenue (Million) Forecast, by Application 2019 & 2032
- Table 60: Rest of South America Chemical Software Industry Revenue (Million) Forecast, by Application 2019 & 2032
Frequently Asked Questions
1. What is the projected Compound Annual Growth Rate (CAGR) of the Chemical Software Industry?
The projected CAGR is approximately 15.50%.
2. Which companies are prominent players in the Chemical Software Industry?
Key companies in the market include Chemaxon Ltd, BioSolveIT GmbH, Chemical Computing Group ULC, Molecular Discovery Ltd, Scilligence, Collaborative Drug Discovery Inc, Jubilant Biosys Ltd, Cadence Design Systems Inc (OpenEye Scientific Software Inc ), Schrödinger Inc, Dassault Systemes.
3. What are the main segments of the Chemical Software Industry?
The market segments include Application.
4. Can you provide details about the market size?
The market size is estimated to be USD 6.10 Million as of 2022.
5. What are some drivers contributing to market growth?
Innovations and Advancements in the Drug Development Process; Increased Demand of Personalized Medicine.
6. What are the notable trends driving market growth?
Virtual Screening Segment is Expected to Witness Growth in the Market Over the Forecast Period.
7. Are there any restraints impacting market growth?
Lack of Skilled Labors.
8. Can you provide examples of recent developments in the market?
In October 2023, Cadence Molecular Sciences (OpenEye) announced that Pfizer Inc. has signed an agreement to extend and expand access to Cadence products and programming toolkits for advanced molecular design. Cadence Molecular Sciences’ physics-and AI-based modelling and cheminformatics computational software is an enabler of early-stage drug discovery innovation.
9. What pricing options are available for accessing the report?
Pricing options include single-user, multi-user, and enterprise licenses priced at USD 4750, USD 5250, and USD 8750 respectively.
10. Is the market size provided in terms of value or volume?
The market size is provided in terms of value, measured in Million.
11. Are there any specific market keywords associated with the report?
Yes, the market keyword associated with the report is "Chemical Software Industry," which aids in identifying and referencing the specific market segment covered.
12. How do I determine which pricing option suits my needs best?
The pricing options vary based on user requirements and access needs. Individual users may opt for single-user licenses, while businesses requiring broader access may choose multi-user or enterprise licenses for cost-effective access to the report.
13. Are there any additional resources or data provided in the Chemical Software Industry report?
While the report offers comprehensive insights, it's advisable to review the specific contents or supplementary materials provided to ascertain if additional resources or data are available.
14. How can I stay updated on further developments or reports in the Chemical Software Industry?
To stay informed about further developments, trends, and reports in the Chemical Software Industry, consider subscribing to industry newsletters, following relevant companies and organizations, or regularly checking reputable industry news sources and publications.
Methodology
Step 1 - Identification of Relevant Samples Size from Population Database


Step 2 - Approaches for Defining Global Market Size (Value, Volume* & Price*)

Note*: In applicable scenarios
Step 3 - Data Sources
Primary Research
- Web Analytics
- Survey Reports
- Research Institute
- Latest Research Reports
- Opinion Leaders
Secondary Research
- Annual Reports
- White Paper
- Latest Press Release
- Industry Association
- Paid Database
- Investor Presentations

Step 4 - Data Triangulation
Involves using different sources of information in order to increase the validity of a study
These sources are likely to be stakeholders in a program - participants, other researchers, program staff, other community members, and so on.
Then we put all data in single framework & apply various statistical tools to find out the dynamic on the market.
During the analysis stage, feedback from the stakeholder groups would be compared to determine areas of agreement as well as areas of divergence


