
Key Insights
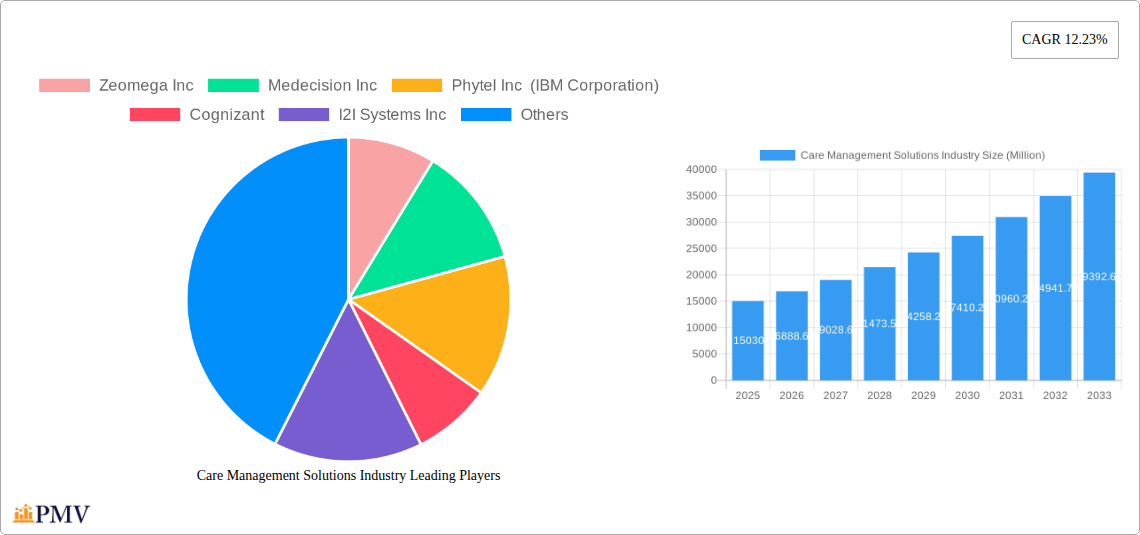
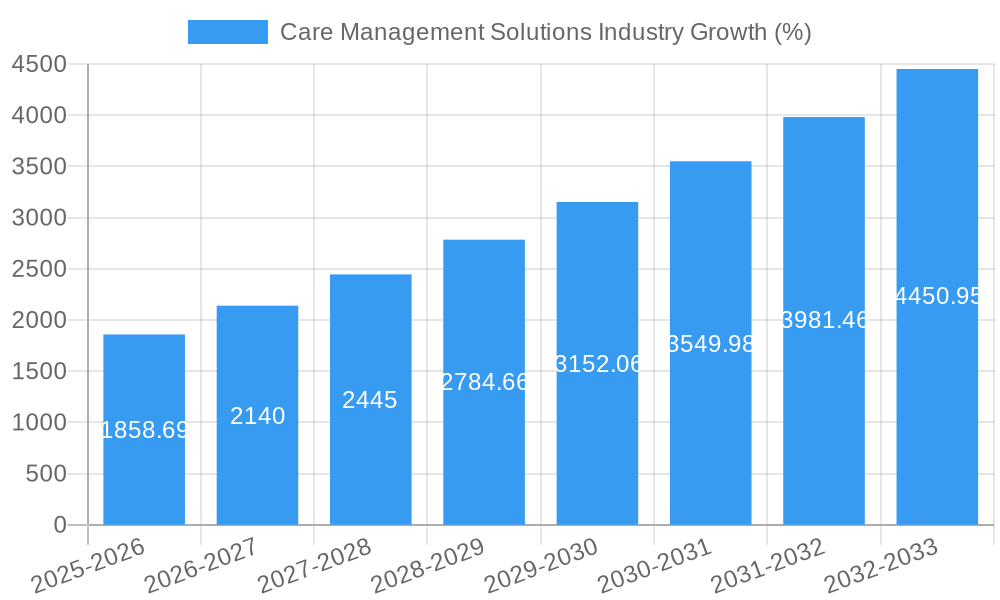
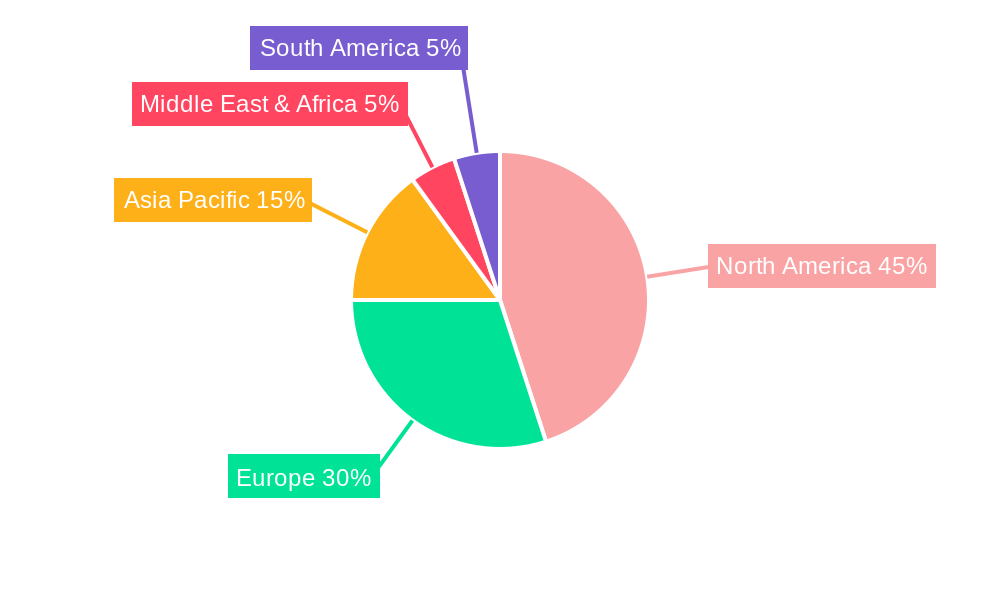
The global Care Management Solutions market, valued at $15.03 billion in 2025, is projected to experience robust growth, driven by a compound annual growth rate (CAGR) of 12.23% from 2025 to 2033. This expansion is fueled by several key factors. The increasing prevalence of chronic diseases necessitates proactive and efficient care management, leading to higher adoption of these solutions by healthcare payers and providers. Technological advancements, such as cloud-based and web-based platforms, enhance accessibility, scalability, and cost-effectiveness, further accelerating market growth. Furthermore, the rising demand for value-based care models, emphasizing improved patient outcomes and reduced healthcare costs, is driving investment and adoption of sophisticated care management solutions. The integration of data analytics and artificial intelligence is also transforming the landscape, enabling more predictive and personalized care interventions. Competition is intense, with established players like IBM (through Phytel), Optum, and EPIC alongside emerging technology companies vying for market share. The market is segmented by application (chronic care, disease management, utilization management), end-user (payers, providers, other), component (software, services), and delivery mode (cloud/web-based, on-premise). North America currently holds a significant market share, but the Asia-Pacific region is expected to witness substantial growth due to increasing healthcare expenditure and technological advancements in emerging economies.
The market's growth trajectory is influenced by certain challenges. Data privacy and security concerns remain a crucial obstacle, necessitating robust cybersecurity measures. The high cost of implementation and integration of these complex solutions can be a barrier for smaller healthcare organizations. Furthermore, ensuring seamless interoperability between various care management systems and existing healthcare IT infrastructure remains a key challenge. Overcoming these hurdles requires collaborative efforts from technology providers, healthcare organizations, and regulatory bodies to establish standardized protocols and promote data security best practices. Despite these challenges, the long-term outlook for the care management solutions market remains exceptionally positive, propelled by the increasing emphasis on preventative care, population health management, and the wider adoption of digital health technologies.
Care Management Solutions Industry Market Report: 2019-2033
This comprehensive report provides a detailed analysis of the Care Management Solutions industry, offering invaluable insights for stakeholders across the healthcare ecosystem. With a study period spanning 2019-2033, a base year of 2025, and a forecast period of 2025-2033, this report leverages historical data (2019-2024) to project future market trends and growth opportunities. The report analyzes key segments, competitive dynamics, and emerging technologies shaping the future of care management. The total market size is estimated at xx Million in 2025 and is projected to reach xx Million by 2033, exhibiting a CAGR of xx%.
Care Management Solutions Industry Market Structure & Competitive Dynamics
The Care Management Solutions market is characterized by a moderately concentrated landscape with several large players and numerous smaller niche providers. Key players such as Zeomega Inc, Medecision Inc, Phytel Inc (IBM Corporation), Cognizant, I2I Systems Inc, Centene Corporation (Evolve), Veradigm, InfoMC, Infosys Limited, Convey Health Solutions, Optum Inc, EPIC Corporation Inc, Exl Healthcare, and Hinduja Global Solutions Limited compete intensely, driving innovation and influencing market pricing. Market share is highly dynamic, with larger players consistently seeking to expand their portfolios through acquisitions and strategic partnerships.
Market concentration is measured by the Herfindahl-Hirschman Index (HHI) at xx, indicating a [Describe market concentration as moderately concentrated, highly concentrated, or unconcentrated based on HHI value]. Innovation within the ecosystem is robust, driven by advancements in artificial intelligence, machine learning, and telehealth technologies. Regulatory frameworks, such as HIPAA and other data privacy regulations, significantly impact market operations and necessitate stringent data security measures. Product substitutes include traditional in-person care management approaches, though these are being increasingly challenged by the efficiency and scalability of digital solutions. End-user trends, particularly the growing adoption of value-based care models, are shaping market demand.
M&A activity has been significant, with several high-value deals reported in recent years. For example, the acquisition of [Company A] by [Company B] in [Year] for xx Million underscored the consolidation trend. Overall, M&A deals, while not consistently above xx Million per transaction, contribute to a dynamic and evolving competitive landscape.
Care Management Solutions Industry Industry Trends & Insights
The Care Management Solutions market is experiencing robust growth, driven by several key factors. The increasing prevalence of chronic diseases, coupled with the aging global population, is fueling demand for efficient and effective care management programs. The shift towards value-based care models further incentivizes the adoption of care management solutions to improve patient outcomes while controlling costs. Technological advancements, including the proliferation of telehealth platforms and the integration of artificial intelligence, are enhancing the capabilities of care management tools. This translates to improved patient engagement, remote monitoring, and personalized care plans.
Consumer preferences are shifting towards personalized and convenient care options, leading to increased demand for user-friendly mobile applications and remote monitoring devices. The competitive landscape is characterized by innovation and consolidation, with established players and new entrants continuously striving to improve their offerings. Market penetration for cloud-based care management solutions is rapidly increasing, driven by the scalability and cost-effectiveness of cloud infrastructure. The industry is projected to experience significant growth, with a compound annual growth rate (CAGR) of xx% during the forecast period (2025-2033), reaching an estimated market value of xx Million by 2033.
Dominant Markets & Segments in Care Management Solutions Industry
The North American market currently holds the largest share of the global Care Management Solutions market due to robust healthcare infrastructure, high technology adoption rates, and favorable regulatory environments. Within the segments:
By Application: Chronic Care Management is the dominant segment due to the high prevalence of chronic conditions and the growing need for effective disease management programs. Disease Management and Utilization Management also represent substantial market shares.
By End User: Healthcare Payers are the largest end-user segment, driven by their need to manage healthcare costs and improve patient outcomes. Healthcare Providers are also significant users, leveraging these solutions for enhanced care coordination and efficiency.
By Component: Software solutions account for the larger market share compared to services, reflecting the increasing adoption of sophisticated digital care management platforms.
By Delivery Mode: Cloud-based and web-based solutions are gaining traction due to their flexibility, scalability, and cost-effectiveness, surpassing the adoption of on-premise solutions.
Key drivers for the dominance of these segments include:
Economic policies: Government initiatives focused on value-based care and healthcare cost containment are driving market growth.
Infrastructure: The availability of robust IT infrastructure, including high-speed internet and advanced communication networks, supports the adoption of digital care management solutions.
Care Management Solutions Industry Product Innovations
Recent product innovations highlight the industry's focus on integrating advanced technologies to enhance patient engagement and improve care coordination. For example, the launch of AI-powered predictive analytics tools enables proactive identification of high-risk patients and personalized intervention strategies. Integration with wearable devices facilitates remote patient monitoring, empowering patients to actively manage their health. These innovations significantly enhance care quality and efficiency, driving broader adoption. The competitive advantage lies in creating intuitive, user-friendly interfaces and offering seamless integration with existing electronic health record (EHR) systems.
Report Segmentation & Scope
This report segments the Care Management Solutions market across several key dimensions:
By Application: Chronic Care Management, Disease Management, Utilization Management. Each segment is analyzed for its market size, growth rate, and competitive dynamics. Growth projections vary by application, with Chronic Care Management expected to maintain the fastest growth throughout the forecast period.
By End User: Healthcare Payers, Healthcare Providers, Other End Users (e.g., government agencies). This segmentation assesses the specific needs and adoption patterns of each end-user group. Healthcare payers are predicted to remain the largest segment owing to their strategic interest in cost reduction and improved health outcomes.
By Component: Software, Services. This segmentation analyzes the market share and growth prospects of different components.
By Delivery Mode: Cloud-based and Web-based, On-premise. This assessment captures the shift toward cloud-based solutions and the associated benefits.
Key Drivers of Care Management Solutions Industry Growth
Several factors contribute to the growth of the Care Management Solutions industry. Technological advancements, particularly in AI and telehealth, are enabling personalized and efficient care delivery. Government regulations promoting value-based care and interoperability are further incentivizing the adoption of these solutions. The increasing prevalence of chronic diseases and an aging population create an expanding market need for better care coordination and disease management. Finally, the cost-effectiveness of these solutions compared to traditional care models fuels their appeal among healthcare providers and payers.
Challenges in the Care Management Solutions Industry Sector
The Care Management Solutions industry faces challenges including interoperability issues between different systems, data privacy and security concerns, and the need for robust cybersecurity measures. High implementation costs and the need for skilled personnel to manage these complex systems can also present obstacles. Furthermore, the industry faces competition from traditional care models and the need to demonstrate clear return on investment (ROI) to secure adoption by healthcare providers and payers. The lack of standardized data formats across the healthcare industry creates interoperability challenges.
Leading Players in the Care Management Solutions Industry Market
- Zeomega Inc
- Medecision Inc
- Phytel Inc (IBM Corporation)
- Cognizant
- I2I Systems Inc
- Centene Corporation (Evolve)
- Veradigm
- InfoMC
- Infosys Limited
- Convey Health Solutions
- Optum Inc
- EPIC Corporation Inc
- Exl Healthcare
- Hinduja Global Solutions Limited
Key Developments in Care Management Solutions Industry Sector
March 2023: Royal Philips launched Philips Virtual Care Management, expanding the portfolio of virtual care solutions. This development significantly impacts the market by offering a comprehensive platform for remote patient monitoring and engagement.
April 2023: Medecision introduced Aerial Social Care Coordinator, a solution addressing social determinants of health. This launch directly addresses a critical gap in care management, impacting market dynamics by providing valuable insights for better patient care and resource allocation.
Strategic Care Management Solutions Industry Market Outlook
The Care Management Solutions market presents significant growth opportunities driven by technological advancements, the increasing prevalence of chronic diseases, and the shift towards value-based care. Strategic partnerships between technology providers and healthcare organizations will be key to driving market penetration and expanding access to these solutions. Future innovation will focus on further enhancing personalization, integration with existing EHR systems, and expanding the scope of remote patient monitoring capabilities. Investing in user-friendly interfaces and comprehensive data analytics platforms will be crucial to maximizing the value of care management solutions.
Care Management Solutions Industry Segmentation
-
1. Component
- 1.1. Software
- 1.2. Services
-
2. Delivery Mode
- 2.1. Cloud-based and Web-based
- 2.2. On-premise
-
3. Application
- 3.1. Chronic Care Management
- 3.2. Disease Management
- 3.3. Utilization Management
-
4. End User
- 4.1. Healthcare Payers
- 4.2. Healthcare Providers
- 4.3. Other End Users
Care Management Solutions Industry Segmentation By Geography
-
1. North America
- 1.1. United States
- 1.2. Canada
- 1.3. Mexico
-
2. Europe
- 2.1. Germany
- 2.2. United Kindom
- 2.3. France
- 2.4. Italy
- 2.5. Spain
- 2.6. Rest of Europe
-
3. Asia Pacific
- 3.1. China
- 3.2. Japan
- 3.3. India
- 3.4. Australia
- 3.5. South Korea
- 3.6. Rest of Asia Pacific
- 4. Middle East
-
5. GCC
- 5.1. South Africa
- 5.2. Rest of Middle East and Africa
-
6. South America
- 6.1. Brazil
- 6.2. Argentina
- 6.3. Rest of South America
Care Management Solutions Industry REPORT HIGHLIGHTS
| Aspects | Details |
|---|---|
| Study Period | 2019-2033 |
| Base Year | 2024 |
| Estimated Year | 2025 |
| Forecast Period | 2025-2033 |
| Historical Period | 2019-2024 |
| Growth Rate | CAGR of 12.23% from 2019-2033 |
| Segmentation |
|
Table of Contents
- 1. Introduction
- 1.1. Research Scope
- 1.2. Market Segmentation
- 1.3. Research Methodology
- 1.4. Definitions and Assumptions
- 2. Executive Summary
- 2.1. Introduction
- 3. Market Dynamics
- 3.1. Introduction
- 3.2. Market Drivers
- 3.2.1. Rising Geriatric Population and Burden of Chronic Diseases; Care Management Solutions Offer a Means to Reduce Healthcare Costs; Government Initiatives on Healthcare Services and Infrastructure
- 3.3. Market Restrains
- 3.3.1. High Investments Required for Supporting Infrastructure; Data Security Concerns Related to Cloud-based Solutions
- 3.4. Market Trends
- 3.4.1. Chronic Care Management Segment Expected to Hold a Significant Share in the Care Management Solutions Market
- 4. Market Factor Analysis
- 4.1. Porters Five Forces
- 4.2. Supply/Value Chain
- 4.3. PESTEL analysis
- 4.4. Market Entropy
- 4.5. Patent/Trademark Analysis
- 5. Global Care Management Solutions Industry Analysis, Insights and Forecast, 2019-2031
- 5.1. Market Analysis, Insights and Forecast - by Component
- 5.1.1. Software
- 5.1.2. Services
- 5.2. Market Analysis, Insights and Forecast - by Delivery Mode
- 5.2.1. Cloud-based and Web-based
- 5.2.2. On-premise
- 5.3. Market Analysis, Insights and Forecast - by Application
- 5.3.1. Chronic Care Management
- 5.3.2. Disease Management
- 5.3.3. Utilization Management
- 5.4. Market Analysis, Insights and Forecast - by End User
- 5.4.1. Healthcare Payers
- 5.4.2. Healthcare Providers
- 5.4.3. Other End Users
- 5.5. Market Analysis, Insights and Forecast - by Region
- 5.5.1. North America
- 5.5.2. Europe
- 5.5.3. Asia Pacific
- 5.5.4. Middle East
- 5.5.5. GCC
- 5.5.6. South America
- 5.1. Market Analysis, Insights and Forecast - by Component
- 6. North America Care Management Solutions Industry Analysis, Insights and Forecast, 2019-2031
- 6.1. Market Analysis, Insights and Forecast - by Component
- 6.1.1. Software
- 6.1.2. Services
- 6.2. Market Analysis, Insights and Forecast - by Delivery Mode
- 6.2.1. Cloud-based and Web-based
- 6.2.2. On-premise
- 6.3. Market Analysis, Insights and Forecast - by Application
- 6.3.1. Chronic Care Management
- 6.3.2. Disease Management
- 6.3.3. Utilization Management
- 6.4. Market Analysis, Insights and Forecast - by End User
- 6.4.1. Healthcare Payers
- 6.4.2. Healthcare Providers
- 6.4.3. Other End Users
- 6.1. Market Analysis, Insights and Forecast - by Component
- 7. Europe Care Management Solutions Industry Analysis, Insights and Forecast, 2019-2031
- 7.1. Market Analysis, Insights and Forecast - by Component
- 7.1.1. Software
- 7.1.2. Services
- 7.2. Market Analysis, Insights and Forecast - by Delivery Mode
- 7.2.1. Cloud-based and Web-based
- 7.2.2. On-premise
- 7.3. Market Analysis, Insights and Forecast - by Application
- 7.3.1. Chronic Care Management
- 7.3.2. Disease Management
- 7.3.3. Utilization Management
- 7.4. Market Analysis, Insights and Forecast - by End User
- 7.4.1. Healthcare Payers
- 7.4.2. Healthcare Providers
- 7.4.3. Other End Users
- 7.1. Market Analysis, Insights and Forecast - by Component
- 8. Asia Pacific Care Management Solutions Industry Analysis, Insights and Forecast, 2019-2031
- 8.1. Market Analysis, Insights and Forecast - by Component
- 8.1.1. Software
- 8.1.2. Services
- 8.2. Market Analysis, Insights and Forecast - by Delivery Mode
- 8.2.1. Cloud-based and Web-based
- 8.2.2. On-premise
- 8.3. Market Analysis, Insights and Forecast - by Application
- 8.3.1. Chronic Care Management
- 8.3.2. Disease Management
- 8.3.3. Utilization Management
- 8.4. Market Analysis, Insights and Forecast - by End User
- 8.4.1. Healthcare Payers
- 8.4.2. Healthcare Providers
- 8.4.3. Other End Users
- 8.1. Market Analysis, Insights and Forecast - by Component
- 9. Middle East Care Management Solutions Industry Analysis, Insights and Forecast, 2019-2031
- 9.1. Market Analysis, Insights and Forecast - by Component
- 9.1.1. Software
- 9.1.2. Services
- 9.2. Market Analysis, Insights and Forecast - by Delivery Mode
- 9.2.1. Cloud-based and Web-based
- 9.2.2. On-premise
- 9.3. Market Analysis, Insights and Forecast - by Application
- 9.3.1. Chronic Care Management
- 9.3.2. Disease Management
- 9.3.3. Utilization Management
- 9.4. Market Analysis, Insights and Forecast - by End User
- 9.4.1. Healthcare Payers
- 9.4.2. Healthcare Providers
- 9.4.3. Other End Users
- 9.1. Market Analysis, Insights and Forecast - by Component
- 10. GCC Care Management Solutions Industry Analysis, Insights and Forecast, 2019-2031
- 10.1. Market Analysis, Insights and Forecast - by Component
- 10.1.1. Software
- 10.1.2. Services
- 10.2. Market Analysis, Insights and Forecast - by Delivery Mode
- 10.2.1. Cloud-based and Web-based
- 10.2.2. On-premise
- 10.3. Market Analysis, Insights and Forecast - by Application
- 10.3.1. Chronic Care Management
- 10.3.2. Disease Management
- 10.3.3. Utilization Management
- 10.4. Market Analysis, Insights and Forecast - by End User
- 10.4.1. Healthcare Payers
- 10.4.2. Healthcare Providers
- 10.4.3. Other End Users
- 10.1. Market Analysis, Insights and Forecast - by Component
- 11. South America Care Management Solutions Industry Analysis, Insights and Forecast, 2019-2031
- 11.1. Market Analysis, Insights and Forecast - by Component
- 11.1.1. Software
- 11.1.2. Services
- 11.2. Market Analysis, Insights and Forecast - by Delivery Mode
- 11.2.1. Cloud-based and Web-based
- 11.2.2. On-premise
- 11.3. Market Analysis, Insights and Forecast - by Application
- 11.3.1. Chronic Care Management
- 11.3.2. Disease Management
- 11.3.3. Utilization Management
- 11.4. Market Analysis, Insights and Forecast - by End User
- 11.4.1. Healthcare Payers
- 11.4.2. Healthcare Providers
- 11.4.3. Other End Users
- 11.1. Market Analysis, Insights and Forecast - by Component
- 12. North America Care Management Solutions Industry Analysis, Insights and Forecast, 2019-2031
- 12.1. Market Analysis, Insights and Forecast - By Country/Sub-region
- 12.1.1 United States
- 12.1.2 Canada
- 12.1.3 Mexico
- 13. Europe Care Management Solutions Industry Analysis, Insights and Forecast, 2019-2031
- 13.1. Market Analysis, Insights and Forecast - By Country/Sub-region
- 13.1.1 Germany
- 13.1.2 United Kindom
- 13.1.3 France
- 13.1.4 Italy
- 13.1.5 Spain
- 13.1.6 Rest of Europe
- 14. Asia Pacific Care Management Solutions Industry Analysis, Insights and Forecast, 2019-2031
- 14.1. Market Analysis, Insights and Forecast - By Country/Sub-region
- 14.1.1 China
- 14.1.2 Japan
- 14.1.3 India
- 14.1.4 Australia
- 14.1.5 South Korea
- 14.1.6 Rest of Asia Pacific
- 15. Middle East Care Management Solutions Industry Analysis, Insights and Forecast, 2019-2031
- 15.1. Market Analysis, Insights and Forecast - By Country/Sub-region
- 15.1.1.
- 16. GCC Care Management Solutions Industry Analysis, Insights and Forecast, 2019-2031
- 16.1. Market Analysis, Insights and Forecast - By Country/Sub-region
- 16.1.1 South Africa
- 16.1.2 Rest of Middle East and Africa
- 17. South America Care Management Solutions Industry Analysis, Insights and Forecast, 2019-2031
- 17.1. Market Analysis, Insights and Forecast - By Country/Sub-region
- 17.1.1 Brazil
- 17.1.2 Argentina
- 17.1.3 Rest of South America
- 18. Competitive Analysis
- 18.1. Global Market Share Analysis 2024
- 18.2. Company Profiles
- 18.2.1 Zeomega Inc
- 18.2.1.1. Overview
- 18.2.1.2. Products
- 18.2.1.3. SWOT Analysis
- 18.2.1.4. Recent Developments
- 18.2.1.5. Financials (Based on Availability)
- 18.2.2 Medecision Inc
- 18.2.2.1. Overview
- 18.2.2.2. Products
- 18.2.2.3. SWOT Analysis
- 18.2.2.4. Recent Developments
- 18.2.2.5. Financials (Based on Availability)
- 18.2.3 Phytel Inc (IBM Corporation)
- 18.2.3.1. Overview
- 18.2.3.2. Products
- 18.2.3.3. SWOT Analysis
- 18.2.3.4. Recent Developments
- 18.2.3.5. Financials (Based on Availability)
- 18.2.4 Cognizant
- 18.2.4.1. Overview
- 18.2.4.2. Products
- 18.2.4.3. SWOT Analysis
- 18.2.4.4. Recent Developments
- 18.2.4.5. Financials (Based on Availability)
- 18.2.5 I2I Systems Inc
- 18.2.5.1. Overview
- 18.2.5.2. Products
- 18.2.5.3. SWOT Analysis
- 18.2.5.4. Recent Developments
- 18.2.5.5. Financials (Based on Availability)
- 18.2.6 Centene Corporation (Evolve)
- 18.2.6.1. Overview
- 18.2.6.2. Products
- 18.2.6.3. SWOT Analysis
- 18.2.6.4. Recent Developments
- 18.2.6.5. Financials (Based on Availability)
- 18.2.7 Veradigm
- 18.2.7.1. Overview
- 18.2.7.2. Products
- 18.2.7.3. SWOT Analysis
- 18.2.7.4. Recent Developments
- 18.2.7.5. Financials (Based on Availability)
- 18.2.8 InfoMC
- 18.2.8.1. Overview
- 18.2.8.2. Products
- 18.2.8.3. SWOT Analysis
- 18.2.8.4. Recent Developments
- 18.2.8.5. Financials (Based on Availability)
- 18.2.9 Infosys Limited
- 18.2.9.1. Overview
- 18.2.9.2. Products
- 18.2.9.3. SWOT Analysis
- 18.2.9.4. Recent Developments
- 18.2.9.5. Financials (Based on Availability)
- 18.2.10 Convey Health Solutions
- 18.2.10.1. Overview
- 18.2.10.2. Products
- 18.2.10.3. SWOT Analysis
- 18.2.10.4. Recent Developments
- 18.2.10.5. Financials (Based on Availability)
- 18.2.11 Optum Inc
- 18.2.11.1. Overview
- 18.2.11.2. Products
- 18.2.11.3. SWOT Analysis
- 18.2.11.4. Recent Developments
- 18.2.11.5. Financials (Based on Availability)
- 18.2.12 EPIC Corporation Inc
- 18.2.12.1. Overview
- 18.2.12.2. Products
- 18.2.12.3. SWOT Analysis
- 18.2.12.4. Recent Developments
- 18.2.12.5. Financials (Based on Availability)
- 18.2.13 Exl Healthcare
- 18.2.13.1. Overview
- 18.2.13.2. Products
- 18.2.13.3. SWOT Analysis
- 18.2.13.4. Recent Developments
- 18.2.13.5. Financials (Based on Availability)
- 18.2.14 Hinduja Global Solutions Limited
- 18.2.14.1. Overview
- 18.2.14.2. Products
- 18.2.14.3. SWOT Analysis
- 18.2.14.4. Recent Developments
- 18.2.14.5. Financials (Based on Availability)
- 18.2.1 Zeomega Inc
List of Figures
- Figure 1: Global Care Management Solutions Industry Revenue Breakdown (Million, %) by Region 2024 & 2032
- Figure 2: Global Care Management Solutions Industry Volume Breakdown (K Unit, %) by Region 2024 & 2032
- Figure 3: North America Care Management Solutions Industry Revenue (Million), by Country 2024 & 2032
- Figure 4: North America Care Management Solutions Industry Volume (K Unit), by Country 2024 & 2032
- Figure 5: North America Care Management Solutions Industry Revenue Share (%), by Country 2024 & 2032
- Figure 6: North America Care Management Solutions Industry Volume Share (%), by Country 2024 & 2032
- Figure 7: Europe Care Management Solutions Industry Revenue (Million), by Country 2024 & 2032
- Figure 8: Europe Care Management Solutions Industry Volume (K Unit), by Country 2024 & 2032
- Figure 9: Europe Care Management Solutions Industry Revenue Share (%), by Country 2024 & 2032
- Figure 10: Europe Care Management Solutions Industry Volume Share (%), by Country 2024 & 2032
- Figure 11: Asia Pacific Care Management Solutions Industry Revenue (Million), by Country 2024 & 2032
- Figure 12: Asia Pacific Care Management Solutions Industry Volume (K Unit), by Country 2024 & 2032
- Figure 13: Asia Pacific Care Management Solutions Industry Revenue Share (%), by Country 2024 & 2032
- Figure 14: Asia Pacific Care Management Solutions Industry Volume Share (%), by Country 2024 & 2032
- Figure 15: Middle East Care Management Solutions Industry Revenue (Million), by Country 2024 & 2032
- Figure 16: Middle East Care Management Solutions Industry Volume (K Unit), by Country 2024 & 2032
- Figure 17: Middle East Care Management Solutions Industry Revenue Share (%), by Country 2024 & 2032
- Figure 18: Middle East Care Management Solutions Industry Volume Share (%), by Country 2024 & 2032
- Figure 19: GCC Care Management Solutions Industry Revenue (Million), by Country 2024 & 2032
- Figure 20: GCC Care Management Solutions Industry Volume (K Unit), by Country 2024 & 2032
- Figure 21: GCC Care Management Solutions Industry Revenue Share (%), by Country 2024 & 2032
- Figure 22: GCC Care Management Solutions Industry Volume Share (%), by Country 2024 & 2032
- Figure 23: South America Care Management Solutions Industry Revenue (Million), by Country 2024 & 2032
- Figure 24: South America Care Management Solutions Industry Volume (K Unit), by Country 2024 & 2032
- Figure 25: South America Care Management Solutions Industry Revenue Share (%), by Country 2024 & 2032
- Figure 26: South America Care Management Solutions Industry Volume Share (%), by Country 2024 & 2032
- Figure 27: North America Care Management Solutions Industry Revenue (Million), by Component 2024 & 2032
- Figure 28: North America Care Management Solutions Industry Volume (K Unit), by Component 2024 & 2032
- Figure 29: North America Care Management Solutions Industry Revenue Share (%), by Component 2024 & 2032
- Figure 30: North America Care Management Solutions Industry Volume Share (%), by Component 2024 & 2032
- Figure 31: North America Care Management Solutions Industry Revenue (Million), by Delivery Mode 2024 & 2032
- Figure 32: North America Care Management Solutions Industry Volume (K Unit), by Delivery Mode 2024 & 2032
- Figure 33: North America Care Management Solutions Industry Revenue Share (%), by Delivery Mode 2024 & 2032
- Figure 34: North America Care Management Solutions Industry Volume Share (%), by Delivery Mode 2024 & 2032
- Figure 35: North America Care Management Solutions Industry Revenue (Million), by Application 2024 & 2032
- Figure 36: North America Care Management Solutions Industry Volume (K Unit), by Application 2024 & 2032
- Figure 37: North America Care Management Solutions Industry Revenue Share (%), by Application 2024 & 2032
- Figure 38: North America Care Management Solutions Industry Volume Share (%), by Application 2024 & 2032
- Figure 39: North America Care Management Solutions Industry Revenue (Million), by End User 2024 & 2032
- Figure 40: North America Care Management Solutions Industry Volume (K Unit), by End User 2024 & 2032
- Figure 41: North America Care Management Solutions Industry Revenue Share (%), by End User 2024 & 2032
- Figure 42: North America Care Management Solutions Industry Volume Share (%), by End User 2024 & 2032
- Figure 43: North America Care Management Solutions Industry Revenue (Million), by Country 2024 & 2032
- Figure 44: North America Care Management Solutions Industry Volume (K Unit), by Country 2024 & 2032
- Figure 45: North America Care Management Solutions Industry Revenue Share (%), by Country 2024 & 2032
- Figure 46: North America Care Management Solutions Industry Volume Share (%), by Country 2024 & 2032
- Figure 47: Europe Care Management Solutions Industry Revenue (Million), by Component 2024 & 2032
- Figure 48: Europe Care Management Solutions Industry Volume (K Unit), by Component 2024 & 2032
- Figure 49: Europe Care Management Solutions Industry Revenue Share (%), by Component 2024 & 2032
- Figure 50: Europe Care Management Solutions Industry Volume Share (%), by Component 2024 & 2032
- Figure 51: Europe Care Management Solutions Industry Revenue (Million), by Delivery Mode 2024 & 2032
- Figure 52: Europe Care Management Solutions Industry Volume (K Unit), by Delivery Mode 2024 & 2032
- Figure 53: Europe Care Management Solutions Industry Revenue Share (%), by Delivery Mode 2024 & 2032
- Figure 54: Europe Care Management Solutions Industry Volume Share (%), by Delivery Mode 2024 & 2032
- Figure 55: Europe Care Management Solutions Industry Revenue (Million), by Application 2024 & 2032
- Figure 56: Europe Care Management Solutions Industry Volume (K Unit), by Application 2024 & 2032
- Figure 57: Europe Care Management Solutions Industry Revenue Share (%), by Application 2024 & 2032
- Figure 58: Europe Care Management Solutions Industry Volume Share (%), by Application 2024 & 2032
- Figure 59: Europe Care Management Solutions Industry Revenue (Million), by End User 2024 & 2032
- Figure 60: Europe Care Management Solutions Industry Volume (K Unit), by End User 2024 & 2032
- Figure 61: Europe Care Management Solutions Industry Revenue Share (%), by End User 2024 & 2032
- Figure 62: Europe Care Management Solutions Industry Volume Share (%), by End User 2024 & 2032
- Figure 63: Europe Care Management Solutions Industry Revenue (Million), by Country 2024 & 2032
- Figure 64: Europe Care Management Solutions Industry Volume (K Unit), by Country 2024 & 2032
- Figure 65: Europe Care Management Solutions Industry Revenue Share (%), by Country 2024 & 2032
- Figure 66: Europe Care Management Solutions Industry Volume Share (%), by Country 2024 & 2032
- Figure 67: Asia Pacific Care Management Solutions Industry Revenue (Million), by Component 2024 & 2032
- Figure 68: Asia Pacific Care Management Solutions Industry Volume (K Unit), by Component 2024 & 2032
- Figure 69: Asia Pacific Care Management Solutions Industry Revenue Share (%), by Component 2024 & 2032
- Figure 70: Asia Pacific Care Management Solutions Industry Volume Share (%), by Component 2024 & 2032
- Figure 71: Asia Pacific Care Management Solutions Industry Revenue (Million), by Delivery Mode 2024 & 2032
- Figure 72: Asia Pacific Care Management Solutions Industry Volume (K Unit), by Delivery Mode 2024 & 2032
- Figure 73: Asia Pacific Care Management Solutions Industry Revenue Share (%), by Delivery Mode 2024 & 2032
- Figure 74: Asia Pacific Care Management Solutions Industry Volume Share (%), by Delivery Mode 2024 & 2032
- Figure 75: Asia Pacific Care Management Solutions Industry Revenue (Million), by Application 2024 & 2032
- Figure 76: Asia Pacific Care Management Solutions Industry Volume (K Unit), by Application 2024 & 2032
- Figure 77: Asia Pacific Care Management Solutions Industry Revenue Share (%), by Application 2024 & 2032
- Figure 78: Asia Pacific Care Management Solutions Industry Volume Share (%), by Application 2024 & 2032
- Figure 79: Asia Pacific Care Management Solutions Industry Revenue (Million), by End User 2024 & 2032
- Figure 80: Asia Pacific Care Management Solutions Industry Volume (K Unit), by End User 2024 & 2032
- Figure 81: Asia Pacific Care Management Solutions Industry Revenue Share (%), by End User 2024 & 2032
- Figure 82: Asia Pacific Care Management Solutions Industry Volume Share (%), by End User 2024 & 2032
- Figure 83: Asia Pacific Care Management Solutions Industry Revenue (Million), by Country 2024 & 2032
- Figure 84: Asia Pacific Care Management Solutions Industry Volume (K Unit), by Country 2024 & 2032
- Figure 85: Asia Pacific Care Management Solutions Industry Revenue Share (%), by Country 2024 & 2032
- Figure 86: Asia Pacific Care Management Solutions Industry Volume Share (%), by Country 2024 & 2032
- Figure 87: Middle East Care Management Solutions Industry Revenue (Million), by Component 2024 & 2032
- Figure 88: Middle East Care Management Solutions Industry Volume (K Unit), by Component 2024 & 2032
- Figure 89: Middle East Care Management Solutions Industry Revenue Share (%), by Component 2024 & 2032
- Figure 90: Middle East Care Management Solutions Industry Volume Share (%), by Component 2024 & 2032
- Figure 91: Middle East Care Management Solutions Industry Revenue (Million), by Delivery Mode 2024 & 2032
- Figure 92: Middle East Care Management Solutions Industry Volume (K Unit), by Delivery Mode 2024 & 2032
- Figure 93: Middle East Care Management Solutions Industry Revenue Share (%), by Delivery Mode 2024 & 2032
- Figure 94: Middle East Care Management Solutions Industry Volume Share (%), by Delivery Mode 2024 & 2032
- Figure 95: Middle East Care Management Solutions Industry Revenue (Million), by Application 2024 & 2032
- Figure 96: Middle East Care Management Solutions Industry Volume (K Unit), by Application 2024 & 2032
- Figure 97: Middle East Care Management Solutions Industry Revenue Share (%), by Application 2024 & 2032
- Figure 98: Middle East Care Management Solutions Industry Volume Share (%), by Application 2024 & 2032
- Figure 99: Middle East Care Management Solutions Industry Revenue (Million), by End User 2024 & 2032
- Figure 100: Middle East Care Management Solutions Industry Volume (K Unit), by End User 2024 & 2032
- Figure 101: Middle East Care Management Solutions Industry Revenue Share (%), by End User 2024 & 2032
- Figure 102: Middle East Care Management Solutions Industry Volume Share (%), by End User 2024 & 2032
- Figure 103: Middle East Care Management Solutions Industry Revenue (Million), by Country 2024 & 2032
- Figure 104: Middle East Care Management Solutions Industry Volume (K Unit), by Country 2024 & 2032
- Figure 105: Middle East Care Management Solutions Industry Revenue Share (%), by Country 2024 & 2032
- Figure 106: Middle East Care Management Solutions Industry Volume Share (%), by Country 2024 & 2032
- Figure 107: GCC Care Management Solutions Industry Revenue (Million), by Component 2024 & 2032
- Figure 108: GCC Care Management Solutions Industry Volume (K Unit), by Component 2024 & 2032
- Figure 109: GCC Care Management Solutions Industry Revenue Share (%), by Component 2024 & 2032
- Figure 110: GCC Care Management Solutions Industry Volume Share (%), by Component 2024 & 2032
- Figure 111: GCC Care Management Solutions Industry Revenue (Million), by Delivery Mode 2024 & 2032
- Figure 112: GCC Care Management Solutions Industry Volume (K Unit), by Delivery Mode 2024 & 2032
- Figure 113: GCC Care Management Solutions Industry Revenue Share (%), by Delivery Mode 2024 & 2032
- Figure 114: GCC Care Management Solutions Industry Volume Share (%), by Delivery Mode 2024 & 2032
- Figure 115: GCC Care Management Solutions Industry Revenue (Million), by Application 2024 & 2032
- Figure 116: GCC Care Management Solutions Industry Volume (K Unit), by Application 2024 & 2032
- Figure 117: GCC Care Management Solutions Industry Revenue Share (%), by Application 2024 & 2032
- Figure 118: GCC Care Management Solutions Industry Volume Share (%), by Application 2024 & 2032
- Figure 119: GCC Care Management Solutions Industry Revenue (Million), by End User 2024 & 2032
- Figure 120: GCC Care Management Solutions Industry Volume (K Unit), by End User 2024 & 2032
- Figure 121: GCC Care Management Solutions Industry Revenue Share (%), by End User 2024 & 2032
- Figure 122: GCC Care Management Solutions Industry Volume Share (%), by End User 2024 & 2032
- Figure 123: GCC Care Management Solutions Industry Revenue (Million), by Country 2024 & 2032
- Figure 124: GCC Care Management Solutions Industry Volume (K Unit), by Country 2024 & 2032
- Figure 125: GCC Care Management Solutions Industry Revenue Share (%), by Country 2024 & 2032
- Figure 126: GCC Care Management Solutions Industry Volume Share (%), by Country 2024 & 2032
- Figure 127: South America Care Management Solutions Industry Revenue (Million), by Component 2024 & 2032
- Figure 128: South America Care Management Solutions Industry Volume (K Unit), by Component 2024 & 2032
- Figure 129: South America Care Management Solutions Industry Revenue Share (%), by Component 2024 & 2032
- Figure 130: South America Care Management Solutions Industry Volume Share (%), by Component 2024 & 2032
- Figure 131: South America Care Management Solutions Industry Revenue (Million), by Delivery Mode 2024 & 2032
- Figure 132: South America Care Management Solutions Industry Volume (K Unit), by Delivery Mode 2024 & 2032
- Figure 133: South America Care Management Solutions Industry Revenue Share (%), by Delivery Mode 2024 & 2032
- Figure 134: South America Care Management Solutions Industry Volume Share (%), by Delivery Mode 2024 & 2032
- Figure 135: South America Care Management Solutions Industry Revenue (Million), by Application 2024 & 2032
- Figure 136: South America Care Management Solutions Industry Volume (K Unit), by Application 2024 & 2032
- Figure 137: South America Care Management Solutions Industry Revenue Share (%), by Application 2024 & 2032
- Figure 138: South America Care Management Solutions Industry Volume Share (%), by Application 2024 & 2032
- Figure 139: South America Care Management Solutions Industry Revenue (Million), by End User 2024 & 2032
- Figure 140: South America Care Management Solutions Industry Volume (K Unit), by End User 2024 & 2032
- Figure 141: South America Care Management Solutions Industry Revenue Share (%), by End User 2024 & 2032
- Figure 142: South America Care Management Solutions Industry Volume Share (%), by End User 2024 & 2032
- Figure 143: South America Care Management Solutions Industry Revenue (Million), by Country 2024 & 2032
- Figure 144: South America Care Management Solutions Industry Volume (K Unit), by Country 2024 & 2032
- Figure 145: South America Care Management Solutions Industry Revenue Share (%), by Country 2024 & 2032
- Figure 146: South America Care Management Solutions Industry Volume Share (%), by Country 2024 & 2032
List of Tables
- Table 1: Global Care Management Solutions Industry Revenue Million Forecast, by Region 2019 & 2032
- Table 2: Global Care Management Solutions Industry Volume K Unit Forecast, by Region 2019 & 2032
- Table 3: Global Care Management Solutions Industry Revenue Million Forecast, by Component 2019 & 2032
- Table 4: Global Care Management Solutions Industry Volume K Unit Forecast, by Component 2019 & 2032
- Table 5: Global Care Management Solutions Industry Revenue Million Forecast, by Delivery Mode 2019 & 2032
- Table 6: Global Care Management Solutions Industry Volume K Unit Forecast, by Delivery Mode 2019 & 2032
- Table 7: Global Care Management Solutions Industry Revenue Million Forecast, by Application 2019 & 2032
- Table 8: Global Care Management Solutions Industry Volume K Unit Forecast, by Application 2019 & 2032
- Table 9: Global Care Management Solutions Industry Revenue Million Forecast, by End User 2019 & 2032
- Table 10: Global Care Management Solutions Industry Volume K Unit Forecast, by End User 2019 & 2032
- Table 11: Global Care Management Solutions Industry Revenue Million Forecast, by Region 2019 & 2032
- Table 12: Global Care Management Solutions Industry Volume K Unit Forecast, by Region 2019 & 2032
- Table 13: Global Care Management Solutions Industry Revenue Million Forecast, by Country 2019 & 2032
- Table 14: Global Care Management Solutions Industry Volume K Unit Forecast, by Country 2019 & 2032
- Table 15: United States Care Management Solutions Industry Revenue (Million) Forecast, by Application 2019 & 2032
- Table 16: United States Care Management Solutions Industry Volume (K Unit) Forecast, by Application 2019 & 2032
- Table 17: Canada Care Management Solutions Industry Revenue (Million) Forecast, by Application 2019 & 2032
- Table 18: Canada Care Management Solutions Industry Volume (K Unit) Forecast, by Application 2019 & 2032
- Table 19: Mexico Care Management Solutions Industry Revenue (Million) Forecast, by Application 2019 & 2032
- Table 20: Mexico Care Management Solutions Industry Volume (K Unit) Forecast, by Application 2019 & 2032
- Table 21: Global Care Management Solutions Industry Revenue Million Forecast, by Country 2019 & 2032
- Table 22: Global Care Management Solutions Industry Volume K Unit Forecast, by Country 2019 & 2032
- Table 23: Germany Care Management Solutions Industry Revenue (Million) Forecast, by Application 2019 & 2032
- Table 24: Germany Care Management Solutions Industry Volume (K Unit) Forecast, by Application 2019 & 2032
- Table 25: United Kindom Care Management Solutions Industry Revenue (Million) Forecast, by Application 2019 & 2032
- Table 26: United Kindom Care Management Solutions Industry Volume (K Unit) Forecast, by Application 2019 & 2032
- Table 27: France Care Management Solutions Industry Revenue (Million) Forecast, by Application 2019 & 2032
- Table 28: France Care Management Solutions Industry Volume (K Unit) Forecast, by Application 2019 & 2032
- Table 29: Italy Care Management Solutions Industry Revenue (Million) Forecast, by Application 2019 & 2032
- Table 30: Italy Care Management Solutions Industry Volume (K Unit) Forecast, by Application 2019 & 2032
- Table 31: Spain Care Management Solutions Industry Revenue (Million) Forecast, by Application 2019 & 2032
- Table 32: Spain Care Management Solutions Industry Volume (K Unit) Forecast, by Application 2019 & 2032
- Table 33: Rest of Europe Care Management Solutions Industry Revenue (Million) Forecast, by Application 2019 & 2032
- Table 34: Rest of Europe Care Management Solutions Industry Volume (K Unit) Forecast, by Application 2019 & 2032
- Table 35: Global Care Management Solutions Industry Revenue Million Forecast, by Country 2019 & 2032
- Table 36: Global Care Management Solutions Industry Volume K Unit Forecast, by Country 2019 & 2032
- Table 37: China Care Management Solutions Industry Revenue (Million) Forecast, by Application 2019 & 2032
- Table 38: China Care Management Solutions Industry Volume (K Unit) Forecast, by Application 2019 & 2032
- Table 39: Japan Care Management Solutions Industry Revenue (Million) Forecast, by Application 2019 & 2032
- Table 40: Japan Care Management Solutions Industry Volume (K Unit) Forecast, by Application 2019 & 2032
- Table 41: India Care Management Solutions Industry Revenue (Million) Forecast, by Application 2019 & 2032
- Table 42: India Care Management Solutions Industry Volume (K Unit) Forecast, by Application 2019 & 2032
- Table 43: Australia Care Management Solutions Industry Revenue (Million) Forecast, by Application 2019 & 2032
- Table 44: Australia Care Management Solutions Industry Volume (K Unit) Forecast, by Application 2019 & 2032
- Table 45: South Korea Care Management Solutions Industry Revenue (Million) Forecast, by Application 2019 & 2032
- Table 46: South Korea Care Management Solutions Industry Volume (K Unit) Forecast, by Application 2019 & 2032
- Table 47: Rest of Asia Pacific Care Management Solutions Industry Revenue (Million) Forecast, by Application 2019 & 2032
- Table 48: Rest of Asia Pacific Care Management Solutions Industry Volume (K Unit) Forecast, by Application 2019 & 2032
- Table 49: Global Care Management Solutions Industry Revenue Million Forecast, by Country 2019 & 2032
- Table 50: Global Care Management Solutions Industry Volume K Unit Forecast, by Country 2019 & 2032
- Table 51: Care Management Solutions Industry Revenue (Million) Forecast, by Application 2019 & 2032
- Table 52: Care Management Solutions Industry Volume (K Unit) Forecast, by Application 2019 & 2032
- Table 53: Global Care Management Solutions Industry Revenue Million Forecast, by Country 2019 & 2032
- Table 54: Global Care Management Solutions Industry Volume K Unit Forecast, by Country 2019 & 2032
- Table 55: South Africa Care Management Solutions Industry Revenue (Million) Forecast, by Application 2019 & 2032
- Table 56: South Africa Care Management Solutions Industry Volume (K Unit) Forecast, by Application 2019 & 2032
- Table 57: Rest of Middle East and Africa Care Management Solutions Industry Revenue (Million) Forecast, by Application 2019 & 2032
- Table 58: Rest of Middle East and Africa Care Management Solutions Industry Volume (K Unit) Forecast, by Application 2019 & 2032
- Table 59: Global Care Management Solutions Industry Revenue Million Forecast, by Country 2019 & 2032
- Table 60: Global Care Management Solutions Industry Volume K Unit Forecast, by Country 2019 & 2032
- Table 61: Brazil Care Management Solutions Industry Revenue (Million) Forecast, by Application 2019 & 2032
- Table 62: Brazil Care Management Solutions Industry Volume (K Unit) Forecast, by Application 2019 & 2032
- Table 63: Argentina Care Management Solutions Industry Revenue (Million) Forecast, by Application 2019 & 2032
- Table 64: Argentina Care Management Solutions Industry Volume (K Unit) Forecast, by Application 2019 & 2032
- Table 65: Rest of South America Care Management Solutions Industry Revenue (Million) Forecast, by Application 2019 & 2032
- Table 66: Rest of South America Care Management Solutions Industry Volume (K Unit) Forecast, by Application 2019 & 2032
- Table 67: Global Care Management Solutions Industry Revenue Million Forecast, by Component 2019 & 2032
- Table 68: Global Care Management Solutions Industry Volume K Unit Forecast, by Component 2019 & 2032
- Table 69: Global Care Management Solutions Industry Revenue Million Forecast, by Delivery Mode 2019 & 2032
- Table 70: Global Care Management Solutions Industry Volume K Unit Forecast, by Delivery Mode 2019 & 2032
- Table 71: Global Care Management Solutions Industry Revenue Million Forecast, by Application 2019 & 2032
- Table 72: Global Care Management Solutions Industry Volume K Unit Forecast, by Application 2019 & 2032
- Table 73: Global Care Management Solutions Industry Revenue Million Forecast, by End User 2019 & 2032
- Table 74: Global Care Management Solutions Industry Volume K Unit Forecast, by End User 2019 & 2032
- Table 75: Global Care Management Solutions Industry Revenue Million Forecast, by Country 2019 & 2032
- Table 76: Global Care Management Solutions Industry Volume K Unit Forecast, by Country 2019 & 2032
- Table 77: United States Care Management Solutions Industry Revenue (Million) Forecast, by Application 2019 & 2032
- Table 78: United States Care Management Solutions Industry Volume (K Unit) Forecast, by Application 2019 & 2032
- Table 79: Canada Care Management Solutions Industry Revenue (Million) Forecast, by Application 2019 & 2032
- Table 80: Canada Care Management Solutions Industry Volume (K Unit) Forecast, by Application 2019 & 2032
- Table 81: Mexico Care Management Solutions Industry Revenue (Million) Forecast, by Application 2019 & 2032
- Table 82: Mexico Care Management Solutions Industry Volume (K Unit) Forecast, by Application 2019 & 2032
- Table 83: Global Care Management Solutions Industry Revenue Million Forecast, by Component 2019 & 2032
- Table 84: Global Care Management Solutions Industry Volume K Unit Forecast, by Component 2019 & 2032
- Table 85: Global Care Management Solutions Industry Revenue Million Forecast, by Delivery Mode 2019 & 2032
- Table 86: Global Care Management Solutions Industry Volume K Unit Forecast, by Delivery Mode 2019 & 2032
- Table 87: Global Care Management Solutions Industry Revenue Million Forecast, by Application 2019 & 2032
- Table 88: Global Care Management Solutions Industry Volume K Unit Forecast, by Application 2019 & 2032
- Table 89: Global Care Management Solutions Industry Revenue Million Forecast, by End User 2019 & 2032
- Table 90: Global Care Management Solutions Industry Volume K Unit Forecast, by End User 2019 & 2032
- Table 91: Global Care Management Solutions Industry Revenue Million Forecast, by Country 2019 & 2032
- Table 92: Global Care Management Solutions Industry Volume K Unit Forecast, by Country 2019 & 2032
- Table 93: Germany Care Management Solutions Industry Revenue (Million) Forecast, by Application 2019 & 2032
- Table 94: Germany Care Management Solutions Industry Volume (K Unit) Forecast, by Application 2019 & 2032
- Table 95: United Kindom Care Management Solutions Industry Revenue (Million) Forecast, by Application 2019 & 2032
- Table 96: United Kindom Care Management Solutions Industry Volume (K Unit) Forecast, by Application 2019 & 2032
- Table 97: France Care Management Solutions Industry Revenue (Million) Forecast, by Application 2019 & 2032
- Table 98: France Care Management Solutions Industry Volume (K Unit) Forecast, by Application 2019 & 2032
- Table 99: Italy Care Management Solutions Industry Revenue (Million) Forecast, by Application 2019 & 2032
- Table 100: Italy Care Management Solutions Industry Volume (K Unit) Forecast, by Application 2019 & 2032
- Table 101: Spain Care Management Solutions Industry Revenue (Million) Forecast, by Application 2019 & 2032
- Table 102: Spain Care Management Solutions Industry Volume (K Unit) Forecast, by Application 2019 & 2032
- Table 103: Rest of Europe Care Management Solutions Industry Revenue (Million) Forecast, by Application 2019 & 2032
- Table 104: Rest of Europe Care Management Solutions Industry Volume (K Unit) Forecast, by Application 2019 & 2032
- Table 105: Global Care Management Solutions Industry Revenue Million Forecast, by Component 2019 & 2032
- Table 106: Global Care Management Solutions Industry Volume K Unit Forecast, by Component 2019 & 2032
- Table 107: Global Care Management Solutions Industry Revenue Million Forecast, by Delivery Mode 2019 & 2032
- Table 108: Global Care Management Solutions Industry Volume K Unit Forecast, by Delivery Mode 2019 & 2032
- Table 109: Global Care Management Solutions Industry Revenue Million Forecast, by Application 2019 & 2032
- Table 110: Global Care Management Solutions Industry Volume K Unit Forecast, by Application 2019 & 2032
- Table 111: Global Care Management Solutions Industry Revenue Million Forecast, by End User 2019 & 2032
- Table 112: Global Care Management Solutions Industry Volume K Unit Forecast, by End User 2019 & 2032
- Table 113: Global Care Management Solutions Industry Revenue Million Forecast, by Country 2019 & 2032
- Table 114: Global Care Management Solutions Industry Volume K Unit Forecast, by Country 2019 & 2032
- Table 115: China Care Management Solutions Industry Revenue (Million) Forecast, by Application 2019 & 2032
- Table 116: China Care Management Solutions Industry Volume (K Unit) Forecast, by Application 2019 & 2032
- Table 117: Japan Care Management Solutions Industry Revenue (Million) Forecast, by Application 2019 & 2032
- Table 118: Japan Care Management Solutions Industry Volume (K Unit) Forecast, by Application 2019 & 2032
- Table 119: India Care Management Solutions Industry Revenue (Million) Forecast, by Application 2019 & 2032
- Table 120: India Care Management Solutions Industry Volume (K Unit) Forecast, by Application 2019 & 2032
- Table 121: Australia Care Management Solutions Industry Revenue (Million) Forecast, by Application 2019 & 2032
- Table 122: Australia Care Management Solutions Industry Volume (K Unit) Forecast, by Application 2019 & 2032
- Table 123: South Korea Care Management Solutions Industry Revenue (Million) Forecast, by Application 2019 & 2032
- Table 124: South Korea Care Management Solutions Industry Volume (K Unit) Forecast, by Application 2019 & 2032
- Table 125: Rest of Asia Pacific Care Management Solutions Industry Revenue (Million) Forecast, by Application 2019 & 2032
- Table 126: Rest of Asia Pacific Care Management Solutions Industry Volume (K Unit) Forecast, by Application 2019 & 2032
- Table 127: Global Care Management Solutions Industry Revenue Million Forecast, by Component 2019 & 2032
- Table 128: Global Care Management Solutions Industry Volume K Unit Forecast, by Component 2019 & 2032
- Table 129: Global Care Management Solutions Industry Revenue Million Forecast, by Delivery Mode 2019 & 2032
- Table 130: Global Care Management Solutions Industry Volume K Unit Forecast, by Delivery Mode 2019 & 2032
- Table 131: Global Care Management Solutions Industry Revenue Million Forecast, by Application 2019 & 2032
- Table 132: Global Care Management Solutions Industry Volume K Unit Forecast, by Application 2019 & 2032
- Table 133: Global Care Management Solutions Industry Revenue Million Forecast, by End User 2019 & 2032
- Table 134: Global Care Management Solutions Industry Volume K Unit Forecast, by End User 2019 & 2032
- Table 135: Global Care Management Solutions Industry Revenue Million Forecast, by Country 2019 & 2032
- Table 136: Global Care Management Solutions Industry Volume K Unit Forecast, by Country 2019 & 2032
- Table 137: Global Care Management Solutions Industry Revenue Million Forecast, by Component 2019 & 2032
- Table 138: Global Care Management Solutions Industry Volume K Unit Forecast, by Component 2019 & 2032
- Table 139: Global Care Management Solutions Industry Revenue Million Forecast, by Delivery Mode 2019 & 2032
- Table 140: Global Care Management Solutions Industry Volume K Unit Forecast, by Delivery Mode 2019 & 2032
- Table 141: Global Care Management Solutions Industry Revenue Million Forecast, by Application 2019 & 2032
- Table 142: Global Care Management Solutions Industry Volume K Unit Forecast, by Application 2019 & 2032
- Table 143: Global Care Management Solutions Industry Revenue Million Forecast, by End User 2019 & 2032
- Table 144: Global Care Management Solutions Industry Volume K Unit Forecast, by End User 2019 & 2032
- Table 145: Global Care Management Solutions Industry Revenue Million Forecast, by Country 2019 & 2032
- Table 146: Global Care Management Solutions Industry Volume K Unit Forecast, by Country 2019 & 2032
- Table 147: South Africa Care Management Solutions Industry Revenue (Million) Forecast, by Application 2019 & 2032
- Table 148: South Africa Care Management Solutions Industry Volume (K Unit) Forecast, by Application 2019 & 2032
- Table 149: Rest of Middle East and Africa Care Management Solutions Industry Revenue (Million) Forecast, by Application 2019 & 2032
- Table 150: Rest of Middle East and Africa Care Management Solutions Industry Volume (K Unit) Forecast, by Application 2019 & 2032
- Table 151: Global Care Management Solutions Industry Revenue Million Forecast, by Component 2019 & 2032
- Table 152: Global Care Management Solutions Industry Volume K Unit Forecast, by Component 2019 & 2032
- Table 153: Global Care Management Solutions Industry Revenue Million Forecast, by Delivery Mode 2019 & 2032
- Table 154: Global Care Management Solutions Industry Volume K Unit Forecast, by Delivery Mode 2019 & 2032
- Table 155: Global Care Management Solutions Industry Revenue Million Forecast, by Application 2019 & 2032
- Table 156: Global Care Management Solutions Industry Volume K Unit Forecast, by Application 2019 & 2032
- Table 157: Global Care Management Solutions Industry Revenue Million Forecast, by End User 2019 & 2032
- Table 158: Global Care Management Solutions Industry Volume K Unit Forecast, by End User 2019 & 2032
- Table 159: Global Care Management Solutions Industry Revenue Million Forecast, by Country 2019 & 2032
- Table 160: Global Care Management Solutions Industry Volume K Unit Forecast, by Country 2019 & 2032
- Table 161: Brazil Care Management Solutions Industry Revenue (Million) Forecast, by Application 2019 & 2032
- Table 162: Brazil Care Management Solutions Industry Volume (K Unit) Forecast, by Application 2019 & 2032
- Table 163: Argentina Care Management Solutions Industry Revenue (Million) Forecast, by Application 2019 & 2032
- Table 164: Argentina Care Management Solutions Industry Volume (K Unit) Forecast, by Application 2019 & 2032
- Table 165: Rest of South America Care Management Solutions Industry Revenue (Million) Forecast, by Application 2019 & 2032
- Table 166: Rest of South America Care Management Solutions Industry Volume (K Unit) Forecast, by Application 2019 & 2032
Frequently Asked Questions
1. What is the projected Compound Annual Growth Rate (CAGR) of the Care Management Solutions Industry?
The projected CAGR is approximately 12.23%.
2. Which companies are prominent players in the Care Management Solutions Industry?
Key companies in the market include Zeomega Inc, Medecision Inc, Phytel Inc (IBM Corporation), Cognizant, I2I Systems Inc, Centene Corporation (Evolve), Veradigm, InfoMC, Infosys Limited, Convey Health Solutions, Optum Inc, EPIC Corporation Inc, Exl Healthcare, Hinduja Global Solutions Limited.
3. What are the main segments of the Care Management Solutions Industry?
The market segments include Component, Delivery Mode, Application, End User.
4. Can you provide details about the market size?
The market size is estimated to be USD 15.03 Million as of 2022.
5. What are some drivers contributing to market growth?
Rising Geriatric Population and Burden of Chronic Diseases; Care Management Solutions Offer a Means to Reduce Healthcare Costs; Government Initiatives on Healthcare Services and Infrastructure.
6. What are the notable trends driving market growth?
Chronic Care Management Segment Expected to Hold a Significant Share in the Care Management Solutions Market.
7. Are there any restraints impacting market growth?
High Investments Required for Supporting Infrastructure; Data Security Concerns Related to Cloud-based Solutions.
8. Can you provide examples of recent developments in the market?
April 2023: Medecision, a provider of digital care management solutions and services, launched Aerial Social Care Coordinator, a cutting-edge solution designed to provide health plans and healthcare providers with immediate insight into individuals' social determinants of health barriers.
9. What pricing options are available for accessing the report?
Pricing options include single-user, multi-user, and enterprise licenses priced at USD 4750, USD 5250, and USD 8750 respectively.
10. Is the market size provided in terms of value or volume?
The market size is provided in terms of value, measured in Million and volume, measured in K Unit.
11. Are there any specific market keywords associated with the report?
Yes, the market keyword associated with the report is "Care Management Solutions Industry," which aids in identifying and referencing the specific market segment covered.
12. How do I determine which pricing option suits my needs best?
The pricing options vary based on user requirements and access needs. Individual users may opt for single-user licenses, while businesses requiring broader access may choose multi-user or enterprise licenses for cost-effective access to the report.
13. Are there any additional resources or data provided in the Care Management Solutions Industry report?
While the report offers comprehensive insights, it's advisable to review the specific contents or supplementary materials provided to ascertain if additional resources or data are available.
14. How can I stay updated on further developments or reports in the Care Management Solutions Industry?
To stay informed about further developments, trends, and reports in the Care Management Solutions Industry, consider subscribing to industry newsletters, following relevant companies and organizations, or regularly checking reputable industry news sources and publications.
Methodology
Step 1 - Identification of Relevant Samples Size from Population Database


Step 2 - Approaches for Defining Global Market Size (Value, Volume* & Price*)

Note*: In applicable scenarios
Step 3 - Data Sources
Primary Research
- Web Analytics
- Survey Reports
- Research Institute
- Latest Research Reports
- Opinion Leaders
Secondary Research
- Annual Reports
- White Paper
- Latest Press Release
- Industry Association
- Paid Database
- Investor Presentations

Step 4 - Data Triangulation
Involves using different sources of information in order to increase the validity of a study
These sources are likely to be stakeholders in a program - participants, other researchers, program staff, other community members, and so on.
Then we put all data in single framework & apply various statistical tools to find out the dynamic on the market.
During the analysis stage, feedback from the stakeholder groups would be compared to determine areas of agreement as well as areas of divergence


