
Key Insights
The biobetter market, exhibiting a robust CAGR of 7.80% from 2019 to 2024, is poised for significant growth from 2025 to 2033. This expansion is driven by several key factors. Increasing prevalence of chronic diseases like cancer, diabetes, and renal diseases fuels demand for effective and safer biologics. Advancements in biotechnology, particularly in biosimilar and biobetter development, are leading to improved efficacy, reduced immunogenicity, and extended half-lives, making them attractive alternatives to originator biologics. The rising geriatric population globally further contributes to the market's growth, as this demographic is more susceptible to chronic illnesses requiring biological therapies. Furthermore, growing investments in research and development by pharmaceutical companies, coupled with supportive regulatory frameworks in key markets, are accelerating the market's trajectory. The market is segmented by route of administration (subcutaneous, oral, inhaled, intravenous), distribution channel (hospital, retail, online pharmacies), and drug class (erythropoietin, insulin, G-CSF biobetters, monoclonal antibodies, and others), offering diverse avenues for growth. Specific application areas, such as oncology, diabetes management, and treatment of rare genetic disorders, represent substantial market segments within this expanding landscape.
Competition within the biobetter market is fierce, with major players like Sanofi, Amgen, Merck, Eli Lilly, Roche, Novo Nordisk, Pfizer, Biogen, CSL Behring, and Genentech vying for market share. These established players leverage their extensive research capabilities, strong distribution networks, and brand recognition to maintain a competitive edge. However, the market also presents opportunities for emerging biotech companies specializing in niche therapeutic areas or innovative biobetter development technologies. Geographic variations in market growth are expected, with North America and Europe likely to retain significant market shares due to higher healthcare expenditure and advanced healthcare infrastructure. However, rapidly developing economies in Asia-Pacific and other regions are projected to show impressive growth rates fueled by increasing healthcare awareness and rising disposable incomes. The ongoing focus on cost-effectiveness in healthcare systems globally will likely influence the adoption of biobetters over their originator counterparts, further contributing to the market's robust expansion in the coming years.
Biobetter Market: A Comprehensive Report (2019-2033)
This detailed report provides a comprehensive analysis of the global biobetter market, encompassing market size, segmentation, competitive landscape, and future growth projections from 2019 to 2033. With a base year of 2025 and an estimated year of 2025, this report offers invaluable insights for industry stakeholders, investors, and researchers seeking to understand and capitalize on the burgeoning biobetter market. The study period covers 2019-2033, with a forecast period of 2025-2033 and a historical period of 2019-2024. The market is expected to reach xx Million by 2033, exhibiting a CAGR of xx% during the forecast period.
Biobetter Market Market Structure & Competitive Dynamics
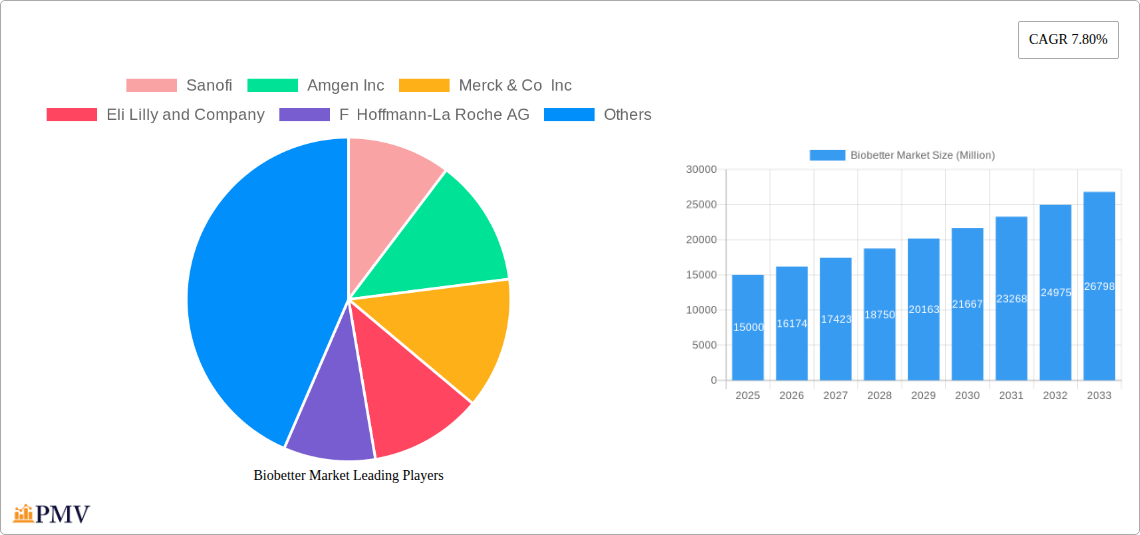
The biobetter market is characterized by a moderately concentrated structure, with a few large multinational pharmaceutical companies holding significant market share. Key players such as Sanofi, Amgen Inc, Merck & Co Inc, Eli Lilly and Company, F Hoffmann-La Roche AG, Novo Nordisk A/S, Pfizer Inc, Biogen Inc, CSL Behring, and Genentech USA Inc dominate the landscape, engaging in intense competition driven by innovation and market share. Market concentration is estimated at xx% in 2025, primarily due to the high capital investment required for R&D and regulatory approval.
The competitive landscape is further shaped by a dynamic innovation ecosystem involving smaller biotech firms focusing on niche therapeutic areas and novel delivery mechanisms. This collaborative landscape includes extensive M&A activities, with deal values exceeding xx Million in the last five years. Notable M&A activities include [Insert Specific Examples if available, otherwise, replace with "strategic partnerships and acquisitions aimed at expanding product portfolios and geographic reach"].
- Market Share: Sanofi holds an estimated xx% market share, followed by Amgen Inc with xx%. Other leading players hold shares ranging from xx% to xx%.
- Innovation Ecosystems: Collaborative R&D and licensing agreements are prevalent, driving technological advancements.
- Regulatory Frameworks: Stringent regulatory approvals influence market entry and product lifecycle management. Variations in regulatory pathways across different regions create opportunities and challenges.
- Product Substitutes: Biosimilars pose significant competitive pressure, necessitating continuous innovation in biobetter design and manufacturing.
- End-User Trends: Increasing demand for innovative and efficacious therapies drives growth, especially in areas such as oncology, immunology, and diabetes.
- M&A Activities: Consolidation activities are expected to continue, driven by the need to enhance economies of scale and streamline operations.
Biobetter Market Industry Trends & Insights
The global biobetter market is experiencing robust growth fueled by several key factors. Technological advancements in biopharmaceutical manufacturing, leading to improved efficacy and safety profiles of biobetters, are a significant driver. The rising prevalence of chronic diseases like cancer, diabetes, and autoimmune disorders is another key driver, increasing the demand for advanced biological therapies. Growing adoption of subcutaneous and other innovative routes of administration further contributes to market expansion.
Consumer preferences are shifting toward personalized medicine, demanding targeted and effective therapies. Consequently, biobetter developers are focusing on personalized and targeted therapeutics to enhance treatment outcomes and patient adherence. The increasing availability of biosimilars is creating price competition, pushing biobetter developers to emphasize their unique advantages and value proposition. The CAGR of the biobetter market during the forecast period is estimated at xx%, driven by increasing R&D investment and technological innovations.
Dominant Markets & Segments in Biobetter Market
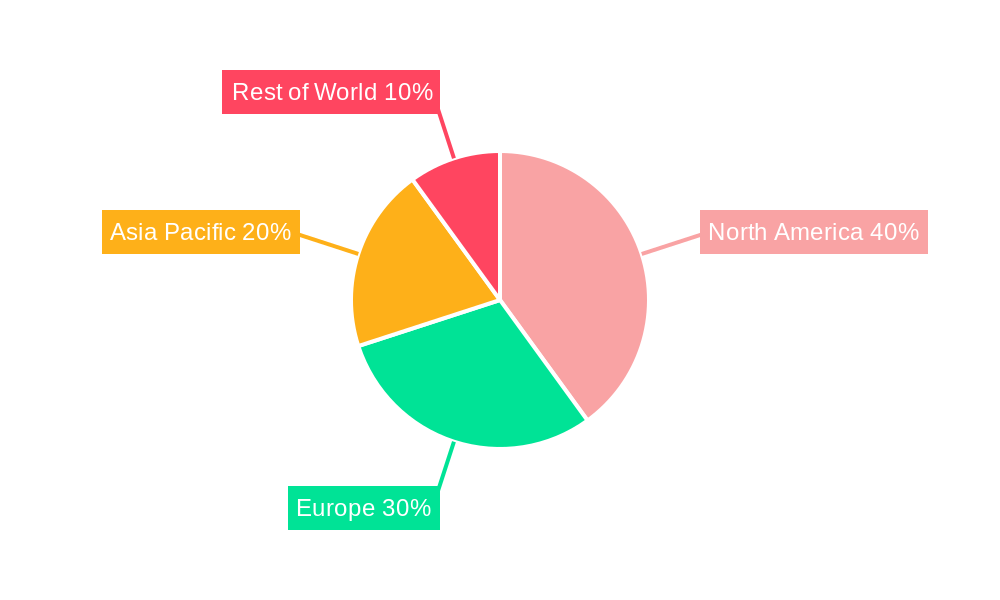
The North American region currently dominates the biobetter market, driven by high healthcare expenditure, robust R&D infrastructure, and early adoption of novel therapies. Within North America, the United States holds the largest market share. Europe follows closely, showcasing significant growth potential driven by increasing healthcare expenditure and a favorable regulatory environment. Asia-Pacific is also expected to witness considerable growth, driven by expanding healthcare infrastructure and growing awareness regarding advanced biological therapies.
Dominant Segments:
- Route of Administration: Subcutaneous administration is the leading segment due to its convenience and improved patient compliance.
- Distribution Channel: Hospital pharmacies are currently the largest distribution channel, but online pharmacies are experiencing rapid growth, increasing access to therapies.
- Drug Class: Monoclonal antibody biobetters represent the largest drug class due to their wide range of therapeutic applications.
- Application: Cancer treatment holds the leading position, owing to the increasing prevalence of various cancer types and the efficacy of biobetter therapies.
Key Drivers of Regional Dominance:
- North America: High healthcare spending, robust R&D investment, and early adoption of innovative technologies.
- Europe: Favorable regulatory environment and increasing focus on advanced therapies.
- Asia-Pacific: Expanding healthcare infrastructure and growing awareness about advanced therapies.
Biobetter Market Product Innovations
Recent product innovations focus on enhancing efficacy, safety, and convenience. This includes advancements in targeted delivery systems, such as improved formulations for subcutaneous and inhaled administration. New biobetter designs are incorporating advanced conjugation technologies and bioengineering techniques to improve therapeutic efficacy. Competition emphasizes differentiated value propositions, including enhanced pharmacokinetics and pharmacodynamics, along with reduced immunogenicity.
Report Segmentation & Scope
This report segments the biobetter market across various parameters:
- Route of Administration: Subcutaneous, Oral, Inhaled, Intravenous, Others (with market size and growth projections for each).
- Distribution Channel: Hospital Pharmacies, Retail Pharmacies, Online Pharmacies (with market share and growth trends).
- Drug Class: Erythropoietin Biobetters, Insulin Biobetters, G-CSF Bioreactors, Monoclonal Antibodies Biobetters, Anti-Haemophilic Factor, Other Biological Drug Biobetters (with detailed analysis of each class's market dynamics).
- Application: Cancer, Diabetes, Renal Disease, Neurodegenerative Disease, Genetic Disorders, Others (with growth projections and competitive landscapes for each application area). Each segment's competitive dynamics are analyzed, highlighting key players and their strategies.
Key Drivers of Biobetter Market Growth
Several key factors drive the growth of the biobetter market: Technological advancements leading to improved efficacy and safety profiles; rising prevalence of chronic diseases; increasing demand for convenient and patient-friendly formulations; regulatory support and incentives for biobetter development; growing investments in R&D. Government initiatives promoting innovation in the biopharmaceutical sector further contribute to market growth.
Challenges in the Biobetter Market Sector
The biobetter market faces challenges such as stringent regulatory pathways, requiring substantial investment and time for product approvals. The high cost of development and manufacturing also poses a significant barrier. Competition from biosimilars puts pressure on pricing and profitability. Supply chain complexities and potential shortages of raw materials can impact production.
Leading Players in the Biobetter Market Market
- Sanofi
- Amgen Inc
- Merck & Co Inc
- Eli Lilly and Company
- F Hoffmann-La Roche AG
- Novo Nordisk A/S
- Pfizer Inc
- Biogen Inc
- CSL Behring
- Genentech USA Inc
Key Developments in Biobetter Market Sector
- January 2023: Celltrion Healthcare submitted a BLA for Remsima SC, a subcutaneous formulation of infliximab. This development expands treatment options and potentially improves patient compliance.
- December 2022: Japan approved Gazyva (obinutuzumab) for an additional indication in chronic lymphocytic leukemia. This approval broadens the market for this biobetter agent.
Strategic Biobetter Market Market Outlook
The biobetter market holds substantial growth potential, driven by continuous innovation in drug design and delivery systems. Strategic partnerships and acquisitions will likely shape the industry landscape, while increasing focus on personalized medicine and advanced therapeutic modalities will propel future growth. Expansion into emerging markets and the development of novel biobetter therapies targeting unmet medical needs offer significant opportunities for market players.
Biobetter Market Segmentation
-
1. Drug Class
- 1.1. Erythropoietin Biobetters
- 1.2. Insulin Biobetters
- 1.3. G-CSF Bioreactors
- 1.4. Monoclonal Antibodies Biobetters
- 1.5. Anti-Haemophilic Factor
- 1.6. Other Biological Drug Biobetters
-
2. Application
- 2.1. Cancer
- 2.2. Diabetes
- 2.3. Renal Disease
- 2.4. Neurodegenerative Disease
- 2.5. Genetic Disorders
- 2.6. Others
-
3. Route of Administration
- 3.1. Subcutaneous
- 3.2. Oral
- 3.3. Inhaled
- 3.4. Intravenous
- 3.5. Others
-
4. Distribution Channel
- 4.1. Hospital Pharmacies
- 4.2. Retail Pharmacies
- 4.3. Online Pharmacies
Biobetter Market Segmentation By Geography
-
1. North America
- 1.1. United States
- 1.2. Canada
- 1.3. Mexico
-
2. Europe
- 2.1. Germany
- 2.2. United Kingdom
- 2.3. France
- 2.4. Italy
- 2.5. Spain
- 2.6. Rest of Europe
-
3. Asia Pacific
- 3.1. China
- 3.2. Japan
- 3.3. India
- 3.4. Australia
- 3.5. South Korea
- 3.6. Rest of Asia Pacific
-
4. Middle East and Africa
- 4.1. GCC
- 4.2. South Africa
- 4.3. Rest of Middle East and Africa
-
5. South America
- 5.1. Brazil
- 5.2. Argentina
- 5.3. Rest of South America
Biobetter Market REPORT HIGHLIGHTS
| Aspects | Details |
|---|---|
| Study Period | 2019-2033 |
| Base Year | 2024 |
| Estimated Year | 2025 |
| Forecast Period | 2025-2033 |
| Historical Period | 2019-2024 |
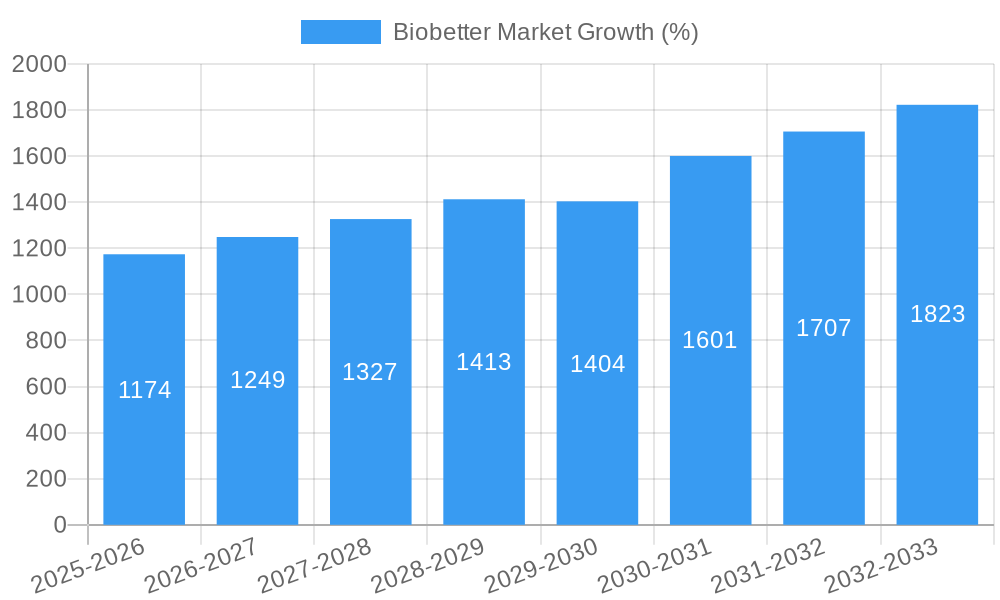
| Growth Rate | CAGR of 7.80% from 2019-2033 |
| Segmentation |
|
Table of Contents
- 1. Introduction
- 1.1. Research Scope
- 1.2. Market Segmentation
- 1.3. Research Methodology
- 1.4. Definitions and Assumptions
- 2. Executive Summary
- 2.1. Introduction
- 3. Market Dynamics
- 3.1. Introduction
- 3.2. Market Drivers
- 3.2.1. Superior Therapeutic Efficacy and Lower Adverse Effects; Comparatively Easier and Less Costly Manufacturing Processes; Non- Patent and Market Exclusivity; Longer product Half-life and Less Dosing Frequency; High Investment Opportunities
- 3.3. Market Restrains
- 3.3.1. High Investment in Research and Development; Increasing Biosimilar Competition
- 3.4. Market Trends
- 3.4.1. Cancer Segment is Expected to Hold a Significant Market Share Over the Forecast Period
- 4. Market Factor Analysis
- 4.1. Porters Five Forces
- 4.2. Supply/Value Chain
- 4.3. PESTEL analysis
- 4.4. Market Entropy
- 4.5. Patent/Trademark Analysis
- 5. Global Biobetter Market Analysis, Insights and Forecast, 2019-2031
- 5.1. Market Analysis, Insights and Forecast - by Drug Class
- 5.1.1. Erythropoietin Biobetters
- 5.1.2. Insulin Biobetters
- 5.1.3. G-CSF Bioreactors
- 5.1.4. Monoclonal Antibodies Biobetters
- 5.1.5. Anti-Haemophilic Factor
- 5.1.6. Other Biological Drug Biobetters
- 5.2. Market Analysis, Insights and Forecast - by Application
- 5.2.1. Cancer
- 5.2.2. Diabetes
- 5.2.3. Renal Disease
- 5.2.4. Neurodegenerative Disease
- 5.2.5. Genetic Disorders
- 5.2.6. Others
- 5.3. Market Analysis, Insights and Forecast - by Route of Administration
- 5.3.1. Subcutaneous
- 5.3.2. Oral
- 5.3.3. Inhaled
- 5.3.4. Intravenous
- 5.3.5. Others
- 5.4. Market Analysis, Insights and Forecast - by Distribution Channel
- 5.4.1. Hospital Pharmacies
- 5.4.2. Retail Pharmacies
- 5.4.3. Online Pharmacies
- 5.5. Market Analysis, Insights and Forecast - by Region
- 5.5.1. North America
- 5.5.2. Europe
- 5.5.3. Asia Pacific
- 5.5.4. Middle East and Africa
- 5.5.5. South America
- 5.1. Market Analysis, Insights and Forecast - by Drug Class
- 6. North America Biobetter Market Analysis, Insights and Forecast, 2019-2031
- 6.1. Market Analysis, Insights and Forecast - by Drug Class
- 6.1.1. Erythropoietin Biobetters
- 6.1.2. Insulin Biobetters
- 6.1.3. G-CSF Bioreactors
- 6.1.4. Monoclonal Antibodies Biobetters
- 6.1.5. Anti-Haemophilic Factor
- 6.1.6. Other Biological Drug Biobetters
- 6.2. Market Analysis, Insights and Forecast - by Application
- 6.2.1. Cancer
- 6.2.2. Diabetes
- 6.2.3. Renal Disease
- 6.2.4. Neurodegenerative Disease
- 6.2.5. Genetic Disorders
- 6.2.6. Others
- 6.3. Market Analysis, Insights and Forecast - by Route of Administration
- 6.3.1. Subcutaneous
- 6.3.2. Oral
- 6.3.3. Inhaled
- 6.3.4. Intravenous
- 6.3.5. Others
- 6.4. Market Analysis, Insights and Forecast - by Distribution Channel
- 6.4.1. Hospital Pharmacies
- 6.4.2. Retail Pharmacies
- 6.4.3. Online Pharmacies
- 6.1. Market Analysis, Insights and Forecast - by Drug Class
- 7. Europe Biobetter Market Analysis, Insights and Forecast, 2019-2031
- 7.1. Market Analysis, Insights and Forecast - by Drug Class
- 7.1.1. Erythropoietin Biobetters
- 7.1.2. Insulin Biobetters
- 7.1.3. G-CSF Bioreactors
- 7.1.4. Monoclonal Antibodies Biobetters
- 7.1.5. Anti-Haemophilic Factor
- 7.1.6. Other Biological Drug Biobetters
- 7.2. Market Analysis, Insights and Forecast - by Application
- 7.2.1. Cancer
- 7.2.2. Diabetes
- 7.2.3. Renal Disease
- 7.2.4. Neurodegenerative Disease
- 7.2.5. Genetic Disorders
- 7.2.6. Others
- 7.3. Market Analysis, Insights and Forecast - by Route of Administration
- 7.3.1. Subcutaneous
- 7.3.2. Oral
- 7.3.3. Inhaled
- 7.3.4. Intravenous
- 7.3.5. Others
- 7.4. Market Analysis, Insights and Forecast - by Distribution Channel
- 7.4.1. Hospital Pharmacies
- 7.4.2. Retail Pharmacies
- 7.4.3. Online Pharmacies
- 7.1. Market Analysis, Insights and Forecast - by Drug Class
- 8. Asia Pacific Biobetter Market Analysis, Insights and Forecast, 2019-2031
- 8.1. Market Analysis, Insights and Forecast - by Drug Class
- 8.1.1. Erythropoietin Biobetters
- 8.1.2. Insulin Biobetters
- 8.1.3. G-CSF Bioreactors
- 8.1.4. Monoclonal Antibodies Biobetters
- 8.1.5. Anti-Haemophilic Factor
- 8.1.6. Other Biological Drug Biobetters
- 8.2. Market Analysis, Insights and Forecast - by Application
- 8.2.1. Cancer
- 8.2.2. Diabetes
- 8.2.3. Renal Disease
- 8.2.4. Neurodegenerative Disease
- 8.2.5. Genetic Disorders
- 8.2.6. Others
- 8.3. Market Analysis, Insights and Forecast - by Route of Administration
- 8.3.1. Subcutaneous
- 8.3.2. Oral
- 8.3.3. Inhaled
- 8.3.4. Intravenous
- 8.3.5. Others
- 8.4. Market Analysis, Insights and Forecast - by Distribution Channel
- 8.4.1. Hospital Pharmacies
- 8.4.2. Retail Pharmacies
- 8.4.3. Online Pharmacies
- 8.1. Market Analysis, Insights and Forecast - by Drug Class
- 9. Middle East and Africa Biobetter Market Analysis, Insights and Forecast, 2019-2031
- 9.1. Market Analysis, Insights and Forecast - by Drug Class
- 9.1.1. Erythropoietin Biobetters
- 9.1.2. Insulin Biobetters
- 9.1.3. G-CSF Bioreactors
- 9.1.4. Monoclonal Antibodies Biobetters
- 9.1.5. Anti-Haemophilic Factor
- 9.1.6. Other Biological Drug Biobetters
- 9.2. Market Analysis, Insights and Forecast - by Application
- 9.2.1. Cancer
- 9.2.2. Diabetes
- 9.2.3. Renal Disease
- 9.2.4. Neurodegenerative Disease
- 9.2.5. Genetic Disorders
- 9.2.6. Others
- 9.3. Market Analysis, Insights and Forecast - by Route of Administration
- 9.3.1. Subcutaneous
- 9.3.2. Oral
- 9.3.3. Inhaled
- 9.3.4. Intravenous
- 9.3.5. Others
- 9.4. Market Analysis, Insights and Forecast - by Distribution Channel
- 9.4.1. Hospital Pharmacies
- 9.4.2. Retail Pharmacies
- 9.4.3. Online Pharmacies
- 9.1. Market Analysis, Insights and Forecast - by Drug Class
- 10. South America Biobetter Market Analysis, Insights and Forecast, 2019-2031
- 10.1. Market Analysis, Insights and Forecast - by Drug Class
- 10.1.1. Erythropoietin Biobetters
- 10.1.2. Insulin Biobetters
- 10.1.3. G-CSF Bioreactors
- 10.1.4. Monoclonal Antibodies Biobetters
- 10.1.5. Anti-Haemophilic Factor
- 10.1.6. Other Biological Drug Biobetters
- 10.2. Market Analysis, Insights and Forecast - by Application
- 10.2.1. Cancer
- 10.2.2. Diabetes
- 10.2.3. Renal Disease
- 10.2.4. Neurodegenerative Disease
- 10.2.5. Genetic Disorders
- 10.2.6. Others
- 10.3. Market Analysis, Insights and Forecast - by Route of Administration
- 10.3.1. Subcutaneous
- 10.3.2. Oral
- 10.3.3. Inhaled
- 10.3.4. Intravenous
- 10.3.5. Others
- 10.4. Market Analysis, Insights and Forecast - by Distribution Channel
- 10.4.1. Hospital Pharmacies
- 10.4.2. Retail Pharmacies
- 10.4.3. Online Pharmacies
- 10.1. Market Analysis, Insights and Forecast - by Drug Class
- 11. North America Biobetter Market Analysis, Insights and Forecast, 2019-2031
- 11.1. Market Analysis, Insights and Forecast - By Country/Sub-region
- 11.1.1 United States
- 11.1.2 Canada
- 11.1.3 Mexico
- 12. Europe Biobetter Market Analysis, Insights and Forecast, 2019-2031
- 12.1. Market Analysis, Insights and Forecast - By Country/Sub-region
- 12.1.1 Germany
- 12.1.2 United Kingdom
- 12.1.3 France
- 12.1.4 Italy
- 12.1.5 Spain
- 12.1.6 Rest of Europe
- 13. Asia Pacific Biobetter Market Analysis, Insights and Forecast, 2019-2031
- 13.1. Market Analysis, Insights and Forecast - By Country/Sub-region
- 13.1.1 China
- 13.1.2 Japan
- 13.1.3 India
- 13.1.4 Australia
- 13.1.5 South Korea
- 13.1.6 Rest of Asia Pacific
- 14. Middle East and Africa Biobetter Market Analysis, Insights and Forecast, 2019-2031
- 14.1. Market Analysis, Insights and Forecast - By Country/Sub-region
- 14.1.1 GCC
- 14.1.2 South Africa
- 14.1.3 Rest of Middle East and Africa
- 15. South America Biobetter Market Analysis, Insights and Forecast, 2019-2031
- 15.1. Market Analysis, Insights and Forecast - By Country/Sub-region
- 15.1.1 Brazil
- 15.1.2 Argentina
- 15.1.3 Rest of South America
- 16. Competitive Analysis
- 16.1. Global Market Share Analysis 2024
- 16.2. Company Profiles
- 16.2.1 Sanofi
- 16.2.1.1. Overview
- 16.2.1.2. Products
- 16.2.1.3. SWOT Analysis
- 16.2.1.4. Recent Developments
- 16.2.1.5. Financials (Based on Availability)
- 16.2.2 Amgen Inc
- 16.2.2.1. Overview
- 16.2.2.2. Products
- 16.2.2.3. SWOT Analysis
- 16.2.2.4. Recent Developments
- 16.2.2.5. Financials (Based on Availability)
- 16.2.3 Merck & Co Inc
- 16.2.3.1. Overview
- 16.2.3.2. Products
- 16.2.3.3. SWOT Analysis
- 16.2.3.4. Recent Developments
- 16.2.3.5. Financials (Based on Availability)
- 16.2.4 Eli Lilly and Company
- 16.2.4.1. Overview
- 16.2.4.2. Products
- 16.2.4.3. SWOT Analysis
- 16.2.4.4. Recent Developments
- 16.2.4.5. Financials (Based on Availability)
- 16.2.5 F Hoffmann-La Roche AG
- 16.2.5.1. Overview
- 16.2.5.2. Products
- 16.2.5.3. SWOT Analysis
- 16.2.5.4. Recent Developments
- 16.2.5.5. Financials (Based on Availability)
- 16.2.6 Novo Nordisk A/S
- 16.2.6.1. Overview
- 16.2.6.2. Products
- 16.2.6.3. SWOT Analysis
- 16.2.6.4. Recent Developments
- 16.2.6.5. Financials (Based on Availability)
- 16.2.7 Pfizer Inc
- 16.2.7.1. Overview
- 16.2.7.2. Products
- 16.2.7.3. SWOT Analysis
- 16.2.7.4. Recent Developments
- 16.2.7.5. Financials (Based on Availability)
- 16.2.8 Biogen Inc
- 16.2.8.1. Overview
- 16.2.8.2. Products
- 16.2.8.3. SWOT Analysis
- 16.2.8.4. Recent Developments
- 16.2.8.5. Financials (Based on Availability)
- 16.2.9 CSL Behring
- 16.2.9.1. Overview
- 16.2.9.2. Products
- 16.2.9.3. SWOT Analysis
- 16.2.9.4. Recent Developments
- 16.2.9.5. Financials (Based on Availability)
- 16.2.10 Genentech USA Inc
- 16.2.10.1. Overview
- 16.2.10.2. Products
- 16.2.10.3. SWOT Analysis
- 16.2.10.4. Recent Developments
- 16.2.10.5. Financials (Based on Availability)
- 16.2.1 Sanofi
List of Figures
- Figure 1: Global Biobetter Market Revenue Breakdown (Million, %) by Region 2024 & 2032
- Figure 2: Global Biobetter Market Volume Breakdown (K Unit, %) by Region 2024 & 2032
- Figure 3: North America Biobetter Market Revenue (Million), by Country 2024 & 2032
- Figure 4: North America Biobetter Market Volume (K Unit), by Country 2024 & 2032
- Figure 5: North America Biobetter Market Revenue Share (%), by Country 2024 & 2032
- Figure 6: North America Biobetter Market Volume Share (%), by Country 2024 & 2032
- Figure 7: Europe Biobetter Market Revenue (Million), by Country 2024 & 2032
- Figure 8: Europe Biobetter Market Volume (K Unit), by Country 2024 & 2032
- Figure 9: Europe Biobetter Market Revenue Share (%), by Country 2024 & 2032
- Figure 10: Europe Biobetter Market Volume Share (%), by Country 2024 & 2032
- Figure 11: Asia Pacific Biobetter Market Revenue (Million), by Country 2024 & 2032
- Figure 12: Asia Pacific Biobetter Market Volume (K Unit), by Country 2024 & 2032
- Figure 13: Asia Pacific Biobetter Market Revenue Share (%), by Country 2024 & 2032
- Figure 14: Asia Pacific Biobetter Market Volume Share (%), by Country 2024 & 2032
- Figure 15: Middle East and Africa Biobetter Market Revenue (Million), by Country 2024 & 2032
- Figure 16: Middle East and Africa Biobetter Market Volume (K Unit), by Country 2024 & 2032
- Figure 17: Middle East and Africa Biobetter Market Revenue Share (%), by Country 2024 & 2032
- Figure 18: Middle East and Africa Biobetter Market Volume Share (%), by Country 2024 & 2032
- Figure 19: South America Biobetter Market Revenue (Million), by Country 2024 & 2032
- Figure 20: South America Biobetter Market Volume (K Unit), by Country 2024 & 2032
- Figure 21: South America Biobetter Market Revenue Share (%), by Country 2024 & 2032
- Figure 22: South America Biobetter Market Volume Share (%), by Country 2024 & 2032
- Figure 23: North America Biobetter Market Revenue (Million), by Drug Class 2024 & 2032
- Figure 24: North America Biobetter Market Volume (K Unit), by Drug Class 2024 & 2032
- Figure 25: North America Biobetter Market Revenue Share (%), by Drug Class 2024 & 2032
- Figure 26: North America Biobetter Market Volume Share (%), by Drug Class 2024 & 2032
- Figure 27: North America Biobetter Market Revenue (Million), by Application 2024 & 2032
- Figure 28: North America Biobetter Market Volume (K Unit), by Application 2024 & 2032
- Figure 29: North America Biobetter Market Revenue Share (%), by Application 2024 & 2032
- Figure 30: North America Biobetter Market Volume Share (%), by Application 2024 & 2032
- Figure 31: North America Biobetter Market Revenue (Million), by Route of Administration 2024 & 2032
- Figure 32: North America Biobetter Market Volume (K Unit), by Route of Administration 2024 & 2032
- Figure 33: North America Biobetter Market Revenue Share (%), by Route of Administration 2024 & 2032
- Figure 34: North America Biobetter Market Volume Share (%), by Route of Administration 2024 & 2032
- Figure 35: North America Biobetter Market Revenue (Million), by Distribution Channel 2024 & 2032
- Figure 36: North America Biobetter Market Volume (K Unit), by Distribution Channel 2024 & 2032
- Figure 37: North America Biobetter Market Revenue Share (%), by Distribution Channel 2024 & 2032
- Figure 38: North America Biobetter Market Volume Share (%), by Distribution Channel 2024 & 2032
- Figure 39: North America Biobetter Market Revenue (Million), by Country 2024 & 2032
- Figure 40: North America Biobetter Market Volume (K Unit), by Country 2024 & 2032
- Figure 41: North America Biobetter Market Revenue Share (%), by Country 2024 & 2032
- Figure 42: North America Biobetter Market Volume Share (%), by Country 2024 & 2032
- Figure 43: Europe Biobetter Market Revenue (Million), by Drug Class 2024 & 2032
- Figure 44: Europe Biobetter Market Volume (K Unit), by Drug Class 2024 & 2032
- Figure 45: Europe Biobetter Market Revenue Share (%), by Drug Class 2024 & 2032
- Figure 46: Europe Biobetter Market Volume Share (%), by Drug Class 2024 & 2032
- Figure 47: Europe Biobetter Market Revenue (Million), by Application 2024 & 2032
- Figure 48: Europe Biobetter Market Volume (K Unit), by Application 2024 & 2032
- Figure 49: Europe Biobetter Market Revenue Share (%), by Application 2024 & 2032
- Figure 50: Europe Biobetter Market Volume Share (%), by Application 2024 & 2032
- Figure 51: Europe Biobetter Market Revenue (Million), by Route of Administration 2024 & 2032
- Figure 52: Europe Biobetter Market Volume (K Unit), by Route of Administration 2024 & 2032
- Figure 53: Europe Biobetter Market Revenue Share (%), by Route of Administration 2024 & 2032
- Figure 54: Europe Biobetter Market Volume Share (%), by Route of Administration 2024 & 2032
- Figure 55: Europe Biobetter Market Revenue (Million), by Distribution Channel 2024 & 2032
- Figure 56: Europe Biobetter Market Volume (K Unit), by Distribution Channel 2024 & 2032
- Figure 57: Europe Biobetter Market Revenue Share (%), by Distribution Channel 2024 & 2032
- Figure 58: Europe Biobetter Market Volume Share (%), by Distribution Channel 2024 & 2032
- Figure 59: Europe Biobetter Market Revenue (Million), by Country 2024 & 2032
- Figure 60: Europe Biobetter Market Volume (K Unit), by Country 2024 & 2032
- Figure 61: Europe Biobetter Market Revenue Share (%), by Country 2024 & 2032
- Figure 62: Europe Biobetter Market Volume Share (%), by Country 2024 & 2032
- Figure 63: Asia Pacific Biobetter Market Revenue (Million), by Drug Class 2024 & 2032
- Figure 64: Asia Pacific Biobetter Market Volume (K Unit), by Drug Class 2024 & 2032
- Figure 65: Asia Pacific Biobetter Market Revenue Share (%), by Drug Class 2024 & 2032
- Figure 66: Asia Pacific Biobetter Market Volume Share (%), by Drug Class 2024 & 2032
- Figure 67: Asia Pacific Biobetter Market Revenue (Million), by Application 2024 & 2032
- Figure 68: Asia Pacific Biobetter Market Volume (K Unit), by Application 2024 & 2032
- Figure 69: Asia Pacific Biobetter Market Revenue Share (%), by Application 2024 & 2032
- Figure 70: Asia Pacific Biobetter Market Volume Share (%), by Application 2024 & 2032
- Figure 71: Asia Pacific Biobetter Market Revenue (Million), by Route of Administration 2024 & 2032
- Figure 72: Asia Pacific Biobetter Market Volume (K Unit), by Route of Administration 2024 & 2032
- Figure 73: Asia Pacific Biobetter Market Revenue Share (%), by Route of Administration 2024 & 2032
- Figure 74: Asia Pacific Biobetter Market Volume Share (%), by Route of Administration 2024 & 2032
- Figure 75: Asia Pacific Biobetter Market Revenue (Million), by Distribution Channel 2024 & 2032
- Figure 76: Asia Pacific Biobetter Market Volume (K Unit), by Distribution Channel 2024 & 2032
- Figure 77: Asia Pacific Biobetter Market Revenue Share (%), by Distribution Channel 2024 & 2032
- Figure 78: Asia Pacific Biobetter Market Volume Share (%), by Distribution Channel 2024 & 2032
- Figure 79: Asia Pacific Biobetter Market Revenue (Million), by Country 2024 & 2032
- Figure 80: Asia Pacific Biobetter Market Volume (K Unit), by Country 2024 & 2032
- Figure 81: Asia Pacific Biobetter Market Revenue Share (%), by Country 2024 & 2032
- Figure 82: Asia Pacific Biobetter Market Volume Share (%), by Country 2024 & 2032
- Figure 83: Middle East and Africa Biobetter Market Revenue (Million), by Drug Class 2024 & 2032
- Figure 84: Middle East and Africa Biobetter Market Volume (K Unit), by Drug Class 2024 & 2032
- Figure 85: Middle East and Africa Biobetter Market Revenue Share (%), by Drug Class 2024 & 2032
- Figure 86: Middle East and Africa Biobetter Market Volume Share (%), by Drug Class 2024 & 2032
- Figure 87: Middle East and Africa Biobetter Market Revenue (Million), by Application 2024 & 2032
- Figure 88: Middle East and Africa Biobetter Market Volume (K Unit), by Application 2024 & 2032
- Figure 89: Middle East and Africa Biobetter Market Revenue Share (%), by Application 2024 & 2032
- Figure 90: Middle East and Africa Biobetter Market Volume Share (%), by Application 2024 & 2032
- Figure 91: Middle East and Africa Biobetter Market Revenue (Million), by Route of Administration 2024 & 2032
- Figure 92: Middle East and Africa Biobetter Market Volume (K Unit), by Route of Administration 2024 & 2032
- Figure 93: Middle East and Africa Biobetter Market Revenue Share (%), by Route of Administration 2024 & 2032
- Figure 94: Middle East and Africa Biobetter Market Volume Share (%), by Route of Administration 2024 & 2032
- Figure 95: Middle East and Africa Biobetter Market Revenue (Million), by Distribution Channel 2024 & 2032
- Figure 96: Middle East and Africa Biobetter Market Volume (K Unit), by Distribution Channel 2024 & 2032
- Figure 97: Middle East and Africa Biobetter Market Revenue Share (%), by Distribution Channel 2024 & 2032
- Figure 98: Middle East and Africa Biobetter Market Volume Share (%), by Distribution Channel 2024 & 2032
- Figure 99: Middle East and Africa Biobetter Market Revenue (Million), by Country 2024 & 2032
- Figure 100: Middle East and Africa Biobetter Market Volume (K Unit), by Country 2024 & 2032
- Figure 101: Middle East and Africa Biobetter Market Revenue Share (%), by Country 2024 & 2032
- Figure 102: Middle East and Africa Biobetter Market Volume Share (%), by Country 2024 & 2032
- Figure 103: South America Biobetter Market Revenue (Million), by Drug Class 2024 & 2032
- Figure 104: South America Biobetter Market Volume (K Unit), by Drug Class 2024 & 2032
- Figure 105: South America Biobetter Market Revenue Share (%), by Drug Class 2024 & 2032
- Figure 106: South America Biobetter Market Volume Share (%), by Drug Class 2024 & 2032
- Figure 107: South America Biobetter Market Revenue (Million), by Application 2024 & 2032
- Figure 108: South America Biobetter Market Volume (K Unit), by Application 2024 & 2032
- Figure 109: South America Biobetter Market Revenue Share (%), by Application 2024 & 2032
- Figure 110: South America Biobetter Market Volume Share (%), by Application 2024 & 2032
- Figure 111: South America Biobetter Market Revenue (Million), by Route of Administration 2024 & 2032
- Figure 112: South America Biobetter Market Volume (K Unit), by Route of Administration 2024 & 2032
- Figure 113: South America Biobetter Market Revenue Share (%), by Route of Administration 2024 & 2032
- Figure 114: South America Biobetter Market Volume Share (%), by Route of Administration 2024 & 2032
- Figure 115: South America Biobetter Market Revenue (Million), by Distribution Channel 2024 & 2032
- Figure 116: South America Biobetter Market Volume (K Unit), by Distribution Channel 2024 & 2032
- Figure 117: South America Biobetter Market Revenue Share (%), by Distribution Channel 2024 & 2032
- Figure 118: South America Biobetter Market Volume Share (%), by Distribution Channel 2024 & 2032
- Figure 119: South America Biobetter Market Revenue (Million), by Country 2024 & 2032
- Figure 120: South America Biobetter Market Volume (K Unit), by Country 2024 & 2032
- Figure 121: South America Biobetter Market Revenue Share (%), by Country 2024 & 2032
- Figure 122: South America Biobetter Market Volume Share (%), by Country 2024 & 2032
List of Tables
- Table 1: Global Biobetter Market Revenue Million Forecast, by Region 2019 & 2032
- Table 2: Global Biobetter Market Volume K Unit Forecast, by Region 2019 & 2032
- Table 3: Global Biobetter Market Revenue Million Forecast, by Drug Class 2019 & 2032
- Table 4: Global Biobetter Market Volume K Unit Forecast, by Drug Class 2019 & 2032
- Table 5: Global Biobetter Market Revenue Million Forecast, by Application 2019 & 2032
- Table 6: Global Biobetter Market Volume K Unit Forecast, by Application 2019 & 2032
- Table 7: Global Biobetter Market Revenue Million Forecast, by Route of Administration 2019 & 2032
- Table 8: Global Biobetter Market Volume K Unit Forecast, by Route of Administration 2019 & 2032
- Table 9: Global Biobetter Market Revenue Million Forecast, by Distribution Channel 2019 & 2032
- Table 10: Global Biobetter Market Volume K Unit Forecast, by Distribution Channel 2019 & 2032
- Table 11: Global Biobetter Market Revenue Million Forecast, by Region 2019 & 2032
- Table 12: Global Biobetter Market Volume K Unit Forecast, by Region 2019 & 2032
- Table 13: Global Biobetter Market Revenue Million Forecast, by Country 2019 & 2032
- Table 14: Global Biobetter Market Volume K Unit Forecast, by Country 2019 & 2032
- Table 15: United States Biobetter Market Revenue (Million) Forecast, by Application 2019 & 2032
- Table 16: United States Biobetter Market Volume (K Unit) Forecast, by Application 2019 & 2032
- Table 17: Canada Biobetter Market Revenue (Million) Forecast, by Application 2019 & 2032
- Table 18: Canada Biobetter Market Volume (K Unit) Forecast, by Application 2019 & 2032
- Table 19: Mexico Biobetter Market Revenue (Million) Forecast, by Application 2019 & 2032
- Table 20: Mexico Biobetter Market Volume (K Unit) Forecast, by Application 2019 & 2032
- Table 21: Global Biobetter Market Revenue Million Forecast, by Country 2019 & 2032
- Table 22: Global Biobetter Market Volume K Unit Forecast, by Country 2019 & 2032
- Table 23: Germany Biobetter Market Revenue (Million) Forecast, by Application 2019 & 2032
- Table 24: Germany Biobetter Market Volume (K Unit) Forecast, by Application 2019 & 2032
- Table 25: United Kingdom Biobetter Market Revenue (Million) Forecast, by Application 2019 & 2032
- Table 26: United Kingdom Biobetter Market Volume (K Unit) Forecast, by Application 2019 & 2032
- Table 27: France Biobetter Market Revenue (Million) Forecast, by Application 2019 & 2032
- Table 28: France Biobetter Market Volume (K Unit) Forecast, by Application 2019 & 2032
- Table 29: Italy Biobetter Market Revenue (Million) Forecast, by Application 2019 & 2032
- Table 30: Italy Biobetter Market Volume (K Unit) Forecast, by Application 2019 & 2032
- Table 31: Spain Biobetter Market Revenue (Million) Forecast, by Application 2019 & 2032
- Table 32: Spain Biobetter Market Volume (K Unit) Forecast, by Application 2019 & 2032
- Table 33: Rest of Europe Biobetter Market Revenue (Million) Forecast, by Application 2019 & 2032
- Table 34: Rest of Europe Biobetter Market Volume (K Unit) Forecast, by Application 2019 & 2032
- Table 35: Global Biobetter Market Revenue Million Forecast, by Country 2019 & 2032
- Table 36: Global Biobetter Market Volume K Unit Forecast, by Country 2019 & 2032
- Table 37: China Biobetter Market Revenue (Million) Forecast, by Application 2019 & 2032
- Table 38: China Biobetter Market Volume (K Unit) Forecast, by Application 2019 & 2032
- Table 39: Japan Biobetter Market Revenue (Million) Forecast, by Application 2019 & 2032
- Table 40: Japan Biobetter Market Volume (K Unit) Forecast, by Application 2019 & 2032
- Table 41: India Biobetter Market Revenue (Million) Forecast, by Application 2019 & 2032
- Table 42: India Biobetter Market Volume (K Unit) Forecast, by Application 2019 & 2032
- Table 43: Australia Biobetter Market Revenue (Million) Forecast, by Application 2019 & 2032
- Table 44: Australia Biobetter Market Volume (K Unit) Forecast, by Application 2019 & 2032
- Table 45: South Korea Biobetter Market Revenue (Million) Forecast, by Application 2019 & 2032
- Table 46: South Korea Biobetter Market Volume (K Unit) Forecast, by Application 2019 & 2032
- Table 47: Rest of Asia Pacific Biobetter Market Revenue (Million) Forecast, by Application 2019 & 2032
- Table 48: Rest of Asia Pacific Biobetter Market Volume (K Unit) Forecast, by Application 2019 & 2032
- Table 49: Global Biobetter Market Revenue Million Forecast, by Country 2019 & 2032
- Table 50: Global Biobetter Market Volume K Unit Forecast, by Country 2019 & 2032
- Table 51: GCC Biobetter Market Revenue (Million) Forecast, by Application 2019 & 2032
- Table 52: GCC Biobetter Market Volume (K Unit) Forecast, by Application 2019 & 2032
- Table 53: South Africa Biobetter Market Revenue (Million) Forecast, by Application 2019 & 2032
- Table 54: South Africa Biobetter Market Volume (K Unit) Forecast, by Application 2019 & 2032
- Table 55: Rest of Middle East and Africa Biobetter Market Revenue (Million) Forecast, by Application 2019 & 2032
- Table 56: Rest of Middle East and Africa Biobetter Market Volume (K Unit) Forecast, by Application 2019 & 2032
- Table 57: Global Biobetter Market Revenue Million Forecast, by Country 2019 & 2032
- Table 58: Global Biobetter Market Volume K Unit Forecast, by Country 2019 & 2032
- Table 59: Brazil Biobetter Market Revenue (Million) Forecast, by Application 2019 & 2032
- Table 60: Brazil Biobetter Market Volume (K Unit) Forecast, by Application 2019 & 2032
- Table 61: Argentina Biobetter Market Revenue (Million) Forecast, by Application 2019 & 2032
- Table 62: Argentina Biobetter Market Volume (K Unit) Forecast, by Application 2019 & 2032
- Table 63: Rest of South America Biobetter Market Revenue (Million) Forecast, by Application 2019 & 2032
- Table 64: Rest of South America Biobetter Market Volume (K Unit) Forecast, by Application 2019 & 2032
- Table 65: Global Biobetter Market Revenue Million Forecast, by Drug Class 2019 & 2032
- Table 66: Global Biobetter Market Volume K Unit Forecast, by Drug Class 2019 & 2032
- Table 67: Global Biobetter Market Revenue Million Forecast, by Application 2019 & 2032
- Table 68: Global Biobetter Market Volume K Unit Forecast, by Application 2019 & 2032
- Table 69: Global Biobetter Market Revenue Million Forecast, by Route of Administration 2019 & 2032
- Table 70: Global Biobetter Market Volume K Unit Forecast, by Route of Administration 2019 & 2032
- Table 71: Global Biobetter Market Revenue Million Forecast, by Distribution Channel 2019 & 2032
- Table 72: Global Biobetter Market Volume K Unit Forecast, by Distribution Channel 2019 & 2032
- Table 73: Global Biobetter Market Revenue Million Forecast, by Country 2019 & 2032
- Table 74: Global Biobetter Market Volume K Unit Forecast, by Country 2019 & 2032
- Table 75: United States Biobetter Market Revenue (Million) Forecast, by Application 2019 & 2032
- Table 76: United States Biobetter Market Volume (K Unit) Forecast, by Application 2019 & 2032
- Table 77: Canada Biobetter Market Revenue (Million) Forecast, by Application 2019 & 2032
- Table 78: Canada Biobetter Market Volume (K Unit) Forecast, by Application 2019 & 2032
- Table 79: Mexico Biobetter Market Revenue (Million) Forecast, by Application 2019 & 2032
- Table 80: Mexico Biobetter Market Volume (K Unit) Forecast, by Application 2019 & 2032
- Table 81: Global Biobetter Market Revenue Million Forecast, by Drug Class 2019 & 2032
- Table 82: Global Biobetter Market Volume K Unit Forecast, by Drug Class 2019 & 2032
- Table 83: Global Biobetter Market Revenue Million Forecast, by Application 2019 & 2032
- Table 84: Global Biobetter Market Volume K Unit Forecast, by Application 2019 & 2032
- Table 85: Global Biobetter Market Revenue Million Forecast, by Route of Administration 2019 & 2032
- Table 86: Global Biobetter Market Volume K Unit Forecast, by Route of Administration 2019 & 2032
- Table 87: Global Biobetter Market Revenue Million Forecast, by Distribution Channel 2019 & 2032
- Table 88: Global Biobetter Market Volume K Unit Forecast, by Distribution Channel 2019 & 2032
- Table 89: Global Biobetter Market Revenue Million Forecast, by Country 2019 & 2032
- Table 90: Global Biobetter Market Volume K Unit Forecast, by Country 2019 & 2032
- Table 91: Germany Biobetter Market Revenue (Million) Forecast, by Application 2019 & 2032
- Table 92: Germany Biobetter Market Volume (K Unit) Forecast, by Application 2019 & 2032
- Table 93: United Kingdom Biobetter Market Revenue (Million) Forecast, by Application 2019 & 2032
- Table 94: United Kingdom Biobetter Market Volume (K Unit) Forecast, by Application 2019 & 2032
- Table 95: France Biobetter Market Revenue (Million) Forecast, by Application 2019 & 2032
- Table 96: France Biobetter Market Volume (K Unit) Forecast, by Application 2019 & 2032
- Table 97: Italy Biobetter Market Revenue (Million) Forecast, by Application 2019 & 2032
- Table 98: Italy Biobetter Market Volume (K Unit) Forecast, by Application 2019 & 2032
- Table 99: Spain Biobetter Market Revenue (Million) Forecast, by Application 2019 & 2032
- Table 100: Spain Biobetter Market Volume (K Unit) Forecast, by Application 2019 & 2032
- Table 101: Rest of Europe Biobetter Market Revenue (Million) Forecast, by Application 2019 & 2032
- Table 102: Rest of Europe Biobetter Market Volume (K Unit) Forecast, by Application 2019 & 2032
- Table 103: Global Biobetter Market Revenue Million Forecast, by Drug Class 2019 & 2032
- Table 104: Global Biobetter Market Volume K Unit Forecast, by Drug Class 2019 & 2032
- Table 105: Global Biobetter Market Revenue Million Forecast, by Application 2019 & 2032
- Table 106: Global Biobetter Market Volume K Unit Forecast, by Application 2019 & 2032
- Table 107: Global Biobetter Market Revenue Million Forecast, by Route of Administration 2019 & 2032
- Table 108: Global Biobetter Market Volume K Unit Forecast, by Route of Administration 2019 & 2032
- Table 109: Global Biobetter Market Revenue Million Forecast, by Distribution Channel 2019 & 2032
- Table 110: Global Biobetter Market Volume K Unit Forecast, by Distribution Channel 2019 & 2032
- Table 111: Global Biobetter Market Revenue Million Forecast, by Country 2019 & 2032
- Table 112: Global Biobetter Market Volume K Unit Forecast, by Country 2019 & 2032
- Table 113: China Biobetter Market Revenue (Million) Forecast, by Application 2019 & 2032
- Table 114: China Biobetter Market Volume (K Unit) Forecast, by Application 2019 & 2032
- Table 115: Japan Biobetter Market Revenue (Million) Forecast, by Application 2019 & 2032
- Table 116: Japan Biobetter Market Volume (K Unit) Forecast, by Application 2019 & 2032
- Table 117: India Biobetter Market Revenue (Million) Forecast, by Application 2019 & 2032
- Table 118: India Biobetter Market Volume (K Unit) Forecast, by Application 2019 & 2032
- Table 119: Australia Biobetter Market Revenue (Million) Forecast, by Application 2019 & 2032
- Table 120: Australia Biobetter Market Volume (K Unit) Forecast, by Application 2019 & 2032
- Table 121: South Korea Biobetter Market Revenue (Million) Forecast, by Application 2019 & 2032
- Table 122: South Korea Biobetter Market Volume (K Unit) Forecast, by Application 2019 & 2032
- Table 123: Rest of Asia Pacific Biobetter Market Revenue (Million) Forecast, by Application 2019 & 2032
- Table 124: Rest of Asia Pacific Biobetter Market Volume (K Unit) Forecast, by Application 2019 & 2032
- Table 125: Global Biobetter Market Revenue Million Forecast, by Drug Class 2019 & 2032
- Table 126: Global Biobetter Market Volume K Unit Forecast, by Drug Class 2019 & 2032
- Table 127: Global Biobetter Market Revenue Million Forecast, by Application 2019 & 2032
- Table 128: Global Biobetter Market Volume K Unit Forecast, by Application 2019 & 2032
- Table 129: Global Biobetter Market Revenue Million Forecast, by Route of Administration 2019 & 2032
- Table 130: Global Biobetter Market Volume K Unit Forecast, by Route of Administration 2019 & 2032
- Table 131: Global Biobetter Market Revenue Million Forecast, by Distribution Channel 2019 & 2032
- Table 132: Global Biobetter Market Volume K Unit Forecast, by Distribution Channel 2019 & 2032
- Table 133: Global Biobetter Market Revenue Million Forecast, by Country 2019 & 2032
- Table 134: Global Biobetter Market Volume K Unit Forecast, by Country 2019 & 2032
- Table 135: GCC Biobetter Market Revenue (Million) Forecast, by Application 2019 & 2032
- Table 136: GCC Biobetter Market Volume (K Unit) Forecast, by Application 2019 & 2032
- Table 137: South Africa Biobetter Market Revenue (Million) Forecast, by Application 2019 & 2032
- Table 138: South Africa Biobetter Market Volume (K Unit) Forecast, by Application 2019 & 2032
- Table 139: Rest of Middle East and Africa Biobetter Market Revenue (Million) Forecast, by Application 2019 & 2032
- Table 140: Rest of Middle East and Africa Biobetter Market Volume (K Unit) Forecast, by Application 2019 & 2032
- Table 141: Global Biobetter Market Revenue Million Forecast, by Drug Class 2019 & 2032
- Table 142: Global Biobetter Market Volume K Unit Forecast, by Drug Class 2019 & 2032
- Table 143: Global Biobetter Market Revenue Million Forecast, by Application 2019 & 2032
- Table 144: Global Biobetter Market Volume K Unit Forecast, by Application 2019 & 2032
- Table 145: Global Biobetter Market Revenue Million Forecast, by Route of Administration 2019 & 2032
- Table 146: Global Biobetter Market Volume K Unit Forecast, by Route of Administration 2019 & 2032
- Table 147: Global Biobetter Market Revenue Million Forecast, by Distribution Channel 2019 & 2032
- Table 148: Global Biobetter Market Volume K Unit Forecast, by Distribution Channel 2019 & 2032
- Table 149: Global Biobetter Market Revenue Million Forecast, by Country 2019 & 2032
- Table 150: Global Biobetter Market Volume K Unit Forecast, by Country 2019 & 2032
- Table 151: Brazil Biobetter Market Revenue (Million) Forecast, by Application 2019 & 2032
- Table 152: Brazil Biobetter Market Volume (K Unit) Forecast, by Application 2019 & 2032
- Table 153: Argentina Biobetter Market Revenue (Million) Forecast, by Application 2019 & 2032
- Table 154: Argentina Biobetter Market Volume (K Unit) Forecast, by Application 2019 & 2032
- Table 155: Rest of South America Biobetter Market Revenue (Million) Forecast, by Application 2019 & 2032
- Table 156: Rest of South America Biobetter Market Volume (K Unit) Forecast, by Application 2019 & 2032
Frequently Asked Questions
1. What is the projected Compound Annual Growth Rate (CAGR) of the Biobetter Market?
The projected CAGR is approximately 7.80%.
2. Which companies are prominent players in the Biobetter Market?
Key companies in the market include Sanofi, Amgen Inc, Merck & Co Inc, Eli Lilly and Company, F Hoffmann-La Roche AG, Novo Nordisk A/S, Pfizer Inc, Biogen Inc, CSL Behring, Genentech USA Inc.
3. What are the main segments of the Biobetter Market?
The market segments include Drug Class, Application, Route of Administration, Distribution Channel.
4. Can you provide details about the market size?
The market size is estimated to be USD XX Million as of 2022.
5. What are some drivers contributing to market growth?
Superior Therapeutic Efficacy and Lower Adverse Effects; Comparatively Easier and Less Costly Manufacturing Processes; Non- Patent and Market Exclusivity; Longer product Half-life and Less Dosing Frequency; High Investment Opportunities.
6. What are the notable trends driving market growth?
Cancer Segment is Expected to Hold a Significant Market Share Over the Forecast Period.
7. Are there any restraints impacting market growth?
High Investment in Research and Development; Increasing Biosimilar Competition.
8. Can you provide examples of recent developments in the market?
In January 2023, Celltrion Healthcare announced the submission of a biologics license application (BLA) for Remsima SC, a biobetter of the company's infliximab biosimilar (Remsima) that allows for subcutaneous administration.
9. What pricing options are available for accessing the report?
Pricing options include single-user, multi-user, and enterprise licenses priced at USD 4750, USD 5250, and USD 8750 respectively.
10. Is the market size provided in terms of value or volume?
The market size is provided in terms of value, measured in Million and volume, measured in K Unit.
11. Are there any specific market keywords associated with the report?
Yes, the market keyword associated with the report is "Biobetter Market," which aids in identifying and referencing the specific market segment covered.
12. How do I determine which pricing option suits my needs best?
The pricing options vary based on user requirements and access needs. Individual users may opt for single-user licenses, while businesses requiring broader access may choose multi-user or enterprise licenses for cost-effective access to the report.
13. Are there any additional resources or data provided in the Biobetter Market report?
While the report offers comprehensive insights, it's advisable to review the specific contents or supplementary materials provided to ascertain if additional resources or data are available.
14. How can I stay updated on further developments or reports in the Biobetter Market?
To stay informed about further developments, trends, and reports in the Biobetter Market, consider subscribing to industry newsletters, following relevant companies and organizations, or regularly checking reputable industry news sources and publications.
Methodology
Step 1 - Identification of Relevant Samples Size from Population Database


Step 2 - Approaches for Defining Global Market Size (Value, Volume* & Price*)

Note*: In applicable scenarios
Step 3 - Data Sources
Primary Research
- Web Analytics
- Survey Reports
- Research Institute
- Latest Research Reports
- Opinion Leaders
Secondary Research
- Annual Reports
- White Paper
- Latest Press Release
- Industry Association
- Paid Database
- Investor Presentations

Step 4 - Data Triangulation
Involves using different sources of information in order to increase the validity of a study
These sources are likely to be stakeholders in a program - participants, other researchers, program staff, other community members, and so on.
Then we put all data in single framework & apply various statistical tools to find out the dynamic on the market.
During the analysis stage, feedback from the stakeholder groups would be compared to determine areas of agreement as well as areas of divergence


