
Key Insights
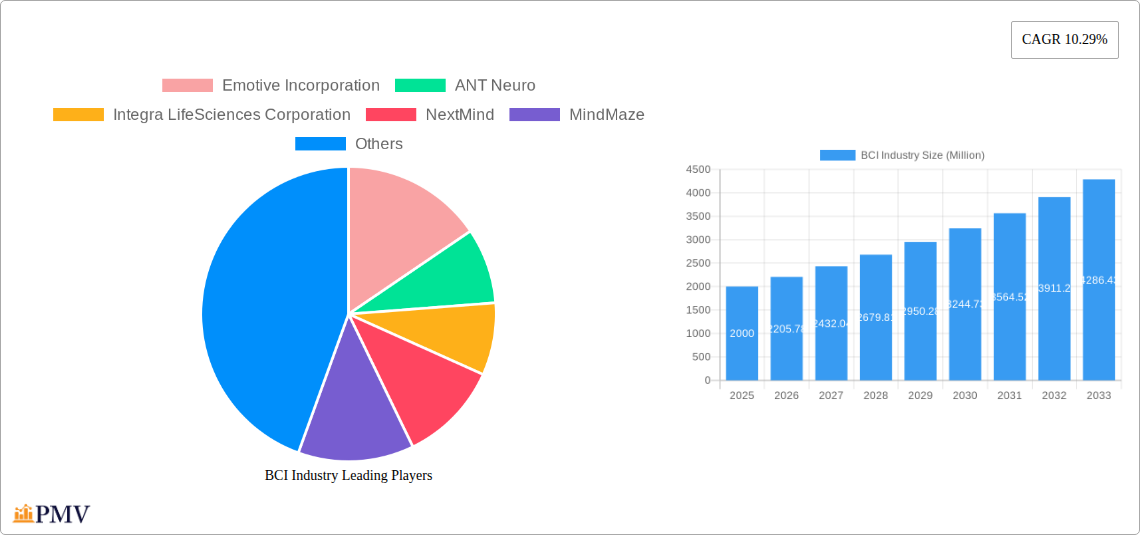
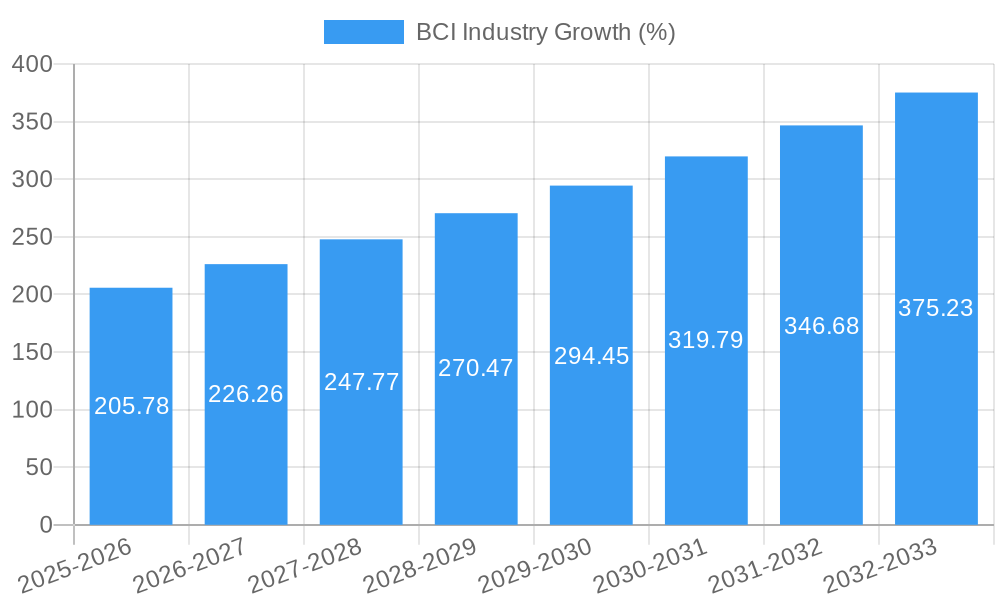
The Brain-Computer Interface (BCI) market is experiencing robust growth, projected to reach \$2.0 billion in 2025 and exhibiting a Compound Annual Growth Rate (CAGR) of 10.29% from 2025 to 2033. This expansion is driven by several key factors. Firstly, advancements in neurotechnology are leading to more sophisticated and less invasive BCI devices, making them accessible to a wider patient population. The increasing prevalence of neurological disorders like Parkinson's disease, epilepsy, and stroke is fueling demand for effective treatment and rehabilitation solutions offered by BCIs. Furthermore, the rising interest in augmentative and assistive technologies for individuals with disabilities, coupled with government initiatives supporting research and development in this field, is further stimulating market growth. The non-invasive BCI segment is expected to dominate due to its relative ease of use, lower cost, and reduced risks compared to invasive procedures. However, the invasive BCI segment holds significant growth potential driven by its capability to achieve higher levels of precision and functionality. Therapeutic applications, particularly restoration of motor functions and repair of brain damage, currently lead the market, although other applications like enhancing human cognitive abilities are rapidly gaining traction and are expected to contribute significantly to future growth.
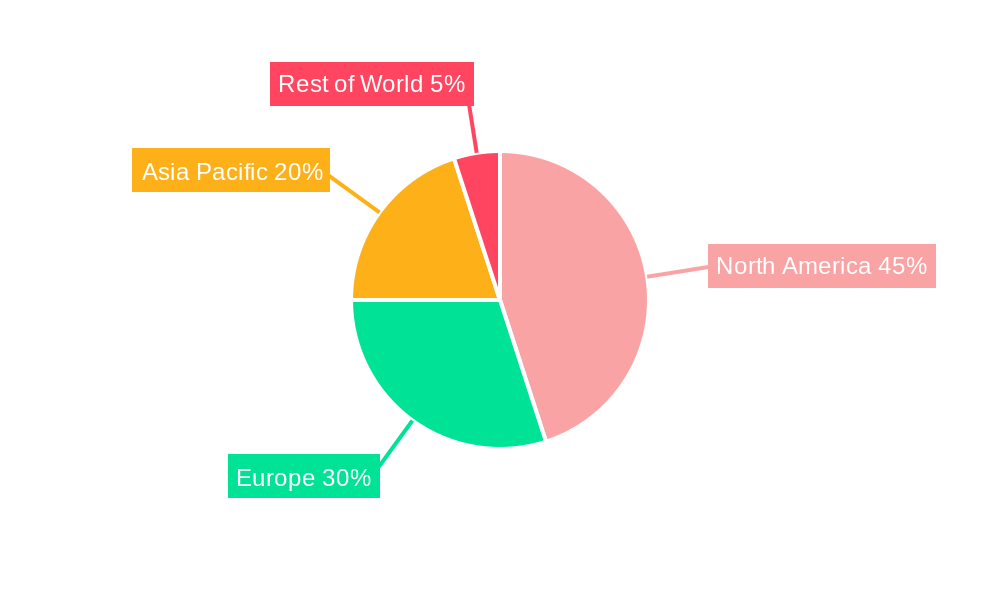
Geographical distribution shows North America currently holds the largest market share, driven by advanced healthcare infrastructure, high research funding, and early adoption of innovative technologies. However, the Asia-Pacific region is anticipated to witness the fastest growth, propelled by a growing elderly population, increasing healthcare expenditure, and a rising number of neurological disorders. Europe is also a significant market with robust technological advancements and a well-established healthcare sector. Competitive landscape is characterized by a mix of established medical device companies and emerging technology firms. Key players are focusing on strategic partnerships, acquisitions, and product innovation to strengthen their market position and capitalize on the significant growth opportunities in this rapidly evolving field. The ongoing research into improving signal processing, developing more biocompatible materials, and addressing challenges related to long-term device stability will shape the future trajectory of the BCI market.
The Brain-Computer Interface (BCI) Industry: A Comprehensive Market Report (2019-2033)
This comprehensive report provides an in-depth analysis of the global Brain-Computer Interface (BCI) industry, offering invaluable insights for stakeholders seeking to understand market dynamics, competitive landscapes, and future growth trajectories. With a meticulous study period spanning 2019-2033, a base year of 2025, and a forecast period extending to 2033, this report leverages historical data (2019-2024) to project future market values in Millions.
BCI Industry Market Structure & Competitive Dynamics
The BCI market is characterized by a moderately concentrated structure with several key players vying for dominance. Market concentration is estimated at xx%, with the top five companies holding approximately xx% of the market share in 2025. This competitive landscape is further shaped by a dynamic innovation ecosystem, fostering continuous product development and technological advancements. Regulatory frameworks, while still evolving, are increasingly influential, particularly concerning safety and ethical considerations related to invasive BCI devices. The market is also witnessing significant M&A activity, with deal values exceeding $xx Million in the past five years. This consolidation trend reflects the increasing strategic importance of BCI technologies.
- Market Share (2025, Estimated): Medtronic PLC (xx%), Integra LifeSciences Corporation (xx%), Emotive Incorporation (xx%), Others (xx%).
- M&A Activity (2019-2024): Total deal value exceeded $xx Million, with notable transactions including [Insert specific examples if available].
- End-User Trends: Growing demand from healthcare institutions, research organizations and military applications.
- Product Substitutes: Currently limited, with technological advancements and market acceptance being key factors.
BCI Industry Trends & Insights
The global BCI market is experiencing robust growth, projected to reach $xx Million by 2033, exhibiting a CAGR of xx% during the forecast period (2025-2033). Several factors contribute to this expansion: a rise in neurological disorders requiring restorative solutions, advancements in neurotechnology, increasing government funding for research and development and growing consumer awareness of BCI applications. The market penetration of non-invasive BCI solutions is steadily increasing, driven by their ease of use, affordability, and reduced safety concerns. However, the market faces challenges such as high initial investment costs, complex regulatory pathways, and data security concerns.
Technological disruptions, including breakthroughs in AI and machine learning, enhance BCI signal processing and analysis, leading to improved device performance. Consumer preferences are shifting towards minimally invasive and user-friendly devices with enhanced functionality. Intense competition amongst market players fuels innovation and price reductions, making BCI technology increasingly accessible. The development of standardized protocols and improved data sharing practices will further propel market growth.
Dominant Markets & Segments in BCI Industry
The North American region currently holds the largest market share, driven by robust research initiatives, substantial investments in healthcare infrastructure, and a high prevalence of neurological disorders. Within the segment breakdown, the non-invasive BCI market segment demonstrates the fastest growth, driven primarily by its accessibility and affordability. The restoration of disabilities application sector dominates the application segment, fueled by the growing geriatric population and increasing incidence of paralysis and other neurological impairments.
- Leading Region: North America (Market Size: $xx Million in 2025)
- Fastest-Growing Segment (By Type): Non-invasive Brain-Computer Interface
- Largest Application Segment: Restoration of Disabilities
- Key Drivers (North America):
- High prevalence of neurological disorders.
- Significant investments in healthcare R&D.
- Stringent regulatory frameworks driving safety and efficacy standards.
- Strong government support for advanced medical technology adoption.
BCI Industry Product Innovations
Recent product innovations focus on enhancing usability, accuracy, and portability of BCI devices. Advancements include improved signal processing algorithms, miniaturized sensors, and advanced wireless communication technologies. These advancements are directly impacting market fit by expanding accessibility and enhancing the therapeutic benefits of BCI systems, particularly for patients with debilitating neurological conditions. The focus is on developing closed-loop systems for more effective and personalized therapies.
Report Segmentation & Scope
This report segments the BCI market across two primary categories: By Type and By Application.
By Type:
- Invasive Brain-Computer Interface: This segment comprises surgically implanted devices, offering high signal quality but posing higher risks. Market size in 2025 is estimated at $xx Million, projected to reach $xx Million by 2033.
- Non-invasive Brain-Computer Interface: This segment includes EEG-based systems, characterized by ease of use and non-invasive nature. This segment is expected to dominate the market with a 2025 market size of $xx Million, reaching $xx Million by 2033.
- Other Types: This includes hybrid and other emerging BCI technologies. The market size is estimated at $xx Million in 2025, and is expected to reach $xx Million by 2033.
By Application:
- Restoration of Disabilities: This is currently the largest application segment, driven by the need for assistive technology for patients with paralysis and other motor impairments. Market size in 2025 is estimated at $xx Million, projected to reach $xx Million by 2033.
- Repair of Brain Function: This segment focuses on treating neurological disorders through BCI-mediated therapies. Market size in 2025 is estimated at $xx Million, projected to reach $xx Million by 2033.
- Other Applications: This includes emerging applications in fields like gaming, entertainment, and human augmentation. Market size in 2025 is estimated at $xx Million, and is expected to reach $xx Million by 2033.
Key Drivers of BCI Industry Growth
Several factors propel the growth of the BCI industry. Technological advancements in sensor technology, signal processing, and artificial intelligence significantly improve device performance and expand their applicability. Increasing funding for research and development from both public and private sectors fuels innovation. Government regulations aimed at promoting the development and adoption of safe and effective BCI technologies create a favorable environment for industry growth. The growing prevalence of neurological disorders and the unmet clinical needs drive demand for advanced therapeutic solutions.
Challenges in the BCI Industry Sector
The BCI industry faces challenges such as stringent regulatory approvals, requiring extensive clinical trials and safety evaluations, increasing the time and cost to market. Supply chain complexities and dependence on specialized components can impact production scalability and cost-effectiveness. The high cost of BCI devices and procedures limits accessibility, particularly in developing nations. Intense competition and the need for continuous innovation exert pressure on profit margins.
Leading Players in the BCI Industry Market
- Emotive Incorporation
- ANT Neuro
- Integra LifeSciences Corporation
- NextMind
- MindMaze
- NIRx Medical Technologies
- Natus Medical Inc
- Compumedics Ltd
- Medtronic PLC
- Advanced Brain Monitoring Inc
- NeuroSky
- Brain Products GmbH
- Cadwell Industries Inc
- g tec medical engineering GmbH
- Nihon Kohden Corporation
Key Developments in BCI Industry Sector
- January 2023: Company X launched a new non-invasive BCI device for stroke rehabilitation.
- June 2022: Company Y announced a strategic partnership to develop advanced signal processing algorithms for BCI systems.
- October 2021: FDA approval granted for a new invasive BCI system for treating epilepsy.
- [Add more relevant developments with year/month and impact]
Strategic BCI Industry Market Outlook
The BCI industry is poised for significant growth, driven by technological advancements and increasing demand for effective treatments for neurological disorders. Strategic opportunities exist in developing user-friendly, affordable, and minimally invasive BCI solutions, expanding into new applications such as brain-computer interfaces for communication, and establishing robust partnerships with healthcare providers and technology companies. Further research and development efforts will be crucial in overcoming current limitations and expanding the market penetration of BCI technologies across diverse demographics and applications.
BCI Industry Segmentation
-
1. Type
- 1.1. Invasive Brain-computer Interface
- 1.2. Non-invasive Brain-computer Interface
- 1.3. Other Types
-
2. Application
- 2.1. Restoration of Disabilities
- 2.2. Repair of Brain Function
- 2.3. Other Applications
BCI Industry Segmentation By Geography
-
1. North America
- 1.1. United States
- 1.2. Canada
- 1.3. Mexico
-
2. Europe
- 2.1. Germany
- 2.2. United Kingdom
- 2.3. France
- 2.4. Italy
- 2.5. Spain
- 2.6. Rest of Europe
-
3. Asia Pacific
- 3.1. China
- 3.2. Japan
- 3.3. India
- 3.4. Australia
- 3.5. South Korea
- 3.6. Rest of Asia Pacific
-
4. Middle East and Africa
- 4.1. GCC
- 4.2. South Africa
- 4.3. Rest of Middle East and Africa
-
5. South America
- 5.1. Brazil
- 5.2. Argentina
- 5.3. Rest of South America
BCI Industry REPORT HIGHLIGHTS
| Aspects | Details |
|---|---|
| Study Period | 2019-2033 |
| Base Year | 2024 |
| Estimated Year | 2025 |
| Forecast Period | 2025-2033 |
| Historical Period | 2019-2024 |
| Growth Rate | CAGR of 10.29% from 2019-2033 |
| Segmentation |
|
Table of Contents
- 1. Introduction
- 1.1. Research Scope
- 1.2. Market Segmentation
- 1.3. Research Methodology
- 1.4. Definitions and Assumptions
- 2. Executive Summary
- 2.1. Introduction
- 3. Market Dynamics
- 3.1. Introduction
- 3.2. Market Drivers
- 3.2.1. Increasing Prevalence of Neurodegenerative Disorders; Rising R&D Activities by Government to Improve the Brain-computer Interface Technology; Various Technological Advancements such as Miniaturization of Devices
- 3.3. Market Restrains
- 3.3.1. High Cost of Brain-computer Interface Devices; Lack of Expertise in Implementing the Systems
- 3.4. Market Trends
- 3.4.1. The Non-invasive Brain-computer Interface Segment is Expected to Dominate the Market During the Forecast Period
- 4. Market Factor Analysis
- 4.1. Porters Five Forces
- 4.2. Supply/Value Chain
- 4.3. PESTEL analysis
- 4.4. Market Entropy
- 4.5. Patent/Trademark Analysis
- 5. Global BCI Industry Analysis, Insights and Forecast, 2019-2031
- 5.1. Market Analysis, Insights and Forecast - by Type
- 5.1.1. Invasive Brain-computer Interface
- 5.1.2. Non-invasive Brain-computer Interface
- 5.1.3. Other Types
- 5.2. Market Analysis, Insights and Forecast - by Application
- 5.2.1. Restoration of Disabilities
- 5.2.2. Repair of Brain Function
- 5.2.3. Other Applications
- 5.3. Market Analysis, Insights and Forecast - by Region
- 5.3.1. North America
- 5.3.2. Europe
- 5.3.3. Asia Pacific
- 5.3.4. Middle East and Africa
- 5.3.5. South America
- 5.1. Market Analysis, Insights and Forecast - by Type
- 6. North America BCI Industry Analysis, Insights and Forecast, 2019-2031
- 6.1. Market Analysis, Insights and Forecast - by Type
- 6.1.1. Invasive Brain-computer Interface
- 6.1.2. Non-invasive Brain-computer Interface
- 6.1.3. Other Types
- 6.2. Market Analysis, Insights and Forecast - by Application
- 6.2.1. Restoration of Disabilities
- 6.2.2. Repair of Brain Function
- 6.2.3. Other Applications
- 6.1. Market Analysis, Insights and Forecast - by Type
- 7. Europe BCI Industry Analysis, Insights and Forecast, 2019-2031
- 7.1. Market Analysis, Insights and Forecast - by Type
- 7.1.1. Invasive Brain-computer Interface
- 7.1.2. Non-invasive Brain-computer Interface
- 7.1.3. Other Types
- 7.2. Market Analysis, Insights and Forecast - by Application
- 7.2.1. Restoration of Disabilities
- 7.2.2. Repair of Brain Function
- 7.2.3. Other Applications
- 7.1. Market Analysis, Insights and Forecast - by Type
- 8. Asia Pacific BCI Industry Analysis, Insights and Forecast, 2019-2031
- 8.1. Market Analysis, Insights and Forecast - by Type
- 8.1.1. Invasive Brain-computer Interface
- 8.1.2. Non-invasive Brain-computer Interface
- 8.1.3. Other Types
- 8.2. Market Analysis, Insights and Forecast - by Application
- 8.2.1. Restoration of Disabilities
- 8.2.2. Repair of Brain Function
- 8.2.3. Other Applications
- 8.1. Market Analysis, Insights and Forecast - by Type
- 9. Middle East and Africa BCI Industry Analysis, Insights and Forecast, 2019-2031
- 9.1. Market Analysis, Insights and Forecast - by Type
- 9.1.1. Invasive Brain-computer Interface
- 9.1.2. Non-invasive Brain-computer Interface
- 9.1.3. Other Types
- 9.2. Market Analysis, Insights and Forecast - by Application
- 9.2.1. Restoration of Disabilities
- 9.2.2. Repair of Brain Function
- 9.2.3. Other Applications
- 9.1. Market Analysis, Insights and Forecast - by Type
- 10. South America BCI Industry Analysis, Insights and Forecast, 2019-2031
- 10.1. Market Analysis, Insights and Forecast - by Type
- 10.1.1. Invasive Brain-computer Interface
- 10.1.2. Non-invasive Brain-computer Interface
- 10.1.3. Other Types
- 10.2. Market Analysis, Insights and Forecast - by Application
- 10.2.1. Restoration of Disabilities
- 10.2.2. Repair of Brain Function
- 10.2.3. Other Applications
- 10.1. Market Analysis, Insights and Forecast - by Type
- 11. North America BCI Industry Analysis, Insights and Forecast, 2019-2031
- 11.1. Market Analysis, Insights and Forecast - By Country/Sub-region
- 11.1.1 United States
- 11.1.2 Canada
- 11.1.3 Mexico
- 12. Europe BCI Industry Analysis, Insights and Forecast, 2019-2031
- 12.1. Market Analysis, Insights and Forecast - By Country/Sub-region
- 12.1.1 Germany
- 12.1.2 United Kingdom
- 12.1.3 France
- 12.1.4 Italy
- 12.1.5 Spain
- 12.1.6 Rest of Europe
- 13. Asia Pacific BCI Industry Analysis, Insights and Forecast, 2019-2031
- 13.1. Market Analysis, Insights and Forecast - By Country/Sub-region
- 13.1.1 China
- 13.1.2 Japan
- 13.1.3 India
- 13.1.4 Australia
- 13.1.5 South Korea
- 13.1.6 Rest of Asia Pacific
- 14. Middle East and Africa BCI Industry Analysis, Insights and Forecast, 2019-2031
- 14.1. Market Analysis, Insights and Forecast - By Country/Sub-region
- 14.1.1 GCC
- 14.1.2 South Africa
- 14.1.3 Rest of Middle East and Africa
- 15. South America BCI Industry Analysis, Insights and Forecast, 2019-2031
- 15.1. Market Analysis, Insights and Forecast - By Country/Sub-region
- 15.1.1 Brazil
- 15.1.2 Argentina
- 15.1.3 Rest of South America
- 16. Competitive Analysis
- 16.1. Global Market Share Analysis 2024
- 16.2. Company Profiles
- 16.2.1 Emotive Incorporation
- 16.2.1.1. Overview
- 16.2.1.2. Products
- 16.2.1.3. SWOT Analysis
- 16.2.1.4. Recent Developments
- 16.2.1.5. Financials (Based on Availability)
- 16.2.2 ANT Neuro
- 16.2.2.1. Overview
- 16.2.2.2. Products
- 16.2.2.3. SWOT Analysis
- 16.2.2.4. Recent Developments
- 16.2.2.5. Financials (Based on Availability)
- 16.2.3 Integra LifeSciences Corporation
- 16.2.3.1. Overview
- 16.2.3.2. Products
- 16.2.3.3. SWOT Analysis
- 16.2.3.4. Recent Developments
- 16.2.3.5. Financials (Based on Availability)
- 16.2.4 NextMind
- 16.2.4.1. Overview
- 16.2.4.2. Products
- 16.2.4.3. SWOT Analysis
- 16.2.4.4. Recent Developments
- 16.2.4.5. Financials (Based on Availability)
- 16.2.5 MindMaze
- 16.2.5.1. Overview
- 16.2.5.2. Products
- 16.2.5.3. SWOT Analysis
- 16.2.5.4. Recent Developments
- 16.2.5.5. Financials (Based on Availability)
- 16.2.6 NIRx Medical Technologies
- 16.2.6.1. Overview
- 16.2.6.2. Products
- 16.2.6.3. SWOT Analysis
- 16.2.6.4. Recent Developments
- 16.2.6.5. Financials (Based on Availability)
- 16.2.7 Natus Medical Inc
- 16.2.7.1. Overview
- 16.2.7.2. Products
- 16.2.7.3. SWOT Analysis
- 16.2.7.4. Recent Developments
- 16.2.7.5. Financials (Based on Availability)
- 16.2.8 Compumedics Ltd
- 16.2.8.1. Overview
- 16.2.8.2. Products
- 16.2.8.3. SWOT Analysis
- 16.2.8.4. Recent Developments
- 16.2.8.5. Financials (Based on Availability)
- 16.2.9 Medtronic PLC
- 16.2.9.1. Overview
- 16.2.9.2. Products
- 16.2.9.3. SWOT Analysis
- 16.2.9.4. Recent Developments
- 16.2.9.5. Financials (Based on Availability)
- 16.2.10 Advanced Brain Monitoring Inc
- 16.2.10.1. Overview
- 16.2.10.2. Products
- 16.2.10.3. SWOT Analysis
- 16.2.10.4. Recent Developments
- 16.2.10.5. Financials (Based on Availability)
- 16.2.11 NeuroSky
- 16.2.11.1. Overview
- 16.2.11.2. Products
- 16.2.11.3. SWOT Analysis
- 16.2.11.4. Recent Developments
- 16.2.11.5. Financials (Based on Availability)
- 16.2.12 Brain Products GmbH
- 16.2.12.1. Overview
- 16.2.12.2. Products
- 16.2.12.3. SWOT Analysis
- 16.2.12.4. Recent Developments
- 16.2.12.5. Financials (Based on Availability)
- 16.2.13 Cadwell Industries Inc
- 16.2.13.1. Overview
- 16.2.13.2. Products
- 16.2.13.3. SWOT Analysis
- 16.2.13.4. Recent Developments
- 16.2.13.5. Financials (Based on Availability)
- 16.2.14 g tec medical engineering GmbH
- 16.2.14.1. Overview
- 16.2.14.2. Products
- 16.2.14.3. SWOT Analysis
- 16.2.14.4. Recent Developments
- 16.2.14.5. Financials (Based on Availability)
- 16.2.15 Nihon Kohden Corporation
- 16.2.15.1. Overview
- 16.2.15.2. Products
- 16.2.15.3. SWOT Analysis
- 16.2.15.4. Recent Developments
- 16.2.15.5. Financials (Based on Availability)
- 16.2.1 Emotive Incorporation
List of Figures
- Figure 1: Global BCI Industry Revenue Breakdown (Million, %) by Region 2024 & 2032
- Figure 2: Global BCI Industry Volume Breakdown (K Unit, %) by Region 2024 & 2032
- Figure 3: North America BCI Industry Revenue (Million), by Country 2024 & 2032
- Figure 4: North America BCI Industry Volume (K Unit), by Country 2024 & 2032
- Figure 5: North America BCI Industry Revenue Share (%), by Country 2024 & 2032
- Figure 6: North America BCI Industry Volume Share (%), by Country 2024 & 2032
- Figure 7: Europe BCI Industry Revenue (Million), by Country 2024 & 2032
- Figure 8: Europe BCI Industry Volume (K Unit), by Country 2024 & 2032
- Figure 9: Europe BCI Industry Revenue Share (%), by Country 2024 & 2032
- Figure 10: Europe BCI Industry Volume Share (%), by Country 2024 & 2032
- Figure 11: Asia Pacific BCI Industry Revenue (Million), by Country 2024 & 2032
- Figure 12: Asia Pacific BCI Industry Volume (K Unit), by Country 2024 & 2032
- Figure 13: Asia Pacific BCI Industry Revenue Share (%), by Country 2024 & 2032
- Figure 14: Asia Pacific BCI Industry Volume Share (%), by Country 2024 & 2032
- Figure 15: Middle East and Africa BCI Industry Revenue (Million), by Country 2024 & 2032
- Figure 16: Middle East and Africa BCI Industry Volume (K Unit), by Country 2024 & 2032
- Figure 17: Middle East and Africa BCI Industry Revenue Share (%), by Country 2024 & 2032
- Figure 18: Middle East and Africa BCI Industry Volume Share (%), by Country 2024 & 2032
- Figure 19: South America BCI Industry Revenue (Million), by Country 2024 & 2032
- Figure 20: South America BCI Industry Volume (K Unit), by Country 2024 & 2032
- Figure 21: South America BCI Industry Revenue Share (%), by Country 2024 & 2032
- Figure 22: South America BCI Industry Volume Share (%), by Country 2024 & 2032
- Figure 23: North America BCI Industry Revenue (Million), by Type 2024 & 2032
- Figure 24: North America BCI Industry Volume (K Unit), by Type 2024 & 2032
- Figure 25: North America BCI Industry Revenue Share (%), by Type 2024 & 2032
- Figure 26: North America BCI Industry Volume Share (%), by Type 2024 & 2032
- Figure 27: North America BCI Industry Revenue (Million), by Application 2024 & 2032
- Figure 28: North America BCI Industry Volume (K Unit), by Application 2024 & 2032
- Figure 29: North America BCI Industry Revenue Share (%), by Application 2024 & 2032
- Figure 30: North America BCI Industry Volume Share (%), by Application 2024 & 2032
- Figure 31: North America BCI Industry Revenue (Million), by Country 2024 & 2032
- Figure 32: North America BCI Industry Volume (K Unit), by Country 2024 & 2032
- Figure 33: North America BCI Industry Revenue Share (%), by Country 2024 & 2032
- Figure 34: North America BCI Industry Volume Share (%), by Country 2024 & 2032
- Figure 35: Europe BCI Industry Revenue (Million), by Type 2024 & 2032
- Figure 36: Europe BCI Industry Volume (K Unit), by Type 2024 & 2032
- Figure 37: Europe BCI Industry Revenue Share (%), by Type 2024 & 2032
- Figure 38: Europe BCI Industry Volume Share (%), by Type 2024 & 2032
- Figure 39: Europe BCI Industry Revenue (Million), by Application 2024 & 2032
- Figure 40: Europe BCI Industry Volume (K Unit), by Application 2024 & 2032
- Figure 41: Europe BCI Industry Revenue Share (%), by Application 2024 & 2032
- Figure 42: Europe BCI Industry Volume Share (%), by Application 2024 & 2032
- Figure 43: Europe BCI Industry Revenue (Million), by Country 2024 & 2032
- Figure 44: Europe BCI Industry Volume (K Unit), by Country 2024 & 2032
- Figure 45: Europe BCI Industry Revenue Share (%), by Country 2024 & 2032
- Figure 46: Europe BCI Industry Volume Share (%), by Country 2024 & 2032
- Figure 47: Asia Pacific BCI Industry Revenue (Million), by Type 2024 & 2032
- Figure 48: Asia Pacific BCI Industry Volume (K Unit), by Type 2024 & 2032
- Figure 49: Asia Pacific BCI Industry Revenue Share (%), by Type 2024 & 2032
- Figure 50: Asia Pacific BCI Industry Volume Share (%), by Type 2024 & 2032
- Figure 51: Asia Pacific BCI Industry Revenue (Million), by Application 2024 & 2032
- Figure 52: Asia Pacific BCI Industry Volume (K Unit), by Application 2024 & 2032
- Figure 53: Asia Pacific BCI Industry Revenue Share (%), by Application 2024 & 2032
- Figure 54: Asia Pacific BCI Industry Volume Share (%), by Application 2024 & 2032
- Figure 55: Asia Pacific BCI Industry Revenue (Million), by Country 2024 & 2032
- Figure 56: Asia Pacific BCI Industry Volume (K Unit), by Country 2024 & 2032
- Figure 57: Asia Pacific BCI Industry Revenue Share (%), by Country 2024 & 2032
- Figure 58: Asia Pacific BCI Industry Volume Share (%), by Country 2024 & 2032
- Figure 59: Middle East and Africa BCI Industry Revenue (Million), by Type 2024 & 2032
- Figure 60: Middle East and Africa BCI Industry Volume (K Unit), by Type 2024 & 2032
- Figure 61: Middle East and Africa BCI Industry Revenue Share (%), by Type 2024 & 2032
- Figure 62: Middle East and Africa BCI Industry Volume Share (%), by Type 2024 & 2032
- Figure 63: Middle East and Africa BCI Industry Revenue (Million), by Application 2024 & 2032
- Figure 64: Middle East and Africa BCI Industry Volume (K Unit), by Application 2024 & 2032
- Figure 65: Middle East and Africa BCI Industry Revenue Share (%), by Application 2024 & 2032
- Figure 66: Middle East and Africa BCI Industry Volume Share (%), by Application 2024 & 2032
- Figure 67: Middle East and Africa BCI Industry Revenue (Million), by Country 2024 & 2032
- Figure 68: Middle East and Africa BCI Industry Volume (K Unit), by Country 2024 & 2032
- Figure 69: Middle East and Africa BCI Industry Revenue Share (%), by Country 2024 & 2032
- Figure 70: Middle East and Africa BCI Industry Volume Share (%), by Country 2024 & 2032
- Figure 71: South America BCI Industry Revenue (Million), by Type 2024 & 2032
- Figure 72: South America BCI Industry Volume (K Unit), by Type 2024 & 2032
- Figure 73: South America BCI Industry Revenue Share (%), by Type 2024 & 2032
- Figure 74: South America BCI Industry Volume Share (%), by Type 2024 & 2032
- Figure 75: South America BCI Industry Revenue (Million), by Application 2024 & 2032
- Figure 76: South America BCI Industry Volume (K Unit), by Application 2024 & 2032
- Figure 77: South America BCI Industry Revenue Share (%), by Application 2024 & 2032
- Figure 78: South America BCI Industry Volume Share (%), by Application 2024 & 2032
- Figure 79: South America BCI Industry Revenue (Million), by Country 2024 & 2032
- Figure 80: South America BCI Industry Volume (K Unit), by Country 2024 & 2032
- Figure 81: South America BCI Industry Revenue Share (%), by Country 2024 & 2032
- Figure 82: South America BCI Industry Volume Share (%), by Country 2024 & 2032
List of Tables
- Table 1: Global BCI Industry Revenue Million Forecast, by Region 2019 & 2032
- Table 2: Global BCI Industry Volume K Unit Forecast, by Region 2019 & 2032
- Table 3: Global BCI Industry Revenue Million Forecast, by Type 2019 & 2032
- Table 4: Global BCI Industry Volume K Unit Forecast, by Type 2019 & 2032
- Table 5: Global BCI Industry Revenue Million Forecast, by Application 2019 & 2032
- Table 6: Global BCI Industry Volume K Unit Forecast, by Application 2019 & 2032
- Table 7: Global BCI Industry Revenue Million Forecast, by Region 2019 & 2032
- Table 8: Global BCI Industry Volume K Unit Forecast, by Region 2019 & 2032
- Table 9: Global BCI Industry Revenue Million Forecast, by Country 2019 & 2032
- Table 10: Global BCI Industry Volume K Unit Forecast, by Country 2019 & 2032
- Table 11: United States BCI Industry Revenue (Million) Forecast, by Application 2019 & 2032
- Table 12: United States BCI Industry Volume (K Unit) Forecast, by Application 2019 & 2032
- Table 13: Canada BCI Industry Revenue (Million) Forecast, by Application 2019 & 2032
- Table 14: Canada BCI Industry Volume (K Unit) Forecast, by Application 2019 & 2032
- Table 15: Mexico BCI Industry Revenue (Million) Forecast, by Application 2019 & 2032
- Table 16: Mexico BCI Industry Volume (K Unit) Forecast, by Application 2019 & 2032
- Table 17: Global BCI Industry Revenue Million Forecast, by Country 2019 & 2032
- Table 18: Global BCI Industry Volume K Unit Forecast, by Country 2019 & 2032
- Table 19: Germany BCI Industry Revenue (Million) Forecast, by Application 2019 & 2032
- Table 20: Germany BCI Industry Volume (K Unit) Forecast, by Application 2019 & 2032
- Table 21: United Kingdom BCI Industry Revenue (Million) Forecast, by Application 2019 & 2032
- Table 22: United Kingdom BCI Industry Volume (K Unit) Forecast, by Application 2019 & 2032
- Table 23: France BCI Industry Revenue (Million) Forecast, by Application 2019 & 2032
- Table 24: France BCI Industry Volume (K Unit) Forecast, by Application 2019 & 2032
- Table 25: Italy BCI Industry Revenue (Million) Forecast, by Application 2019 & 2032
- Table 26: Italy BCI Industry Volume (K Unit) Forecast, by Application 2019 & 2032
- Table 27: Spain BCI Industry Revenue (Million) Forecast, by Application 2019 & 2032
- Table 28: Spain BCI Industry Volume (K Unit) Forecast, by Application 2019 & 2032
- Table 29: Rest of Europe BCI Industry Revenue (Million) Forecast, by Application 2019 & 2032
- Table 30: Rest of Europe BCI Industry Volume (K Unit) Forecast, by Application 2019 & 2032
- Table 31: Global BCI Industry Revenue Million Forecast, by Country 2019 & 2032
- Table 32: Global BCI Industry Volume K Unit Forecast, by Country 2019 & 2032
- Table 33: China BCI Industry Revenue (Million) Forecast, by Application 2019 & 2032
- Table 34: China BCI Industry Volume (K Unit) Forecast, by Application 2019 & 2032
- Table 35: Japan BCI Industry Revenue (Million) Forecast, by Application 2019 & 2032
- Table 36: Japan BCI Industry Volume (K Unit) Forecast, by Application 2019 & 2032
- Table 37: India BCI Industry Revenue (Million) Forecast, by Application 2019 & 2032
- Table 38: India BCI Industry Volume (K Unit) Forecast, by Application 2019 & 2032
- Table 39: Australia BCI Industry Revenue (Million) Forecast, by Application 2019 & 2032
- Table 40: Australia BCI Industry Volume (K Unit) Forecast, by Application 2019 & 2032
- Table 41: South Korea BCI Industry Revenue (Million) Forecast, by Application 2019 & 2032
- Table 42: South Korea BCI Industry Volume (K Unit) Forecast, by Application 2019 & 2032
- Table 43: Rest of Asia Pacific BCI Industry Revenue (Million) Forecast, by Application 2019 & 2032
- Table 44: Rest of Asia Pacific BCI Industry Volume (K Unit) Forecast, by Application 2019 & 2032
- Table 45: Global BCI Industry Revenue Million Forecast, by Country 2019 & 2032
- Table 46: Global BCI Industry Volume K Unit Forecast, by Country 2019 & 2032
- Table 47: GCC BCI Industry Revenue (Million) Forecast, by Application 2019 & 2032
- Table 48: GCC BCI Industry Volume (K Unit) Forecast, by Application 2019 & 2032
- Table 49: South Africa BCI Industry Revenue (Million) Forecast, by Application 2019 & 2032
- Table 50: South Africa BCI Industry Volume (K Unit) Forecast, by Application 2019 & 2032
- Table 51: Rest of Middle East and Africa BCI Industry Revenue (Million) Forecast, by Application 2019 & 2032
- Table 52: Rest of Middle East and Africa BCI Industry Volume (K Unit) Forecast, by Application 2019 & 2032
- Table 53: Global BCI Industry Revenue Million Forecast, by Country 2019 & 2032
- Table 54: Global BCI Industry Volume K Unit Forecast, by Country 2019 & 2032
- Table 55: Brazil BCI Industry Revenue (Million) Forecast, by Application 2019 & 2032
- Table 56: Brazil BCI Industry Volume (K Unit) Forecast, by Application 2019 & 2032
- Table 57: Argentina BCI Industry Revenue (Million) Forecast, by Application 2019 & 2032
- Table 58: Argentina BCI Industry Volume (K Unit) Forecast, by Application 2019 & 2032
- Table 59: Rest of South America BCI Industry Revenue (Million) Forecast, by Application 2019 & 2032
- Table 60: Rest of South America BCI Industry Volume (K Unit) Forecast, by Application 2019 & 2032
- Table 61: Global BCI Industry Revenue Million Forecast, by Type 2019 & 2032
- Table 62: Global BCI Industry Volume K Unit Forecast, by Type 2019 & 2032
- Table 63: Global BCI Industry Revenue Million Forecast, by Application 2019 & 2032
- Table 64: Global BCI Industry Volume K Unit Forecast, by Application 2019 & 2032
- Table 65: Global BCI Industry Revenue Million Forecast, by Country 2019 & 2032
- Table 66: Global BCI Industry Volume K Unit Forecast, by Country 2019 & 2032
- Table 67: United States BCI Industry Revenue (Million) Forecast, by Application 2019 & 2032
- Table 68: United States BCI Industry Volume (K Unit) Forecast, by Application 2019 & 2032
- Table 69: Canada BCI Industry Revenue (Million) Forecast, by Application 2019 & 2032
- Table 70: Canada BCI Industry Volume (K Unit) Forecast, by Application 2019 & 2032
- Table 71: Mexico BCI Industry Revenue (Million) Forecast, by Application 2019 & 2032
- Table 72: Mexico BCI Industry Volume (K Unit) Forecast, by Application 2019 & 2032
- Table 73: Global BCI Industry Revenue Million Forecast, by Type 2019 & 2032
- Table 74: Global BCI Industry Volume K Unit Forecast, by Type 2019 & 2032
- Table 75: Global BCI Industry Revenue Million Forecast, by Application 2019 & 2032
- Table 76: Global BCI Industry Volume K Unit Forecast, by Application 2019 & 2032
- Table 77: Global BCI Industry Revenue Million Forecast, by Country 2019 & 2032
- Table 78: Global BCI Industry Volume K Unit Forecast, by Country 2019 & 2032
- Table 79: Germany BCI Industry Revenue (Million) Forecast, by Application 2019 & 2032
- Table 80: Germany BCI Industry Volume (K Unit) Forecast, by Application 2019 & 2032
- Table 81: United Kingdom BCI Industry Revenue (Million) Forecast, by Application 2019 & 2032
- Table 82: United Kingdom BCI Industry Volume (K Unit) Forecast, by Application 2019 & 2032
- Table 83: France BCI Industry Revenue (Million) Forecast, by Application 2019 & 2032
- Table 84: France BCI Industry Volume (K Unit) Forecast, by Application 2019 & 2032
- Table 85: Italy BCI Industry Revenue (Million) Forecast, by Application 2019 & 2032
- Table 86: Italy BCI Industry Volume (K Unit) Forecast, by Application 2019 & 2032
- Table 87: Spain BCI Industry Revenue (Million) Forecast, by Application 2019 & 2032
- Table 88: Spain BCI Industry Volume (K Unit) Forecast, by Application 2019 & 2032
- Table 89: Rest of Europe BCI Industry Revenue (Million) Forecast, by Application 2019 & 2032
- Table 90: Rest of Europe BCI Industry Volume (K Unit) Forecast, by Application 2019 & 2032
- Table 91: Global BCI Industry Revenue Million Forecast, by Type 2019 & 2032
- Table 92: Global BCI Industry Volume K Unit Forecast, by Type 2019 & 2032
- Table 93: Global BCI Industry Revenue Million Forecast, by Application 2019 & 2032
- Table 94: Global BCI Industry Volume K Unit Forecast, by Application 2019 & 2032
- Table 95: Global BCI Industry Revenue Million Forecast, by Country 2019 & 2032
- Table 96: Global BCI Industry Volume K Unit Forecast, by Country 2019 & 2032
- Table 97: China BCI Industry Revenue (Million) Forecast, by Application 2019 & 2032
- Table 98: China BCI Industry Volume (K Unit) Forecast, by Application 2019 & 2032
- Table 99: Japan BCI Industry Revenue (Million) Forecast, by Application 2019 & 2032
- Table 100: Japan BCI Industry Volume (K Unit) Forecast, by Application 2019 & 2032
- Table 101: India BCI Industry Revenue (Million) Forecast, by Application 2019 & 2032
- Table 102: India BCI Industry Volume (K Unit) Forecast, by Application 2019 & 2032
- Table 103: Australia BCI Industry Revenue (Million) Forecast, by Application 2019 & 2032
- Table 104: Australia BCI Industry Volume (K Unit) Forecast, by Application 2019 & 2032
- Table 105: South Korea BCI Industry Revenue (Million) Forecast, by Application 2019 & 2032
- Table 106: South Korea BCI Industry Volume (K Unit) Forecast, by Application 2019 & 2032
- Table 107: Rest of Asia Pacific BCI Industry Revenue (Million) Forecast, by Application 2019 & 2032
- Table 108: Rest of Asia Pacific BCI Industry Volume (K Unit) Forecast, by Application 2019 & 2032
- Table 109: Global BCI Industry Revenue Million Forecast, by Type 2019 & 2032
- Table 110: Global BCI Industry Volume K Unit Forecast, by Type 2019 & 2032
- Table 111: Global BCI Industry Revenue Million Forecast, by Application 2019 & 2032
- Table 112: Global BCI Industry Volume K Unit Forecast, by Application 2019 & 2032
- Table 113: Global BCI Industry Revenue Million Forecast, by Country 2019 & 2032
- Table 114: Global BCI Industry Volume K Unit Forecast, by Country 2019 & 2032
- Table 115: GCC BCI Industry Revenue (Million) Forecast, by Application 2019 & 2032
- Table 116: GCC BCI Industry Volume (K Unit) Forecast, by Application 2019 & 2032
- Table 117: South Africa BCI Industry Revenue (Million) Forecast, by Application 2019 & 2032
- Table 118: South Africa BCI Industry Volume (K Unit) Forecast, by Application 2019 & 2032
- Table 119: Rest of Middle East and Africa BCI Industry Revenue (Million) Forecast, by Application 2019 & 2032
- Table 120: Rest of Middle East and Africa BCI Industry Volume (K Unit) Forecast, by Application 2019 & 2032
- Table 121: Global BCI Industry Revenue Million Forecast, by Type 2019 & 2032
- Table 122: Global BCI Industry Volume K Unit Forecast, by Type 2019 & 2032
- Table 123: Global BCI Industry Revenue Million Forecast, by Application 2019 & 2032
- Table 124: Global BCI Industry Volume K Unit Forecast, by Application 2019 & 2032
- Table 125: Global BCI Industry Revenue Million Forecast, by Country 2019 & 2032
- Table 126: Global BCI Industry Volume K Unit Forecast, by Country 2019 & 2032
- Table 127: Brazil BCI Industry Revenue (Million) Forecast, by Application 2019 & 2032
- Table 128: Brazil BCI Industry Volume (K Unit) Forecast, by Application 2019 & 2032
- Table 129: Argentina BCI Industry Revenue (Million) Forecast, by Application 2019 & 2032
- Table 130: Argentina BCI Industry Volume (K Unit) Forecast, by Application 2019 & 2032
- Table 131: Rest of South America BCI Industry Revenue (Million) Forecast, by Application 2019 & 2032
- Table 132: Rest of South America BCI Industry Volume (K Unit) Forecast, by Application 2019 & 2032
Frequently Asked Questions
1. What is the projected Compound Annual Growth Rate (CAGR) of the BCI Industry?
The projected CAGR is approximately 10.29%.
2. Which companies are prominent players in the BCI Industry?
Key companies in the market include Emotive Incorporation, ANT Neuro, Integra LifeSciences Corporation, NextMind, MindMaze, NIRx Medical Technologies, Natus Medical Inc, Compumedics Ltd, Medtronic PLC, Advanced Brain Monitoring Inc, NeuroSky, Brain Products GmbH, Cadwell Industries Inc, g tec medical engineering GmbH, Nihon Kohden Corporation.
3. What are the main segments of the BCI Industry?
The market segments include Type, Application.
4. Can you provide details about the market size?
The market size is estimated to be USD 2.00 Million as of 2022.
5. What are some drivers contributing to market growth?
Increasing Prevalence of Neurodegenerative Disorders; Rising R&D Activities by Government to Improve the Brain-computer Interface Technology; Various Technological Advancements such as Miniaturization of Devices.
6. What are the notable trends driving market growth?
The Non-invasive Brain-computer Interface Segment is Expected to Dominate the Market During the Forecast Period.
7. Are there any restraints impacting market growth?
High Cost of Brain-computer Interface Devices; Lack of Expertise in Implementing the Systems.
8. Can you provide examples of recent developments in the market?
N/A
9. What pricing options are available for accessing the report?
Pricing options include single-user, multi-user, and enterprise licenses priced at USD 4750, USD 5250, and USD 8750 respectively.
10. Is the market size provided in terms of value or volume?
The market size is provided in terms of value, measured in Million and volume, measured in K Unit.
11. Are there any specific market keywords associated with the report?
Yes, the market keyword associated with the report is "BCI Industry," which aids in identifying and referencing the specific market segment covered.
12. How do I determine which pricing option suits my needs best?
The pricing options vary based on user requirements and access needs. Individual users may opt for single-user licenses, while businesses requiring broader access may choose multi-user or enterprise licenses for cost-effective access to the report.
13. Are there any additional resources or data provided in the BCI Industry report?
While the report offers comprehensive insights, it's advisable to review the specific contents or supplementary materials provided to ascertain if additional resources or data are available.
14. How can I stay updated on further developments or reports in the BCI Industry?
To stay informed about further developments, trends, and reports in the BCI Industry, consider subscribing to industry newsletters, following relevant companies and organizations, or regularly checking reputable industry news sources and publications.
Methodology
Step 1 - Identification of Relevant Samples Size from Population Database


Step 2 - Approaches for Defining Global Market Size (Value, Volume* & Price*)

Note*: In applicable scenarios
Step 3 - Data Sources
Primary Research
- Web Analytics
- Survey Reports
- Research Institute
- Latest Research Reports
- Opinion Leaders
Secondary Research
- Annual Reports
- White Paper
- Latest Press Release
- Industry Association
- Paid Database
- Investor Presentations

Step 4 - Data Triangulation
Involves using different sources of information in order to increase the validity of a study
These sources are likely to be stakeholders in a program - participants, other researchers, program staff, other community members, and so on.
Then we put all data in single framework & apply various statistical tools to find out the dynamic on the market.
During the analysis stage, feedback from the stakeholder groups would be compared to determine areas of agreement as well as areas of divergence


