
Key Insights
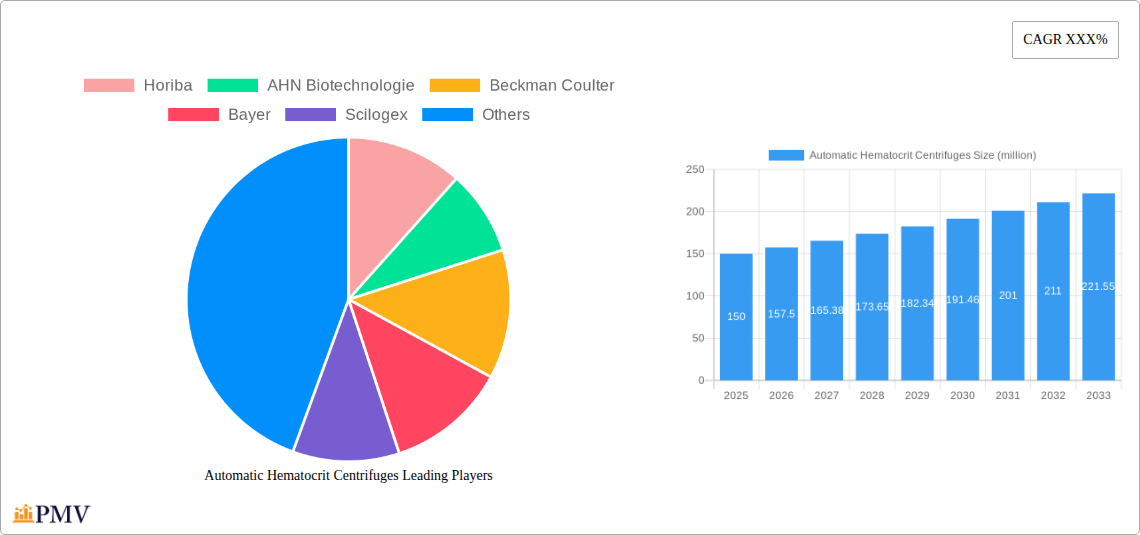
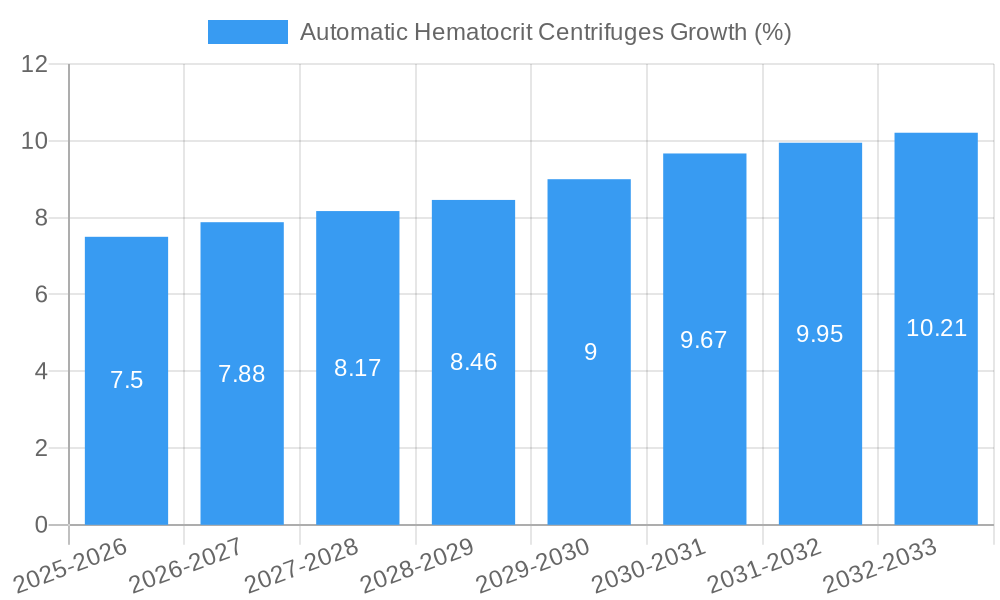
The global market for automatic hematocrit centrifuges is experiencing robust growth, driven by the increasing prevalence of chronic diseases requiring frequent hematological testing, the rising demand for point-of-care diagnostics, and technological advancements leading to faster, more accurate, and automated systems. The market, estimated at $150 million in 2025, is projected to witness a compound annual growth rate (CAGR) of 5% from 2025 to 2033, reaching approximately $220 million by 2033. This growth is fueled by the adoption of automated systems in hospitals, clinics, and diagnostic laboratories, which enhance efficiency and reduce manual errors associated with traditional methods. Key players like Horiba, AHN Biotechnologie, Beckman Coulter, and others are actively contributing to this growth through continuous innovation in centrifuge technology, offering features like enhanced speed control, compact designs, and improved sample handling capabilities. The market is segmented by type (microcentrifuges, tabletop centrifuges), application (clinical diagnostics, research), and end-user (hospitals, diagnostic labs).
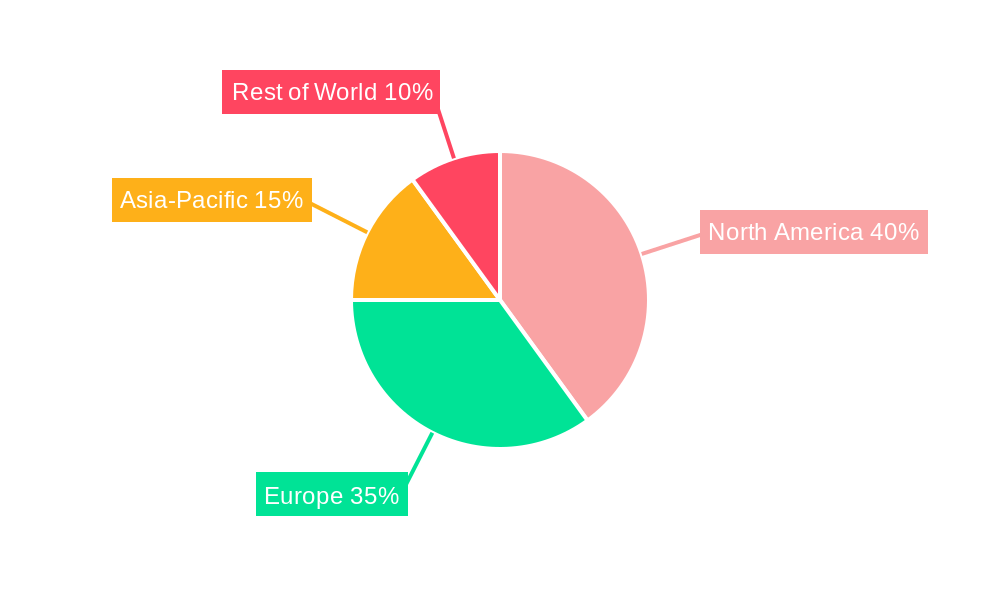
The market's expansion, however, faces certain restraints, including the high initial investment costs associated with advanced automatic hematocrit centrifuges and the potential for stringent regulatory approvals in various regions. Nevertheless, the growing need for rapid and reliable hematological analysis in resource-constrained settings and the increasing integration of hematocrit centrifuges with laboratory information management systems (LIMS) are expected to counteract these challenges and fuel sustained market growth throughout the forecast period. The North American and European markets currently dominate the landscape, but emerging economies in Asia-Pacific are expected to exhibit significant growth due to rising healthcare infrastructure development and increasing healthcare spending. The competitive landscape is characterized by the presence of established players and emerging companies, leading to innovation and competitive pricing, ultimately benefiting end-users.
Automatic Hematocrit Centrifuges Market Report: 2019-2033
This comprehensive report provides a detailed analysis of the global Automatic Hematocrit Centrifuges market, offering invaluable insights for stakeholders across the medical device and diagnostics industries. Covering the period from 2019 to 2033, with a focus on the 2025-2033 forecast, this report meticulously examines market size, growth drivers, competitive dynamics, and emerging trends. The study encompasses key players like Horiba, AHN Biotechnologie, Beckman Coulter, Bayer, Scilogex, Daigger Scientific, Inc, and Hunan Kecheng Instrument and Equipment, providing a granular understanding of market segmentation and future opportunities. This report is crucial for strategic decision-making, investment planning, and competitive analysis within this dynamic sector. The global market is projected to reach xx million by 2033.
Automatic Hematocrit Centrifuges Market Structure & Competitive Dynamics
The global automatic hematocrit centrifuge market exhibits a moderately consolidated structure, with key players holding significant market share. The market concentration is driven by factors including economies of scale, extensive R&D capabilities, and established distribution networks. Innovation ecosystems play a crucial role, with continuous advancements in centrifugation technology, miniaturization, and automation driving product differentiation. Regulatory frameworks, primarily encompassing safety and performance standards, significantly impact market dynamics. The presence of substitute technologies, such as manual hematocrit methods, poses a challenge to market growth, though the efficiency and accuracy of automatic centrifuges continue to drive adoption. End-user trends, including increasing demand from hospitals and diagnostic laboratories, fuel market expansion. Mergers and acquisitions (M&A) activities have been moderate, with deal values totaling approximately xx million in the past five years. Key players have focused on strategic acquisitions to expand their product portfolios and geographic reach.
- Market Share (2024 Estimate): Beckman Coulter (xx%), Horiba (xx%), AHN Biotechnologie (xx%), Others (xx%).
- M&A Activity (2019-2024): Total deal value approximately xx million, with an average deal size of xx million.
- Key Competitive Strategies: Product innovation, strategic partnerships, geographic expansion.
Automatic Hematocrit Centrifuges Industry Trends & Insights
The automatic hematocrit centrifuge market is experiencing robust growth, driven by several key factors. The increasing prevalence of chronic diseases requiring frequent hematological testing fuels high demand. Technological advancements, such as improved automation, faster processing speeds, and enhanced accuracy, are contributing to market expansion. Consumer preferences are shifting towards automated solutions that improve laboratory efficiency and reduce manual workload. This trend is further amplified by the growing adoption of point-of-care testing (POCT) in various healthcare settings. Competitive dynamics are shaped by continuous innovation, strategic partnerships, and the introduction of advanced features such as integrated data management systems. The Compound Annual Growth Rate (CAGR) for the forecast period (2025-2033) is estimated at xx%, indicating significant growth potential. Market penetration in developing economies is gradually increasing, although challenges remain related to infrastructure and affordability.
Dominant Markets & Segments in Automatic Hematocrit Centrifuges
The North American region dominates the global automatic hematocrit centrifuge market, driven by factors including high healthcare expenditure, advanced healthcare infrastructure, and the prevalence of chronic diseases. The United States, in particular, accounts for a significant share of the market.
- Key Drivers in North America:
- High healthcare spending per capita.
- Well-established healthcare infrastructure.
- Strong regulatory support for medical device innovation.
- High prevalence of chronic diseases requiring hematological testing.
The dominance of North America is attributed to factors such as high healthcare expenditure, robust healthcare infrastructure, and high adoption of advanced diagnostic technologies. However, other regions, such as Europe and Asia-Pacific, are expected to witness substantial growth during the forecast period.
Automatic Hematocrit Centrifuges Product Innovations
Recent product innovations in the automatic hematocrit centrifuge market focus on enhancing speed, accuracy, and ease of use. Manufacturers are integrating advanced features such as automated sample loading and unloading, improved rotor designs, and user-friendly software interfaces. These innovations cater to the growing demand for efficient and reliable hematocrit testing in high-throughput laboratories. The trend towards miniaturization and point-of-care testing is also gaining momentum, leading to the development of compact and portable hematocrit centrifuges. These devices enhance the accessibility of hematocrit testing in diverse clinical settings, from hospitals to remote healthcare facilities.
Report Segmentation & Scope
This report segments the automatic hematocrit centrifuge market based on several factors:
By Product Type: This segment categorizes centrifuges based on their capacity, speed, and features, including microhematocrit centrifuges and high-throughput models. Growth projections vary significantly based on the product type; high-throughput models show faster growth.
By End-User: This includes hospitals, diagnostic laboratories, research institutions, and blood banks. Hospitals and diagnostic laboratories contribute to the largest market share due to high demand for accurate and rapid hematocrit analysis.
By Geography: This segment covers key regions such as North America, Europe, Asia-Pacific, Latin America, and the Middle East and Africa. Market sizes and competitive dynamics vary greatly across different regions.
Key Drivers of Automatic Hematocrit Centrifuges Growth
Several key factors drive the growth of the automatic hematocrit centrifuge market. Technological advancements, such as improved automation and enhanced accuracy, are major contributors. The rising prevalence of chronic diseases needing frequent hematological testing fuels demand. Favorable regulatory policies in many regions also support market expansion. Furthermore, increasing healthcare expenditure and improved healthcare infrastructure in developing economies are expanding market opportunities.
Challenges in the Automatic Hematocrit Centrifuges Sector
The automatic hematocrit centrifuge market faces certain challenges. Stringent regulatory requirements and lengthy approval processes can hinder product launches. Supply chain disruptions can impact production and availability, leading to price fluctuations. Intense competition among established players and the emergence of new entrants pose challenges to market profitability. These factors cumulatively impact market growth and require manufacturers to adopt strategic responses.
Leading Players in the Automatic Hematocrit Centrifuges Market
- Horiba
- AHN Biotechnologie
- Beckman Coulter
- Bayer
- Scilogex
- Daigger Scientific, Inc
- Hunan Kecheng Instrument and Equipment
Key Developments in Automatic Hematocrit Centrifuges Sector
- 2022 Q3: Beckman Coulter launched a new high-throughput automatic hematocrit centrifuge with improved accuracy and speed.
- 2023 Q1: Horiba announced a strategic partnership with a major distributor in the Asia-Pacific region to expand its market reach.
- 2024 Q2: AHN Biotechnologie received regulatory approval for its new compact hematocrit centrifuge designed for point-of-care testing. (Further developments will be added in the final report).
Strategic Automatic Hematocrit Centrifuges Market Outlook
The future of the automatic hematocrit centrifuge market is promising, fueled by continuous technological advancements, rising healthcare expenditure, and increasing demand for efficient and accurate hematological testing. Strategic opportunities exist in developing innovative products, expanding into emerging markets, and forging strategic partnerships to enhance market penetration. Manufacturers focusing on product differentiation, improved user experience, and cost-effectiveness will gain a competitive edge in this expanding market.
Automatic Hematocrit Centrifuges Segmentation
-
1. Application
- 1.1. Biochemistry
- 1.2. Medical
- 1.3. Genetics Engineering
- 1.4. Other
-
2. Type
- 2.1. Desktop
- 2.2. Floor-standing
Automatic Hematocrit Centrifuges Segmentation By Geography
-
1. North America
- 1.1. United States
- 1.2. Canada
- 1.3. Mexico
-
2. South America
- 2.1. Brazil
- 2.2. Argentina
- 2.3. Rest of South America
-
3. Europe
- 3.1. United Kingdom
- 3.2. Germany
- 3.3. France
- 3.4. Italy
- 3.5. Spain
- 3.6. Russia
- 3.7. Benelux
- 3.8. Nordics
- 3.9. Rest of Europe
-
4. Middle East & Africa
- 4.1. Turkey
- 4.2. Israel
- 4.3. GCC
- 4.4. North Africa
- 4.5. South Africa
- 4.6. Rest of Middle East & Africa
-
5. Asia Pacific
- 5.1. China
- 5.2. India
- 5.3. Japan
- 5.4. South Korea
- 5.5. ASEAN
- 5.6. Oceania
- 5.7. Rest of Asia Pacific
Automatic Hematocrit Centrifuges REPORT HIGHLIGHTS
| Aspects | Details |
|---|---|
| Study Period | 2019-2033 |
| Base Year | 2024 |
| Estimated Year | 2025 |
| Forecast Period | 2025-2033 |
| Historical Period | 2019-2024 |
| Growth Rate | CAGR of XXX% from 2019-2033 |
| Segmentation |
|
Table of Contents
- 1. Introduction
- 1.1. Research Scope
- 1.2. Market Segmentation
- 1.3. Research Methodology
- 1.4. Definitions and Assumptions
- 2. Executive Summary
- 2.1. Introduction
- 3. Market Dynamics
- 3.1. Introduction
- 3.2. Market Drivers
- 3.3. Market Restrains
- 3.4. Market Trends
- 4. Market Factor Analysis
- 4.1. Porters Five Forces
- 4.2. Supply/Value Chain
- 4.3. PESTEL analysis
- 4.4. Market Entropy
- 4.5. Patent/Trademark Analysis
- 5. Global Automatic Hematocrit Centrifuges Analysis, Insights and Forecast, 2019-2031
- 5.1. Market Analysis, Insights and Forecast - by Application
- 5.1.1. Biochemistry
- 5.1.2. Medical
- 5.1.3. Genetics Engineering
- 5.1.4. Other
- 5.2. Market Analysis, Insights and Forecast - by Type
- 5.2.1. Desktop
- 5.2.2. Floor-standing
- 5.3. Market Analysis, Insights and Forecast - by Region
- 5.3.1. North America
- 5.3.2. South America
- 5.3.3. Europe
- 5.3.4. Middle East & Africa
- 5.3.5. Asia Pacific
- 5.1. Market Analysis, Insights and Forecast - by Application
- 6. North America Automatic Hematocrit Centrifuges Analysis, Insights and Forecast, 2019-2031
- 6.1. Market Analysis, Insights and Forecast - by Application
- 6.1.1. Biochemistry
- 6.1.2. Medical
- 6.1.3. Genetics Engineering
- 6.1.4. Other
- 6.2. Market Analysis, Insights and Forecast - by Type
- 6.2.1. Desktop
- 6.2.2. Floor-standing
- 6.1. Market Analysis, Insights and Forecast - by Application
- 7. South America Automatic Hematocrit Centrifuges Analysis, Insights and Forecast, 2019-2031
- 7.1. Market Analysis, Insights and Forecast - by Application
- 7.1.1. Biochemistry
- 7.1.2. Medical
- 7.1.3. Genetics Engineering
- 7.1.4. Other
- 7.2. Market Analysis, Insights and Forecast - by Type
- 7.2.1. Desktop
- 7.2.2. Floor-standing
- 7.1. Market Analysis, Insights and Forecast - by Application
- 8. Europe Automatic Hematocrit Centrifuges Analysis, Insights and Forecast, 2019-2031
- 8.1. Market Analysis, Insights and Forecast - by Application
- 8.1.1. Biochemistry
- 8.1.2. Medical
- 8.1.3. Genetics Engineering
- 8.1.4. Other
- 8.2. Market Analysis, Insights and Forecast - by Type
- 8.2.1. Desktop
- 8.2.2. Floor-standing
- 8.1. Market Analysis, Insights and Forecast - by Application
- 9. Middle East & Africa Automatic Hematocrit Centrifuges Analysis, Insights and Forecast, 2019-2031
- 9.1. Market Analysis, Insights and Forecast - by Application
- 9.1.1. Biochemistry
- 9.1.2. Medical
- 9.1.3. Genetics Engineering
- 9.1.4. Other
- 9.2. Market Analysis, Insights and Forecast - by Type
- 9.2.1. Desktop
- 9.2.2. Floor-standing
- 9.1. Market Analysis, Insights and Forecast - by Application
- 10. Asia Pacific Automatic Hematocrit Centrifuges Analysis, Insights and Forecast, 2019-2031
- 10.1. Market Analysis, Insights and Forecast - by Application
- 10.1.1. Biochemistry
- 10.1.2. Medical
- 10.1.3. Genetics Engineering
- 10.1.4. Other
- 10.2. Market Analysis, Insights and Forecast - by Type
- 10.2.1. Desktop
- 10.2.2. Floor-standing
- 10.1. Market Analysis, Insights and Forecast - by Application
- 11. Competitive Analysis
- 11.1. Global Market Share Analysis 2024
- 11.2. Company Profiles
- 11.2.1 Horiba
- 11.2.1.1. Overview
- 11.2.1.2. Products
- 11.2.1.3. SWOT Analysis
- 11.2.1.4. Recent Developments
- 11.2.1.5. Financials (Based on Availability)
- 11.2.2 AHN Biotechnologie
- 11.2.2.1. Overview
- 11.2.2.2. Products
- 11.2.2.3. SWOT Analysis
- 11.2.2.4. Recent Developments
- 11.2.2.5. Financials (Based on Availability)
- 11.2.3 Beckman Coulter
- 11.2.3.1. Overview
- 11.2.3.2. Products
- 11.2.3.3. SWOT Analysis
- 11.2.3.4. Recent Developments
- 11.2.3.5. Financials (Based on Availability)
- 11.2.4 Bayer
- 11.2.4.1. Overview
- 11.2.4.2. Products
- 11.2.4.3. SWOT Analysis
- 11.2.4.4. Recent Developments
- 11.2.4.5. Financials (Based on Availability)
- 11.2.5 Scilogex
- 11.2.5.1. Overview
- 11.2.5.2. Products
- 11.2.5.3. SWOT Analysis
- 11.2.5.4. Recent Developments
- 11.2.5.5. Financials (Based on Availability)
- 11.2.6 Daigger Scientific Inc
- 11.2.6.1. Overview
- 11.2.6.2. Products
- 11.2.6.3. SWOT Analysis
- 11.2.6.4. Recent Developments
- 11.2.6.5. Financials (Based on Availability)
- 11.2.7 Hunan Kecheng Instrument and Equipment
- 11.2.7.1. Overview
- 11.2.7.2. Products
- 11.2.7.3. SWOT Analysis
- 11.2.7.4. Recent Developments
- 11.2.7.5. Financials (Based on Availability)
- 11.2.1 Horiba
List of Figures
- Figure 1: Global Automatic Hematocrit Centrifuges Revenue Breakdown (million, %) by Region 2024 & 2032
- Figure 2: Global Automatic Hematocrit Centrifuges Volume Breakdown (K, %) by Region 2024 & 2032
- Figure 3: North America Automatic Hematocrit Centrifuges Revenue (million), by Application 2024 & 2032
- Figure 4: North America Automatic Hematocrit Centrifuges Volume (K), by Application 2024 & 2032
- Figure 5: North America Automatic Hematocrit Centrifuges Revenue Share (%), by Application 2024 & 2032
- Figure 6: North America Automatic Hematocrit Centrifuges Volume Share (%), by Application 2024 & 2032
- Figure 7: North America Automatic Hematocrit Centrifuges Revenue (million), by Type 2024 & 2032
- Figure 8: North America Automatic Hematocrit Centrifuges Volume (K), by Type 2024 & 2032
- Figure 9: North America Automatic Hematocrit Centrifuges Revenue Share (%), by Type 2024 & 2032
- Figure 10: North America Automatic Hematocrit Centrifuges Volume Share (%), by Type 2024 & 2032
- Figure 11: North America Automatic Hematocrit Centrifuges Revenue (million), by Country 2024 & 2032
- Figure 12: North America Automatic Hematocrit Centrifuges Volume (K), by Country 2024 & 2032
- Figure 13: North America Automatic Hematocrit Centrifuges Revenue Share (%), by Country 2024 & 2032
- Figure 14: North America Automatic Hematocrit Centrifuges Volume Share (%), by Country 2024 & 2032
- Figure 15: South America Automatic Hematocrit Centrifuges Revenue (million), by Application 2024 & 2032
- Figure 16: South America Automatic Hematocrit Centrifuges Volume (K), by Application 2024 & 2032
- Figure 17: South America Automatic Hematocrit Centrifuges Revenue Share (%), by Application 2024 & 2032
- Figure 18: South America Automatic Hematocrit Centrifuges Volume Share (%), by Application 2024 & 2032
- Figure 19: South America Automatic Hematocrit Centrifuges Revenue (million), by Type 2024 & 2032
- Figure 20: South America Automatic Hematocrit Centrifuges Volume (K), by Type 2024 & 2032
- Figure 21: South America Automatic Hematocrit Centrifuges Revenue Share (%), by Type 2024 & 2032
- Figure 22: South America Automatic Hematocrit Centrifuges Volume Share (%), by Type 2024 & 2032
- Figure 23: South America Automatic Hematocrit Centrifuges Revenue (million), by Country 2024 & 2032
- Figure 24: South America Automatic Hematocrit Centrifuges Volume (K), by Country 2024 & 2032
- Figure 25: South America Automatic Hematocrit Centrifuges Revenue Share (%), by Country 2024 & 2032
- Figure 26: South America Automatic Hematocrit Centrifuges Volume Share (%), by Country 2024 & 2032
- Figure 27: Europe Automatic Hematocrit Centrifuges Revenue (million), by Application 2024 & 2032
- Figure 28: Europe Automatic Hematocrit Centrifuges Volume (K), by Application 2024 & 2032
- Figure 29: Europe Automatic Hematocrit Centrifuges Revenue Share (%), by Application 2024 & 2032
- Figure 30: Europe Automatic Hematocrit Centrifuges Volume Share (%), by Application 2024 & 2032
- Figure 31: Europe Automatic Hematocrit Centrifuges Revenue (million), by Type 2024 & 2032
- Figure 32: Europe Automatic Hematocrit Centrifuges Volume (K), by Type 2024 & 2032
- Figure 33: Europe Automatic Hematocrit Centrifuges Revenue Share (%), by Type 2024 & 2032
- Figure 34: Europe Automatic Hematocrit Centrifuges Volume Share (%), by Type 2024 & 2032
- Figure 35: Europe Automatic Hematocrit Centrifuges Revenue (million), by Country 2024 & 2032
- Figure 36: Europe Automatic Hematocrit Centrifuges Volume (K), by Country 2024 & 2032
- Figure 37: Europe Automatic Hematocrit Centrifuges Revenue Share (%), by Country 2024 & 2032
- Figure 38: Europe Automatic Hematocrit Centrifuges Volume Share (%), by Country 2024 & 2032
- Figure 39: Middle East & Africa Automatic Hematocrit Centrifuges Revenue (million), by Application 2024 & 2032
- Figure 40: Middle East & Africa Automatic Hematocrit Centrifuges Volume (K), by Application 2024 & 2032
- Figure 41: Middle East & Africa Automatic Hematocrit Centrifuges Revenue Share (%), by Application 2024 & 2032
- Figure 42: Middle East & Africa Automatic Hematocrit Centrifuges Volume Share (%), by Application 2024 & 2032
- Figure 43: Middle East & Africa Automatic Hematocrit Centrifuges Revenue (million), by Type 2024 & 2032
- Figure 44: Middle East & Africa Automatic Hematocrit Centrifuges Volume (K), by Type 2024 & 2032
- Figure 45: Middle East & Africa Automatic Hematocrit Centrifuges Revenue Share (%), by Type 2024 & 2032
- Figure 46: Middle East & Africa Automatic Hematocrit Centrifuges Volume Share (%), by Type 2024 & 2032
- Figure 47: Middle East & Africa Automatic Hematocrit Centrifuges Revenue (million), by Country 2024 & 2032
- Figure 48: Middle East & Africa Automatic Hematocrit Centrifuges Volume (K), by Country 2024 & 2032
- Figure 49: Middle East & Africa Automatic Hematocrit Centrifuges Revenue Share (%), by Country 2024 & 2032
- Figure 50: Middle East & Africa Automatic Hematocrit Centrifuges Volume Share (%), by Country 2024 & 2032
- Figure 51: Asia Pacific Automatic Hematocrit Centrifuges Revenue (million), by Application 2024 & 2032
- Figure 52: Asia Pacific Automatic Hematocrit Centrifuges Volume (K), by Application 2024 & 2032
- Figure 53: Asia Pacific Automatic Hematocrit Centrifuges Revenue Share (%), by Application 2024 & 2032
- Figure 54: Asia Pacific Automatic Hematocrit Centrifuges Volume Share (%), by Application 2024 & 2032
- Figure 55: Asia Pacific Automatic Hematocrit Centrifuges Revenue (million), by Type 2024 & 2032
- Figure 56: Asia Pacific Automatic Hematocrit Centrifuges Volume (K), by Type 2024 & 2032
- Figure 57: Asia Pacific Automatic Hematocrit Centrifuges Revenue Share (%), by Type 2024 & 2032
- Figure 58: Asia Pacific Automatic Hematocrit Centrifuges Volume Share (%), by Type 2024 & 2032
- Figure 59: Asia Pacific Automatic Hematocrit Centrifuges Revenue (million), by Country 2024 & 2032
- Figure 60: Asia Pacific Automatic Hematocrit Centrifuges Volume (K), by Country 2024 & 2032
- Figure 61: Asia Pacific Automatic Hematocrit Centrifuges Revenue Share (%), by Country 2024 & 2032
- Figure 62: Asia Pacific Automatic Hematocrit Centrifuges Volume Share (%), by Country 2024 & 2032
List of Tables
- Table 1: Global Automatic Hematocrit Centrifuges Revenue million Forecast, by Region 2019 & 2032
- Table 2: Global Automatic Hematocrit Centrifuges Volume K Forecast, by Region 2019 & 2032
- Table 3: Global Automatic Hematocrit Centrifuges Revenue million Forecast, by Application 2019 & 2032
- Table 4: Global Automatic Hematocrit Centrifuges Volume K Forecast, by Application 2019 & 2032
- Table 5: Global Automatic Hematocrit Centrifuges Revenue million Forecast, by Type 2019 & 2032
- Table 6: Global Automatic Hematocrit Centrifuges Volume K Forecast, by Type 2019 & 2032
- Table 7: Global Automatic Hematocrit Centrifuges Revenue million Forecast, by Region 2019 & 2032
- Table 8: Global Automatic Hematocrit Centrifuges Volume K Forecast, by Region 2019 & 2032
- Table 9: Global Automatic Hematocrit Centrifuges Revenue million Forecast, by Application 2019 & 2032
- Table 10: Global Automatic Hematocrit Centrifuges Volume K Forecast, by Application 2019 & 2032
- Table 11: Global Automatic Hematocrit Centrifuges Revenue million Forecast, by Type 2019 & 2032
- Table 12: Global Automatic Hematocrit Centrifuges Volume K Forecast, by Type 2019 & 2032
- Table 13: Global Automatic Hematocrit Centrifuges Revenue million Forecast, by Country 2019 & 2032
- Table 14: Global Automatic Hematocrit Centrifuges Volume K Forecast, by Country 2019 & 2032
- Table 15: United States Automatic Hematocrit Centrifuges Revenue (million) Forecast, by Application 2019 & 2032
- Table 16: United States Automatic Hematocrit Centrifuges Volume (K) Forecast, by Application 2019 & 2032
- Table 17: Canada Automatic Hematocrit Centrifuges Revenue (million) Forecast, by Application 2019 & 2032
- Table 18: Canada Automatic Hematocrit Centrifuges Volume (K) Forecast, by Application 2019 & 2032
- Table 19: Mexico Automatic Hematocrit Centrifuges Revenue (million) Forecast, by Application 2019 & 2032
- Table 20: Mexico Automatic Hematocrit Centrifuges Volume (K) Forecast, by Application 2019 & 2032
- Table 21: Global Automatic Hematocrit Centrifuges Revenue million Forecast, by Application 2019 & 2032
- Table 22: Global Automatic Hematocrit Centrifuges Volume K Forecast, by Application 2019 & 2032
- Table 23: Global Automatic Hematocrit Centrifuges Revenue million Forecast, by Type 2019 & 2032
- Table 24: Global Automatic Hematocrit Centrifuges Volume K Forecast, by Type 2019 & 2032
- Table 25: Global Automatic Hematocrit Centrifuges Revenue million Forecast, by Country 2019 & 2032
- Table 26: Global Automatic Hematocrit Centrifuges Volume K Forecast, by Country 2019 & 2032
- Table 27: Brazil Automatic Hematocrit Centrifuges Revenue (million) Forecast, by Application 2019 & 2032
- Table 28: Brazil Automatic Hematocrit Centrifuges Volume (K) Forecast, by Application 2019 & 2032
- Table 29: Argentina Automatic Hematocrit Centrifuges Revenue (million) Forecast, by Application 2019 & 2032
- Table 30: Argentina Automatic Hematocrit Centrifuges Volume (K) Forecast, by Application 2019 & 2032
- Table 31: Rest of South America Automatic Hematocrit Centrifuges Revenue (million) Forecast, by Application 2019 & 2032
- Table 32: Rest of South America Automatic Hematocrit Centrifuges Volume (K) Forecast, by Application 2019 & 2032
- Table 33: Global Automatic Hematocrit Centrifuges Revenue million Forecast, by Application 2019 & 2032
- Table 34: Global Automatic Hematocrit Centrifuges Volume K Forecast, by Application 2019 & 2032
- Table 35: Global Automatic Hematocrit Centrifuges Revenue million Forecast, by Type 2019 & 2032
- Table 36: Global Automatic Hematocrit Centrifuges Volume K Forecast, by Type 2019 & 2032
- Table 37: Global Automatic Hematocrit Centrifuges Revenue million Forecast, by Country 2019 & 2032
- Table 38: Global Automatic Hematocrit Centrifuges Volume K Forecast, by Country 2019 & 2032
- Table 39: United Kingdom Automatic Hematocrit Centrifuges Revenue (million) Forecast, by Application 2019 & 2032
- Table 40: United Kingdom Automatic Hematocrit Centrifuges Volume (K) Forecast, by Application 2019 & 2032
- Table 41: Germany Automatic Hematocrit Centrifuges Revenue (million) Forecast, by Application 2019 & 2032
- Table 42: Germany Automatic Hematocrit Centrifuges Volume (K) Forecast, by Application 2019 & 2032
- Table 43: France Automatic Hematocrit Centrifuges Revenue (million) Forecast, by Application 2019 & 2032
- Table 44: France Automatic Hematocrit Centrifuges Volume (K) Forecast, by Application 2019 & 2032
- Table 45: Italy Automatic Hematocrit Centrifuges Revenue (million) Forecast, by Application 2019 & 2032
- Table 46: Italy Automatic Hematocrit Centrifuges Volume (K) Forecast, by Application 2019 & 2032
- Table 47: Spain Automatic Hematocrit Centrifuges Revenue (million) Forecast, by Application 2019 & 2032
- Table 48: Spain Automatic Hematocrit Centrifuges Volume (K) Forecast, by Application 2019 & 2032
- Table 49: Russia Automatic Hematocrit Centrifuges Revenue (million) Forecast, by Application 2019 & 2032
- Table 50: Russia Automatic Hematocrit Centrifuges Volume (K) Forecast, by Application 2019 & 2032
- Table 51: Benelux Automatic Hematocrit Centrifuges Revenue (million) Forecast, by Application 2019 & 2032
- Table 52: Benelux Automatic Hematocrit Centrifuges Volume (K) Forecast, by Application 2019 & 2032
- Table 53: Nordics Automatic Hematocrit Centrifuges Revenue (million) Forecast, by Application 2019 & 2032
- Table 54: Nordics Automatic Hematocrit Centrifuges Volume (K) Forecast, by Application 2019 & 2032
- Table 55: Rest of Europe Automatic Hematocrit Centrifuges Revenue (million) Forecast, by Application 2019 & 2032
- Table 56: Rest of Europe Automatic Hematocrit Centrifuges Volume (K) Forecast, by Application 2019 & 2032
- Table 57: Global Automatic Hematocrit Centrifuges Revenue million Forecast, by Application 2019 & 2032
- Table 58: Global Automatic Hematocrit Centrifuges Volume K Forecast, by Application 2019 & 2032
- Table 59: Global Automatic Hematocrit Centrifuges Revenue million Forecast, by Type 2019 & 2032
- Table 60: Global Automatic Hematocrit Centrifuges Volume K Forecast, by Type 2019 & 2032
- Table 61: Global Automatic Hematocrit Centrifuges Revenue million Forecast, by Country 2019 & 2032
- Table 62: Global Automatic Hematocrit Centrifuges Volume K Forecast, by Country 2019 & 2032
- Table 63: Turkey Automatic Hematocrit Centrifuges Revenue (million) Forecast, by Application 2019 & 2032
- Table 64: Turkey Automatic Hematocrit Centrifuges Volume (K) Forecast, by Application 2019 & 2032
- Table 65: Israel Automatic Hematocrit Centrifuges Revenue (million) Forecast, by Application 2019 & 2032
- Table 66: Israel Automatic Hematocrit Centrifuges Volume (K) Forecast, by Application 2019 & 2032
- Table 67: GCC Automatic Hematocrit Centrifuges Revenue (million) Forecast, by Application 2019 & 2032
- Table 68: GCC Automatic Hematocrit Centrifuges Volume (K) Forecast, by Application 2019 & 2032
- Table 69: North Africa Automatic Hematocrit Centrifuges Revenue (million) Forecast, by Application 2019 & 2032
- Table 70: North Africa Automatic Hematocrit Centrifuges Volume (K) Forecast, by Application 2019 & 2032
- Table 71: South Africa Automatic Hematocrit Centrifuges Revenue (million) Forecast, by Application 2019 & 2032
- Table 72: South Africa Automatic Hematocrit Centrifuges Volume (K) Forecast, by Application 2019 & 2032
- Table 73: Rest of Middle East & Africa Automatic Hematocrit Centrifuges Revenue (million) Forecast, by Application 2019 & 2032
- Table 74: Rest of Middle East & Africa Automatic Hematocrit Centrifuges Volume (K) Forecast, by Application 2019 & 2032
- Table 75: Global Automatic Hematocrit Centrifuges Revenue million Forecast, by Application 2019 & 2032
- Table 76: Global Automatic Hematocrit Centrifuges Volume K Forecast, by Application 2019 & 2032
- Table 77: Global Automatic Hematocrit Centrifuges Revenue million Forecast, by Type 2019 & 2032
- Table 78: Global Automatic Hematocrit Centrifuges Volume K Forecast, by Type 2019 & 2032
- Table 79: Global Automatic Hematocrit Centrifuges Revenue million Forecast, by Country 2019 & 2032
- Table 80: Global Automatic Hematocrit Centrifuges Volume K Forecast, by Country 2019 & 2032
- Table 81: China Automatic Hematocrit Centrifuges Revenue (million) Forecast, by Application 2019 & 2032
- Table 82: China Automatic Hematocrit Centrifuges Volume (K) Forecast, by Application 2019 & 2032
- Table 83: India Automatic Hematocrit Centrifuges Revenue (million) Forecast, by Application 2019 & 2032
- Table 84: India Automatic Hematocrit Centrifuges Volume (K) Forecast, by Application 2019 & 2032
- Table 85: Japan Automatic Hematocrit Centrifuges Revenue (million) Forecast, by Application 2019 & 2032
- Table 86: Japan Automatic Hematocrit Centrifuges Volume (K) Forecast, by Application 2019 & 2032
- Table 87: South Korea Automatic Hematocrit Centrifuges Revenue (million) Forecast, by Application 2019 & 2032
- Table 88: South Korea Automatic Hematocrit Centrifuges Volume (K) Forecast, by Application 2019 & 2032
- Table 89: ASEAN Automatic Hematocrit Centrifuges Revenue (million) Forecast, by Application 2019 & 2032
- Table 90: ASEAN Automatic Hematocrit Centrifuges Volume (K) Forecast, by Application 2019 & 2032
- Table 91: Oceania Automatic Hematocrit Centrifuges Revenue (million) Forecast, by Application 2019 & 2032
- Table 92: Oceania Automatic Hematocrit Centrifuges Volume (K) Forecast, by Application 2019 & 2032
- Table 93: Rest of Asia Pacific Automatic Hematocrit Centrifuges Revenue (million) Forecast, by Application 2019 & 2032
- Table 94: Rest of Asia Pacific Automatic Hematocrit Centrifuges Volume (K) Forecast, by Application 2019 & 2032
Frequently Asked Questions
1. What is the projected Compound Annual Growth Rate (CAGR) of the Automatic Hematocrit Centrifuges?
The projected CAGR is approximately XXX%.
2. Which companies are prominent players in the Automatic Hematocrit Centrifuges?
Key companies in the market include Horiba, AHN Biotechnologie, Beckman Coulter, Bayer, Scilogex, Daigger Scientific, Inc, Hunan Kecheng Instrument and Equipment.
3. What are the main segments of the Automatic Hematocrit Centrifuges?
The market segments include Application, Type.
4. Can you provide details about the market size?
The market size is estimated to be USD XXX million as of 2022.
5. What are some drivers contributing to market growth?
N/A
6. What are the notable trends driving market growth?
N/A
7. Are there any restraints impacting market growth?
N/A
8. Can you provide examples of recent developments in the market?
N/A
9. What pricing options are available for accessing the report?
Pricing options include single-user, multi-user, and enterprise licenses priced at USD 3950.00, USD 5925.00, and USD 7900.00 respectively.
10. Is the market size provided in terms of value or volume?
The market size is provided in terms of value, measured in million and volume, measured in K.
11. Are there any specific market keywords associated with the report?
Yes, the market keyword associated with the report is "Automatic Hematocrit Centrifuges," which aids in identifying and referencing the specific market segment covered.
12. How do I determine which pricing option suits my needs best?
The pricing options vary based on user requirements and access needs. Individual users may opt for single-user licenses, while businesses requiring broader access may choose multi-user or enterprise licenses for cost-effective access to the report.
13. Are there any additional resources or data provided in the Automatic Hematocrit Centrifuges report?
While the report offers comprehensive insights, it's advisable to review the specific contents or supplementary materials provided to ascertain if additional resources or data are available.
14. How can I stay updated on further developments or reports in the Automatic Hematocrit Centrifuges?
To stay informed about further developments, trends, and reports in the Automatic Hematocrit Centrifuges, consider subscribing to industry newsletters, following relevant companies and organizations, or regularly checking reputable industry news sources and publications.
Methodology
Step 1 - Identification of Relevant Samples Size from Population Database


Step 2 - Approaches for Defining Global Market Size (Value, Volume* & Price*)

Note*: In applicable scenarios
Step 3 - Data Sources
Primary Research
- Web Analytics
- Survey Reports
- Research Institute
- Latest Research Reports
- Opinion Leaders
Secondary Research
- Annual Reports
- White Paper
- Latest Press Release
- Industry Association
- Paid Database
- Investor Presentations

Step 4 - Data Triangulation
Involves using different sources of information in order to increase the validity of a study
These sources are likely to be stakeholders in a program - participants, other researchers, program staff, other community members, and so on.
Then we put all data in single framework & apply various statistical tools to find out the dynamic on the market.
During the analysis stage, feedback from the stakeholder groups would be compared to determine areas of agreement as well as areas of divergence


