
Key Insights
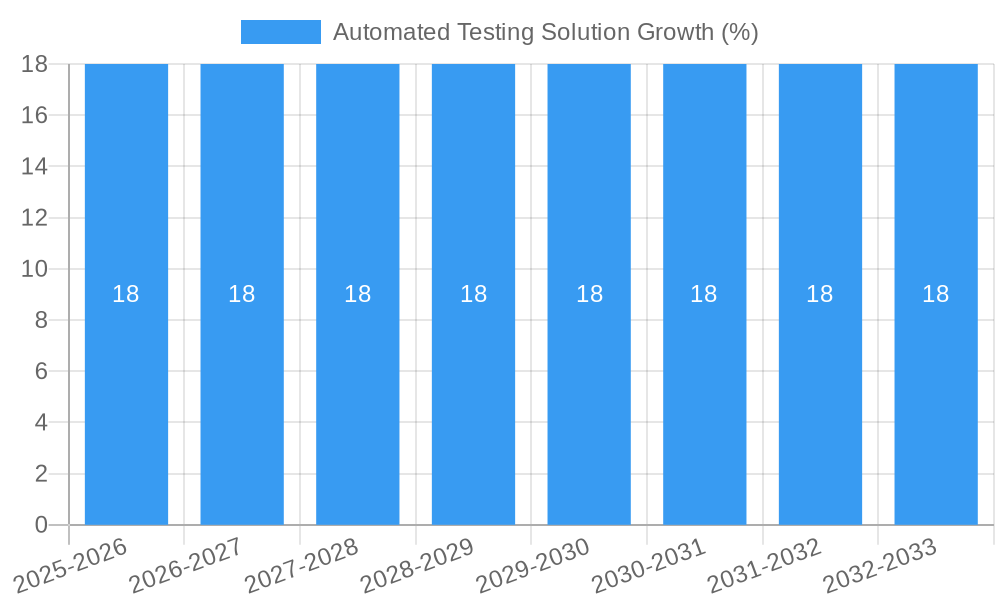
The Automated Testing Solution market is poised for significant expansion, with a projected market size in excess of $15 billion and a robust Compound Annual Growth Rate (CAGR) of approximately 18%. This substantial growth is fueled by the escalating complexity of software development, the increasing demand for faster release cycles, and the critical need for high-quality, bug-free applications. Small and Medium-sized Enterprises (SMEs) are increasingly adopting automated testing solutions to enhance their competitive edge and operational efficiency, mirroring the established usage by large enterprises. The shift towards cloud-based solutions is a dominant trend, offering scalability, flexibility, and cost-effectiveness, though on-premises solutions continue to hold a segment of the market, particularly for organizations with stringent data security requirements. Key drivers include the rise of Agile and DevOps methodologies, which inherently necessitate continuous integration and continuous delivery (CI/CD) pipelines supported by automated testing. Furthermore, the growing adoption of AI and Machine Learning within testing platforms is enhancing predictive capabilities and test script optimization, further accelerating market adoption.
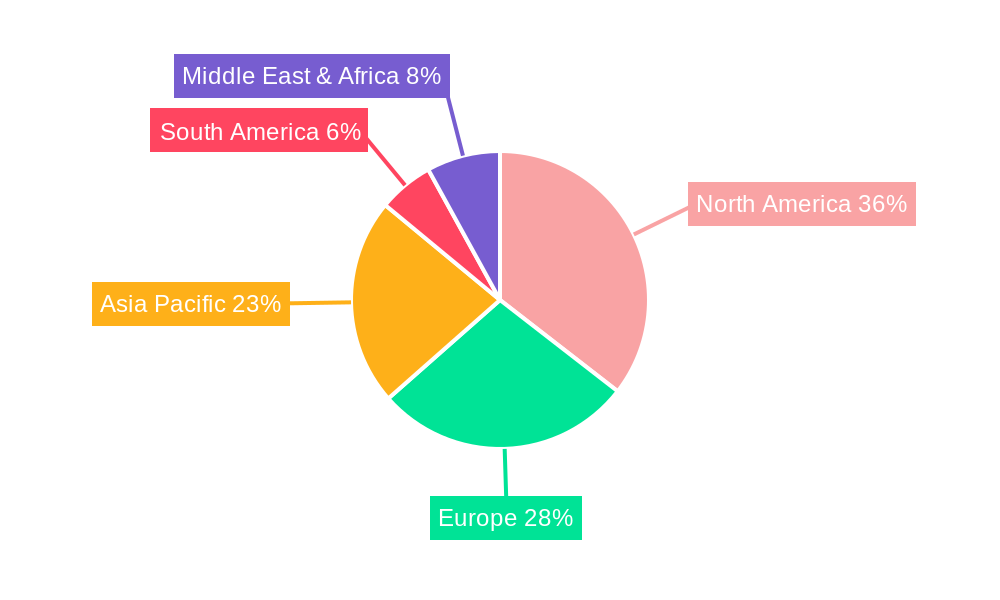
Despite the promising outlook, the market faces certain restraints. The initial cost of implementation, particularly for comprehensive automation suites, can be a barrier for some smaller organizations. A shortage of skilled professionals with expertise in automated testing tools and methodologies also presents a challenge, potentially slowing down widespread adoption. However, the long-term benefits of reduced manual testing effort, improved test coverage, and faster time-to-market are expected to outweigh these initial hurdles. Geographically, North America and Europe currently lead the market due to their early adoption of advanced technologies and strong IT infrastructure. The Asia Pacific region, particularly China and India, is anticipated to witness the fastest growth due to a burgeoning software development sector and increasing investments in digital transformation initiatives. Emerging economies in South America and the Middle East & Africa are also showing promising traction, driven by growing IT spending and a desire to modernize software development practices.
Automated Testing Solution Market Report: Comprehensive Analysis & Forecast (2019–2033)
Unlock the future of software quality with our in-depth Automated Testing Solution Market Report. This definitive guide provides unparalleled insights into market dynamics, competitive landscapes, and future growth trajectories, empowering businesses and stakeholders to make informed strategic decisions. This report delves into the multifaceted world of automated testing, exploring its critical role in modern software development. Discover how tools and platforms from industry leaders like Ranorex, CloudQA, TestCraft Technologies, UiPath, SmartBear Software, mabl, BrowserStack, LEAPWORK, Lambda Computing, and JetBrains are revolutionizing application quality assurance. We cover both Cloud-based and On-premises deployment models, catering to the diverse needs of Small and Medium Enterprises (SMEs) and Large Enterprises.
Automated Testing Solution Market Structure & Competitive Dynamics
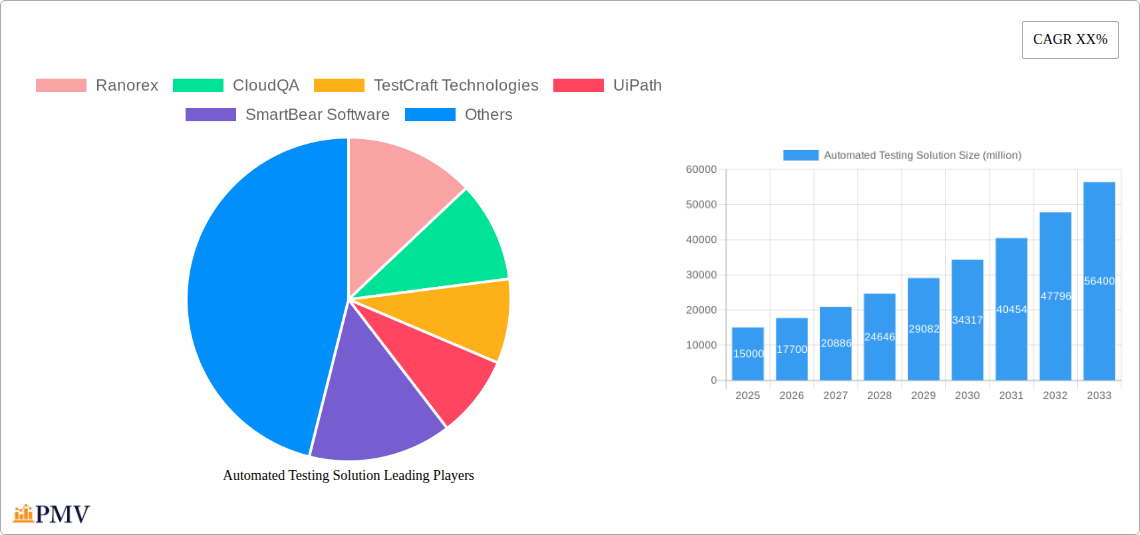
The Automated Testing Solution market exhibits a dynamic and evolving structure, characterized by a moderate to high level of competition. While a few dominant players command significant market share, innovation from emerging companies and specialized providers continually reshapes the landscape. The innovation ecosystem is robust, with continuous advancements in AI, machine learning, and low-code/no-code platforms driving new solution development. Regulatory frameworks, particularly those concerning data privacy and security in critical industries, influence the adoption and implementation of testing solutions. Product substitutes exist, primarily in manual testing and outsourced QA services, but the demonstrable ROI and efficiency gains of automation position it favorably. End-user trends highlight a strong demand for faster release cycles, improved application reliability, and cost optimization. Mergers and acquisitions (M&A) activities are notable, with larger entities acquiring innovative startups to expand their capabilities and market reach. For instance, M&A deal values have reached several hundred million dollars as companies seek to consolidate their positions and acquire advanced technologies. The market share distribution is fluid, with established vendors like SmartBear Software and UiPath maintaining substantial portions, while agile players like mabl and LEAPWORK are steadily gaining traction.
Automated Testing Solution Industry Trends & Insights
The Automated Testing Solution industry is experiencing robust growth, fueled by an escalating demand for efficient, reliable, and high-quality software applications. The compound annual growth rate (CAGR) is projected to be approximately 18% over the forecast period, indicating significant expansion. Market penetration is increasing rapidly across all enterprise segments as organizations recognize the imperative of agile development and continuous delivery. Key market growth drivers include the relentless acceleration of digital transformation initiatives, the increasing complexity of software architectures, and the growing imperative for superior user experience. Technological disruptions are at the forefront, with the integration of Artificial Intelligence (AI) and Machine Learning (ML) transforming test case generation, execution, and defect analysis. AI-powered tools can predict potential failures, optimize test coverage, and reduce false positives, leading to substantial efficiency gains. The rise of low-code/no-code platforms is democratizing test automation, enabling citizen testers and reducing the reliance on highly skilled technical resources. Consumer preferences are increasingly dictating the pace of innovation, with a demand for bug-free, high-performing applications that deliver seamless user experiences across multiple devices and platforms. Competitive dynamics are intensifying, with vendors differentiating themselves through comprehensive feature sets, integration capabilities, advanced analytics, and flexible pricing models. Cloud-based solutions are gaining significant traction due to their scalability, cost-effectiveness, and ease of deployment, further propelling market growth. The shift towards shift-left testing, where testing is integrated earlier in the development lifecycle, is also a major trend. The increasing adoption of DevOps and CI/CD pipelines necessitates sophisticated automated testing solutions that can seamlessly integrate into these workflows. Security testing automation is also becoming a critical component, driven by rising cybersecurity threats. The market penetration for advanced automated testing solutions is expected to exceed 75% in large enterprises by the end of the forecast period.
Dominant Markets & Segments in Automated Testing Solution
The Cloud-based segment is emerging as the dominant force in the Automated Testing Solution market, driven by its inherent scalability, cost-efficiency, and accessibility. This preference is particularly pronounced for Small and Medium Enterprises (SMEs), who benefit from lower upfront investment and subscription-based models that align with their budgetary constraints. For Large Enterprises, cloud solutions offer unparalleled agility to adapt to rapidly changing project demands and global distributed teams. Economic policies that favor cloud adoption and digital infrastructure development further bolster this trend.
- Key Drivers for Cloud-based Dominance:
- Scalability and Elasticity: Cloud platforms can dynamically adjust resources to meet fluctuating testing demands, from individual projects to enterprise-wide initiatives.
- Cost-Effectiveness: Reduced hardware and maintenance costs, coupled with pay-as-you-go models, make cloud solutions attractive for businesses of all sizes.
- Accessibility and Collaboration: Teams can access testing environments and data from anywhere, fostering collaboration among distributed development and QA teams.
- Faster Deployment and Updates: Cloud solutions are quicker to deploy and benefit from continuous updates, ensuring users have access to the latest features and security patches.
- Integration with Cloud Ecosystems: Seamless integration with other cloud-based development and deployment tools (CI/CD pipelines, cloud infrastructure) is a significant advantage.
While On-premises solutions still hold a significant share, especially for organizations with stringent data security and compliance requirements, their growth is gradually being outpaced by cloud offerings. However, hybrid models, combining the benefits of both cloud and on-premises deployments, are also gaining traction. The dominance of the Cloud-based segment is further reinforced by the growing adoption of SaaS models, offering specialized testing functionalities without the burden of infrastructure management. The market size for cloud-based automated testing solutions is projected to reach approximately six million dollars by 2025, with a significant portion of this attributed to its adoption by SMEs. The market penetration of cloud-based solutions in the SME segment is expected to reach over 80% by 2033.
Automated Testing Solution Product Innovations
Product innovations in the Automated Testing Solution market are rapidly advancing, focusing on enhancing efficiency, intelligence, and user-friendliness. Key developments include the integration of AI for intelligent test generation, self-healing test scripts that adapt to UI changes, and advanced analytics for deeper insights into application performance and defect patterns. Solutions are increasingly offering low-code/no-code interfaces, empowering a wider range of users to create and manage automated tests. Competitive advantages stem from comprehensive cross-browser and cross-device testing capabilities, robust integration with CI/CD pipelines, and specialized modules for API testing, performance testing, and security testing. The market fit is driven by the increasing need for faster release cycles and higher application quality in a competitive digital landscape.
Report Segmentation & Scope
This report meticulously segments the Automated Testing Solution market to provide granular insights into its diverse landscape.
- Application Segmentation: The market is analyzed across Small and Medium Enterprises (SMEs) and Large Enterprises. SMEs are characterized by their growing adoption of cost-effective and scalable solutions, while Large Enterprises leverage advanced features for complex, enterprise-wide testing strategies.
- Type Segmentation: The report differentiates between Cloud-based and On-premises deployment models. Cloud-based solutions offer flexibility and scalability, with a projected market size of approximately five million dollars in 2025. On-premises solutions cater to specific security and control needs, with an estimated market size of two million dollars in 2025. Competitive dynamics within each segment highlight vendors specializing in particular deployment models and catering to the unique needs of each application size.
Key Drivers of Automated Testing Solution Growth
The Automated Testing Solution market is propelled by several critical growth drivers. The pervasive adoption of Agile and DevOps methodologies necessitates continuous integration and deployment, making automated testing an indispensable component of efficient software development lifecycles. Digital transformation initiatives across industries are increasing the demand for robust and high-performing applications, driving the need for comprehensive automated testing to ensure quality and speed. The escalating complexity of software applications, including microservices architectures and mobile-first development, also mandates the use of automation to manage testing efficiently. Furthermore, the growing emphasis on customer experience and the need to reduce time-to-market are compelling organizations to invest in solutions that can accelerate testing cycles and improve defect detection rates. Regulatory compliance and the increasing threat landscape for cybersecurity also contribute to the demand for automated security and compliance testing. The overall market is projected to experience a growth of approximately 18% CAGR.
Challenges in the Automated Testing Solution Sector
Despite its significant growth, the Automated Testing Solution sector faces several challenges. The high initial investment and ongoing maintenance costs associated with advanced testing tools can be a barrier, particularly for smaller organizations. Skill gaps and the scarcity of qualified automation engineers pose a significant challenge, requiring substantial investment in training and development. Ensuring the stability and maintainability of test scripts amidst rapidly evolving application UIs and functionalities requires continuous effort and sophisticated tools. Integration complexities with existing legacy systems and diverse technology stacks can also hinder seamless implementation. Moreover, resistance to change within organizations and a lack of understanding regarding the true ROI of automation can impede widespread adoption. The competitive pressure to offer comprehensive features at competitive price points also presents a challenge for vendors. The estimated impact of these challenges on market growth is approximately 10% reduction in potential acceleration.
Leading Players in the Automated Testing Solution Market
- Ranorex
- CloudQA
- TestCraft Technologies
- UiPath
- SmartBear Software
- mabl
- BrowserStack
- LEAPWORK
- Lambda Computing
- JetBrains
Key Developments in Automated Testing Solution Sector
- 2023/11: Ranorex launches a new version of its Studio, introducing enhanced AI-powered test creation capabilities and broader framework support, aiming to streamline test automation for complex desktop and web applications.
- 2024/02: UiPath expands its RPA platform with advanced testing features, integrating its Robotic Process Automation capabilities with its existing test automation suite to offer end-to-end process automation and validation.
- 2024/05: SmartBear Software announces a significant update to its TestComplete platform, focusing on improved integration with CI/CD pipelines and expanded support for modern JavaScript frameworks, enhancing its appeal for agile development teams.
- 2024/07: mabl introduces a new AI-driven low-code testing solution, simplifying the creation and maintenance of end-to-end tests for business users and accelerating application release cycles.
- 2024/09: BrowserStack enhances its cloud testing platform with expanded device coverage and advanced debugging tools, enabling developers to test applications across a wider range of real devices and browsers with greater efficiency.
- 2025/01: LEAPWORK announces a strategic partnership with a leading cloud provider to offer enhanced scalability and global accessibility for its no-code test automation platform.
- 2025/04: TestCraft Technologies rolls out an AI-powered test optimization engine, designed to reduce test execution time and identify redundant test cases, thereby improving test suite efficiency.
Strategic Automated Testing Solution Market Outlook
The strategic outlook for the Automated Testing Solution market is exceptionally bright, with significant growth accelerators in play. The increasing convergence of AI and test automation will unlock unprecedented levels of efficiency and intelligence, enabling predictive testing and self-healing capabilities. The burgeoning demand for low-code/no-code solutions will democratize test automation, empowering a broader user base and further driving adoption across all enterprise segments, particularly SMEs. The continued emphasis on digital transformation and the need for rapid, high-quality software delivery will ensure sustained investment in sophisticated testing solutions. Strategic opportunities lie in developing integrated platforms that offer end-to-end testing capabilities, from functional to performance and security testing, and in providing robust analytics and reporting for actionable insights. The market is poised for further consolidation and innovation, creating a dynamic landscape for stakeholders to capitalize on the evolving needs of the software development ecosystem. The projected market size is expected to reach over twenty million dollars by 2033.
Automated Testing Solution Segmentation
-
1. Application
- 1.1. Small and Medium Enterprises (SMEs)
- 1.2. Large Enterprises
-
2. Types
- 2.1. Cloud-based
- 2.2. On-premises
Automated Testing Solution Segmentation By Geography
-
1. North America
- 1.1. United States
- 1.2. Canada
- 1.3. Mexico
-
2. South America
- 2.1. Brazil
- 2.2. Argentina
- 2.3. Rest of South America
-
3. Europe
- 3.1. United Kingdom
- 3.2. Germany
- 3.3. France
- 3.4. Italy
- 3.5. Spain
- 3.6. Russia
- 3.7. Benelux
- 3.8. Nordics
- 3.9. Rest of Europe
-
4. Middle East & Africa
- 4.1. Turkey
- 4.2. Israel
- 4.3. GCC
- 4.4. North Africa
- 4.5. South Africa
- 4.6. Rest of Middle East & Africa
-
5. Asia Pacific
- 5.1. China
- 5.2. India
- 5.3. Japan
- 5.4. South Korea
- 5.5. ASEAN
- 5.6. Oceania
- 5.7. Rest of Asia Pacific
Automated Testing Solution REPORT HIGHLIGHTS
| Aspects | Details |
|---|---|
| Study Period | 2019-2033 |
| Base Year | 2024 |
| Estimated Year | 2025 |
| Forecast Period | 2025-2033 |
| Historical Period | 2019-2024 |
| Growth Rate | CAGR of XX% from 2019-2033 |
| Segmentation |
|
Table of Contents
- 1. Introduction
- 1.1. Research Scope
- 1.2. Market Segmentation
- 1.3. Research Methodology
- 1.4. Definitions and Assumptions
- 2. Executive Summary
- 2.1. Introduction
- 3. Market Dynamics
- 3.1. Introduction
- 3.2. Market Drivers
- 3.3. Market Restrains
- 3.4. Market Trends
- 4. Market Factor Analysis
- 4.1. Porters Five Forces
- 4.2. Supply/Value Chain
- 4.3. PESTEL analysis
- 4.4. Market Entropy
- 4.5. Patent/Trademark Analysis
- 5. Global Automated Testing Solution Analysis, Insights and Forecast, 2019-2031
- 5.1. Market Analysis, Insights and Forecast - by Application
- 5.1.1. Small and Medium Enterprises (SMEs)
- 5.1.2. Large Enterprises
- 5.2. Market Analysis, Insights and Forecast - by Types
- 5.2.1. Cloud-based
- 5.2.2. On-premises
- 5.3. Market Analysis, Insights and Forecast - by Region
- 5.3.1. North America
- 5.3.2. South America
- 5.3.3. Europe
- 5.3.4. Middle East & Africa
- 5.3.5. Asia Pacific
- 5.1. Market Analysis, Insights and Forecast - by Application
- 6. North America Automated Testing Solution Analysis, Insights and Forecast, 2019-2031
- 6.1. Market Analysis, Insights and Forecast - by Application
- 6.1.1. Small and Medium Enterprises (SMEs)
- 6.1.2. Large Enterprises
- 6.2. Market Analysis, Insights and Forecast - by Types
- 6.2.1. Cloud-based
- 6.2.2. On-premises
- 6.1. Market Analysis, Insights and Forecast - by Application
- 7. South America Automated Testing Solution Analysis, Insights and Forecast, 2019-2031
- 7.1. Market Analysis, Insights and Forecast - by Application
- 7.1.1. Small and Medium Enterprises (SMEs)
- 7.1.2. Large Enterprises
- 7.2. Market Analysis, Insights and Forecast - by Types
- 7.2.1. Cloud-based
- 7.2.2. On-premises
- 7.1. Market Analysis, Insights and Forecast - by Application
- 8. Europe Automated Testing Solution Analysis, Insights and Forecast, 2019-2031
- 8.1. Market Analysis, Insights and Forecast - by Application
- 8.1.1. Small and Medium Enterprises (SMEs)
- 8.1.2. Large Enterprises
- 8.2. Market Analysis, Insights and Forecast - by Types
- 8.2.1. Cloud-based
- 8.2.2. On-premises
- 8.1. Market Analysis, Insights and Forecast - by Application
- 9. Middle East & Africa Automated Testing Solution Analysis, Insights and Forecast, 2019-2031
- 9.1. Market Analysis, Insights and Forecast - by Application
- 9.1.1. Small and Medium Enterprises (SMEs)
- 9.1.2. Large Enterprises
- 9.2. Market Analysis, Insights and Forecast - by Types
- 9.2.1. Cloud-based
- 9.2.2. On-premises
- 9.1. Market Analysis, Insights and Forecast - by Application
- 10. Asia Pacific Automated Testing Solution Analysis, Insights and Forecast, 2019-2031
- 10.1. Market Analysis, Insights and Forecast - by Application
- 10.1.1. Small and Medium Enterprises (SMEs)
- 10.1.2. Large Enterprises
- 10.2. Market Analysis, Insights and Forecast - by Types
- 10.2.1. Cloud-based
- 10.2.2. On-premises
- 10.1. Market Analysis, Insights and Forecast - by Application
- 11. Competitive Analysis
- 11.1. Global Market Share Analysis 2024
- 11.2. Company Profiles
- 11.2.1 Ranorex
- 11.2.1.1. Overview
- 11.2.1.2. Products
- 11.2.1.3. SWOT Analysis
- 11.2.1.4. Recent Developments
- 11.2.1.5. Financials (Based on Availability)
- 11.2.2 CloudQA
- 11.2.2.1. Overview
- 11.2.2.2. Products
- 11.2.2.3. SWOT Analysis
- 11.2.2.4. Recent Developments
- 11.2.2.5. Financials (Based on Availability)
- 11.2.3 TestCraft Technologies
- 11.2.3.1. Overview
- 11.2.3.2. Products
- 11.2.3.3. SWOT Analysis
- 11.2.3.4. Recent Developments
- 11.2.3.5. Financials (Based on Availability)
- 11.2.4 UiPath
- 11.2.4.1. Overview
- 11.2.4.2. Products
- 11.2.4.3. SWOT Analysis
- 11.2.4.4. Recent Developments
- 11.2.4.5. Financials (Based on Availability)
- 11.2.5 SmartBear Software
- 11.2.5.1. Overview
- 11.2.5.2. Products
- 11.2.5.3. SWOT Analysis
- 11.2.5.4. Recent Developments
- 11.2.5.5. Financials (Based on Availability)
- 11.2.6 mabl
- 11.2.6.1. Overview
- 11.2.6.2. Products
- 11.2.6.3. SWOT Analysis
- 11.2.6.4. Recent Developments
- 11.2.6.5. Financials (Based on Availability)
- 11.2.7 BrowserStack
- 11.2.7.1. Overview
- 11.2.7.2. Products
- 11.2.7.3. SWOT Analysis
- 11.2.7.4. Recent Developments
- 11.2.7.5. Financials (Based on Availability)
- 11.2.8 LEAPWORK
- 11.2.8.1. Overview
- 11.2.8.2. Products
- 11.2.8.3. SWOT Analysis
- 11.2.8.4. Recent Developments
- 11.2.8.5. Financials (Based on Availability)
- 11.2.9 Lambda Computing
- 11.2.9.1. Overview
- 11.2.9.2. Products
- 11.2.9.3. SWOT Analysis
- 11.2.9.4. Recent Developments
- 11.2.9.5. Financials (Based on Availability)
- 11.2.10 JetBrains
- 11.2.10.1. Overview
- 11.2.10.2. Products
- 11.2.10.3. SWOT Analysis
- 11.2.10.4. Recent Developments
- 11.2.10.5. Financials (Based on Availability)
- 11.2.1 Ranorex
List of Figures
- Figure 1: Global Automated Testing Solution Revenue Breakdown (million, %) by Region 2024 & 2032
- Figure 2: North America Automated Testing Solution Revenue (million), by Application 2024 & 2032
- Figure 3: North America Automated Testing Solution Revenue Share (%), by Application 2024 & 2032
- Figure 4: North America Automated Testing Solution Revenue (million), by Types 2024 & 2032
- Figure 5: North America Automated Testing Solution Revenue Share (%), by Types 2024 & 2032
- Figure 6: North America Automated Testing Solution Revenue (million), by Country 2024 & 2032
- Figure 7: North America Automated Testing Solution Revenue Share (%), by Country 2024 & 2032
- Figure 8: South America Automated Testing Solution Revenue (million), by Application 2024 & 2032
- Figure 9: South America Automated Testing Solution Revenue Share (%), by Application 2024 & 2032
- Figure 10: South America Automated Testing Solution Revenue (million), by Types 2024 & 2032
- Figure 11: South America Automated Testing Solution Revenue Share (%), by Types 2024 & 2032
- Figure 12: South America Automated Testing Solution Revenue (million), by Country 2024 & 2032
- Figure 13: South America Automated Testing Solution Revenue Share (%), by Country 2024 & 2032
- Figure 14: Europe Automated Testing Solution Revenue (million), by Application 2024 & 2032
- Figure 15: Europe Automated Testing Solution Revenue Share (%), by Application 2024 & 2032
- Figure 16: Europe Automated Testing Solution Revenue (million), by Types 2024 & 2032
- Figure 17: Europe Automated Testing Solution Revenue Share (%), by Types 2024 & 2032
- Figure 18: Europe Automated Testing Solution Revenue (million), by Country 2024 & 2032
- Figure 19: Europe Automated Testing Solution Revenue Share (%), by Country 2024 & 2032
- Figure 20: Middle East & Africa Automated Testing Solution Revenue (million), by Application 2024 & 2032
- Figure 21: Middle East & Africa Automated Testing Solution Revenue Share (%), by Application 2024 & 2032
- Figure 22: Middle East & Africa Automated Testing Solution Revenue (million), by Types 2024 & 2032
- Figure 23: Middle East & Africa Automated Testing Solution Revenue Share (%), by Types 2024 & 2032
- Figure 24: Middle East & Africa Automated Testing Solution Revenue (million), by Country 2024 & 2032
- Figure 25: Middle East & Africa Automated Testing Solution Revenue Share (%), by Country 2024 & 2032
- Figure 26: Asia Pacific Automated Testing Solution Revenue (million), by Application 2024 & 2032
- Figure 27: Asia Pacific Automated Testing Solution Revenue Share (%), by Application 2024 & 2032
- Figure 28: Asia Pacific Automated Testing Solution Revenue (million), by Types 2024 & 2032
- Figure 29: Asia Pacific Automated Testing Solution Revenue Share (%), by Types 2024 & 2032
- Figure 30: Asia Pacific Automated Testing Solution Revenue (million), by Country 2024 & 2032
- Figure 31: Asia Pacific Automated Testing Solution Revenue Share (%), by Country 2024 & 2032
List of Tables
- Table 1: Global Automated Testing Solution Revenue million Forecast, by Region 2019 & 2032
- Table 2: Global Automated Testing Solution Revenue million Forecast, by Application 2019 & 2032
- Table 3: Global Automated Testing Solution Revenue million Forecast, by Types 2019 & 2032
- Table 4: Global Automated Testing Solution Revenue million Forecast, by Region 2019 & 2032
- Table 5: Global Automated Testing Solution Revenue million Forecast, by Application 2019 & 2032
- Table 6: Global Automated Testing Solution Revenue million Forecast, by Types 2019 & 2032
- Table 7: Global Automated Testing Solution Revenue million Forecast, by Country 2019 & 2032
- Table 8: United States Automated Testing Solution Revenue (million) Forecast, by Application 2019 & 2032
- Table 9: Canada Automated Testing Solution Revenue (million) Forecast, by Application 2019 & 2032
- Table 10: Mexico Automated Testing Solution Revenue (million) Forecast, by Application 2019 & 2032
- Table 11: Global Automated Testing Solution Revenue million Forecast, by Application 2019 & 2032
- Table 12: Global Automated Testing Solution Revenue million Forecast, by Types 2019 & 2032
- Table 13: Global Automated Testing Solution Revenue million Forecast, by Country 2019 & 2032
- Table 14: Brazil Automated Testing Solution Revenue (million) Forecast, by Application 2019 & 2032
- Table 15: Argentina Automated Testing Solution Revenue (million) Forecast, by Application 2019 & 2032
- Table 16: Rest of South America Automated Testing Solution Revenue (million) Forecast, by Application 2019 & 2032
- Table 17: Global Automated Testing Solution Revenue million Forecast, by Application 2019 & 2032
- Table 18: Global Automated Testing Solution Revenue million Forecast, by Types 2019 & 2032
- Table 19: Global Automated Testing Solution Revenue million Forecast, by Country 2019 & 2032
- Table 20: United Kingdom Automated Testing Solution Revenue (million) Forecast, by Application 2019 & 2032
- Table 21: Germany Automated Testing Solution Revenue (million) Forecast, by Application 2019 & 2032
- Table 22: France Automated Testing Solution Revenue (million) Forecast, by Application 2019 & 2032
- Table 23: Italy Automated Testing Solution Revenue (million) Forecast, by Application 2019 & 2032
- Table 24: Spain Automated Testing Solution Revenue (million) Forecast, by Application 2019 & 2032
- Table 25: Russia Automated Testing Solution Revenue (million) Forecast, by Application 2019 & 2032
- Table 26: Benelux Automated Testing Solution Revenue (million) Forecast, by Application 2019 & 2032
- Table 27: Nordics Automated Testing Solution Revenue (million) Forecast, by Application 2019 & 2032
- Table 28: Rest of Europe Automated Testing Solution Revenue (million) Forecast, by Application 2019 & 2032
- Table 29: Global Automated Testing Solution Revenue million Forecast, by Application 2019 & 2032
- Table 30: Global Automated Testing Solution Revenue million Forecast, by Types 2019 & 2032
- Table 31: Global Automated Testing Solution Revenue million Forecast, by Country 2019 & 2032
- Table 32: Turkey Automated Testing Solution Revenue (million) Forecast, by Application 2019 & 2032
- Table 33: Israel Automated Testing Solution Revenue (million) Forecast, by Application 2019 & 2032
- Table 34: GCC Automated Testing Solution Revenue (million) Forecast, by Application 2019 & 2032
- Table 35: North Africa Automated Testing Solution Revenue (million) Forecast, by Application 2019 & 2032
- Table 36: South Africa Automated Testing Solution Revenue (million) Forecast, by Application 2019 & 2032
- Table 37: Rest of Middle East & Africa Automated Testing Solution Revenue (million) Forecast, by Application 2019 & 2032
- Table 38: Global Automated Testing Solution Revenue million Forecast, by Application 2019 & 2032
- Table 39: Global Automated Testing Solution Revenue million Forecast, by Types 2019 & 2032
- Table 40: Global Automated Testing Solution Revenue million Forecast, by Country 2019 & 2032
- Table 41: China Automated Testing Solution Revenue (million) Forecast, by Application 2019 & 2032
- Table 42: India Automated Testing Solution Revenue (million) Forecast, by Application 2019 & 2032
- Table 43: Japan Automated Testing Solution Revenue (million) Forecast, by Application 2019 & 2032
- Table 44: South Korea Automated Testing Solution Revenue (million) Forecast, by Application 2019 & 2032
- Table 45: ASEAN Automated Testing Solution Revenue (million) Forecast, by Application 2019 & 2032
- Table 46: Oceania Automated Testing Solution Revenue (million) Forecast, by Application 2019 & 2032
- Table 47: Rest of Asia Pacific Automated Testing Solution Revenue (million) Forecast, by Application 2019 & 2032
Frequently Asked Questions
1. What is the projected Compound Annual Growth Rate (CAGR) of the Automated Testing Solution?
The projected CAGR is approximately XX%.
2. Which companies are prominent players in the Automated Testing Solution?
Key companies in the market include Ranorex, CloudQA, TestCraft Technologies, UiPath, SmartBear Software, mabl, BrowserStack, LEAPWORK, Lambda Computing, JetBrains.
3. What are the main segments of the Automated Testing Solution?
The market segments include Application, Types.
4. Can you provide details about the market size?
The market size is estimated to be USD XXX million as of 2022.
5. What are some drivers contributing to market growth?
N/A
6. What are the notable trends driving market growth?
N/A
7. Are there any restraints impacting market growth?
N/A
8. Can you provide examples of recent developments in the market?
N/A
9. What pricing options are available for accessing the report?
Pricing options include single-user, multi-user, and enterprise licenses priced at USD 4900.00, USD 7350.00, and USD 9800.00 respectively.
10. Is the market size provided in terms of value or volume?
The market size is provided in terms of value, measured in million.
11. Are there any specific market keywords associated with the report?
Yes, the market keyword associated with the report is "Automated Testing Solution," which aids in identifying and referencing the specific market segment covered.
12. How do I determine which pricing option suits my needs best?
The pricing options vary based on user requirements and access needs. Individual users may opt for single-user licenses, while businesses requiring broader access may choose multi-user or enterprise licenses for cost-effective access to the report.
13. Are there any additional resources or data provided in the Automated Testing Solution report?
While the report offers comprehensive insights, it's advisable to review the specific contents or supplementary materials provided to ascertain if additional resources or data are available.
14. How can I stay updated on further developments or reports in the Automated Testing Solution?
To stay informed about further developments, trends, and reports in the Automated Testing Solution, consider subscribing to industry newsletters, following relevant companies and organizations, or regularly checking reputable industry news sources and publications.
Methodology
Step 1 - Identification of Relevant Samples Size from Population Database


Step 2 - Approaches for Defining Global Market Size (Value, Volume* & Price*)

Note*: In applicable scenarios
Step 3 - Data Sources
Primary Research
- Web Analytics
- Survey Reports
- Research Institute
- Latest Research Reports
- Opinion Leaders
Secondary Research
- Annual Reports
- White Paper
- Latest Press Release
- Industry Association
- Paid Database
- Investor Presentations

Step 4 - Data Triangulation
Involves using different sources of information in order to increase the validity of a study
These sources are likely to be stakeholders in a program - participants, other researchers, program staff, other community members, and so on.
Then we put all data in single framework & apply various statistical tools to find out the dynamic on the market.
During the analysis stage, feedback from the stakeholder groups would be compared to determine areas of agreement as well as areas of divergence


