
Key Insights
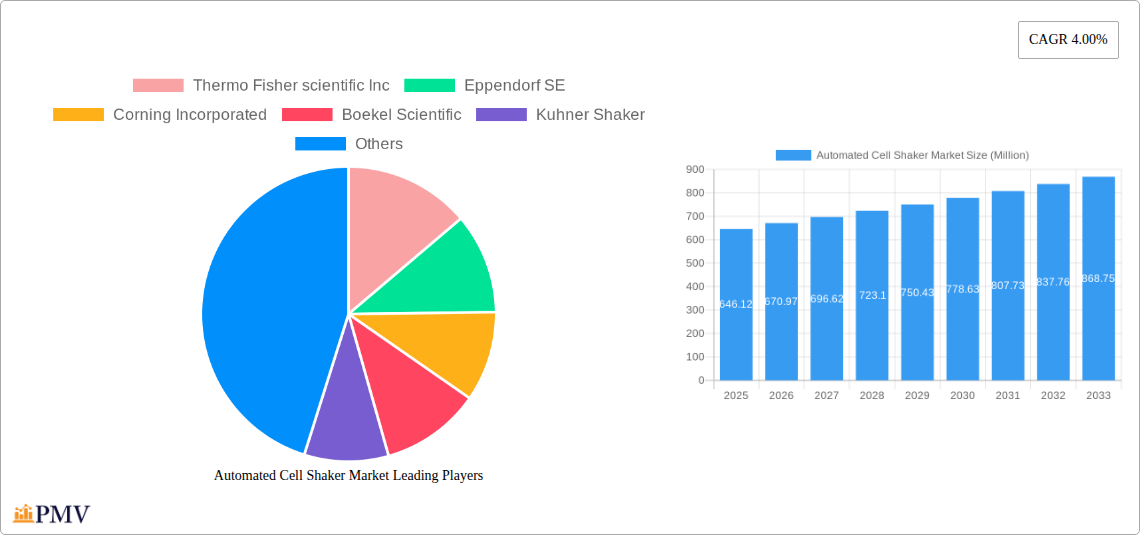
The automated cell shaker market, valued at $646.12 million in 2025, is projected to experience robust growth, driven by increasing demand for high-throughput screening in pharmaceutical and biotechnology research. Automation significantly improves efficiency and reproducibility in cell culture experiments, leading to faster drug discovery and development. The market's expansion is fueled by technological advancements resulting in more sophisticated shakers with enhanced features like precise temperature control, orbital shaking patterns, and integrated data logging capabilities. Growing adoption of cell-based assays across various applications, including toxicology studies and personalized medicine, further contributes to market growth. Competition among major players such as Thermo Fisher Scientific, Eppendorf, and Corning Incorporated is intensifying, resulting in continuous innovation and the introduction of advanced products catering to specific research needs. This competitive landscape drives down prices and expands access to high-quality automated cell shakers for a broader range of researchers. The market is segmented by type (orbital, reciprocating, etc.), capacity, and application, reflecting a diverse range of user requirements. Expansion into emerging economies with growing research infrastructure and an increasing focus on life sciences will contribute significantly to the market's future expansion.
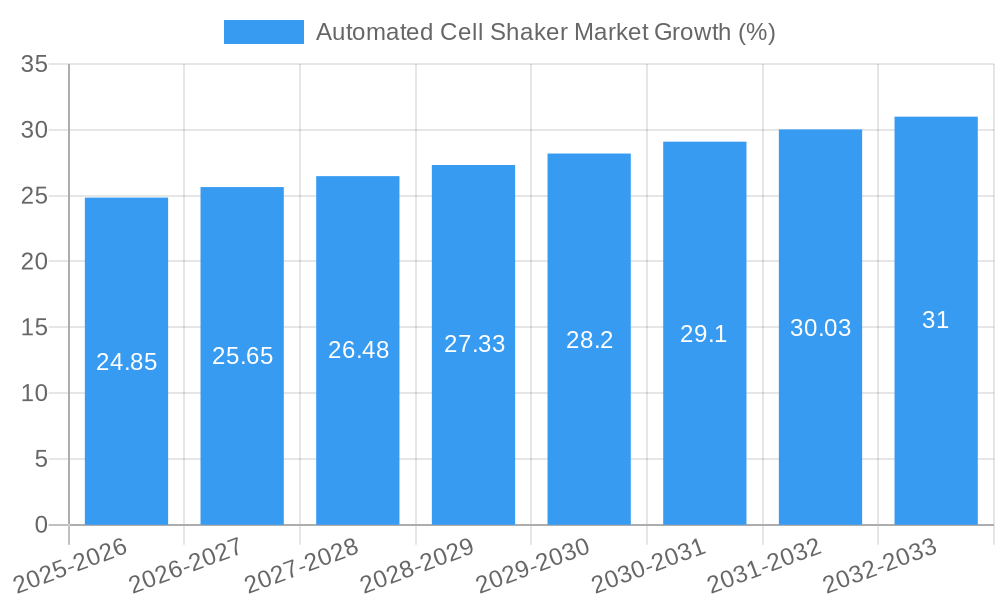
Looking forward, the 4% Compound Annual Growth Rate (CAGR) projected for the forecast period (2025-2033) suggests consistent market expansion. However, factors such as the high initial investment cost of automated cell shakers and the availability of alternative, manual methods could act as restraints. Nevertheless, the long-term benefits in terms of increased efficiency and improved data quality outweigh the initial cost, making automated shakers a worthwhile investment for many research laboratories. The market is expected to witness a shift toward more sophisticated models equipped with advanced functionalities and connectivity features. The integration of these systems with other laboratory automation solutions will be a key trend driving future market growth. Continued innovation and strategic partnerships between manufacturers and research institutions will play a pivotal role in shaping the future of the automated cell shaker market.
Automated Cell Shaker Market: A Comprehensive Report (2019-2033)
This in-depth report provides a comprehensive analysis of the Automated Cell Shaker Market, offering invaluable insights for stakeholders seeking to understand its current state and future trajectory. The study period spans from 2019 to 2033, with 2025 serving as the base and estimated year. The forecast period covers 2025-2033, while the historical period encompasses 2019-2024. The report leverages extensive primary and secondary research to deliver actionable intelligence.
Automated Cell Shaker Market Market Structure & Competitive Dynamics
The Automated Cell Shaker market exhibits a moderately concentrated structure, with key players like Thermo Fisher Scientific Inc., Eppendorf SE, Corning Incorporated, and Sartorius AG holding significant market share. The market share of these leading companies is estimated to be around xx% collectively in 2025. Innovation within the ecosystem is driven by ongoing R&D efforts focused on improving shaker functionality, precision, and automation capabilities. Regulatory frameworks, particularly those related to laboratory safety and equipment standards, influence market dynamics. Product substitutes, such as manual shakers, exist but offer limited automation capabilities, hindering their competitiveness. End-user trends indicate a growing preference for automated systems due to increased throughput needs and reduced human error. M&A activities within the sector have been relatively moderate in recent years, with deal values averaging approximately xx Million USD annually during the historical period. Further consolidation is anticipated in the forecast period as larger players seek to expand their market share and product portfolios.
- Market Concentration: Moderately concentrated
- Key Players’ Collective Market Share (2025): xx%
- Average M&A Deal Value (2019-2024): xx Million USD
Automated Cell Shaker Market Industry Trends & Insights
The Automated Cell Shaker market is experiencing robust growth, driven by several key factors. The rising adoption of cell-based assays in drug discovery, biotechnology, and academic research is a major catalyst. Technological advancements, such as the integration of advanced control systems and data analytics, are enhancing shaker efficiency and data reliability. Consumer preferences are shifting towards automated, high-throughput systems that minimize manual intervention and improve reproducibility. This has led to an increase in demand for sophisticated features like precise temperature and speed control, along with integrated monitoring capabilities. Intense competition among established and emerging players is fostering innovation and price optimization. The market is expected to register a CAGR of xx% during the forecast period (2025-2033), with market penetration expected to reach xx% by 2033.
Dominant Markets & Segments in Automated Cell Shaker Market
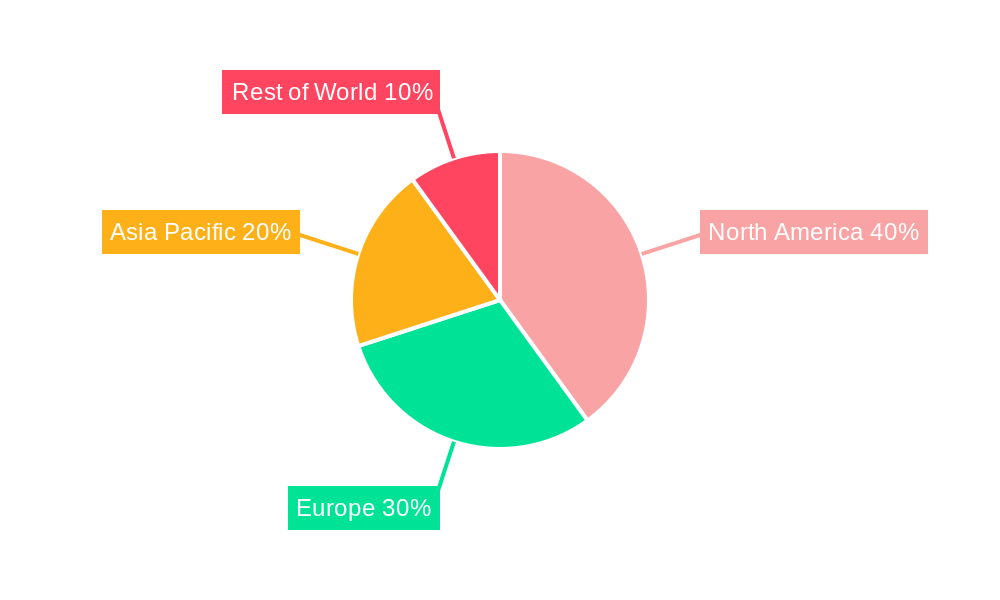
The North American region currently dominates the Automated Cell Shaker market, owing to the presence of major research institutions, pharmaceutical companies, and robust healthcare infrastructure. Strong government funding for research initiatives and a high adoption rate of advanced laboratory technologies also contribute to this regional dominance.
Key Drivers for North American Dominance:
- High concentration of research institutions and pharmaceutical companies.
- Significant government funding for life science research.
- Advanced healthcare infrastructure and a high adoption rate of new technologies.
- Stringent regulatory frameworks driving the demand for high-quality equipment.
Other Significant Regions:
Europe and Asia-Pacific are also showing strong growth, driven by increasing investment in biotechnology and pharmaceutical sectors. However, the market penetration is still lower than in North America.
Automated Cell Shaker Market Product Innovations
Recent product innovations focus on enhancing automation levels, improving precision, and integrating advanced data management capabilities. Miniaturized shakers are gaining traction due to their space-saving designs and cost-effectiveness. Smart features, such as remote monitoring and data logging capabilities, are becoming increasingly prevalent, improving usability and efficiency. These innovations cater to the growing need for automated, high-throughput solutions in various research and industrial applications, providing significant competitive advantages for manufacturers.
Report Segmentation & Scope
The Automated Cell Shaker Market is segmented based on several key factors, offering a granular view of market dynamics. These include:
By Type: Orbital shakers, linear shakers, incubator shakers, etc., each exhibiting varying growth rates and market sizes based on their specific applications and functionalities. Growth projections vary across these segments, reflecting the distinct demands of different research and industrial settings. Competitive dynamics within each segment vary depending on the technological complexity and the specific functionalities offered.
By Application: Pharmaceutical and biotechnology, academic research, environmental testing, and others. Each application segment presents unique growth opportunities and challenges, shaped by the specific needs and regulatory landscapes of each sector.
By End-User: Research institutions, pharmaceutical companies, biotechnology firms, and contract research organizations. The varying needs and budget constraints of each end-user segment directly influence their equipment choices and market demand.
Key Drivers of Automated Cell Shaker Market Growth
Several factors fuel the growth of the Automated Cell Shaker market. Firstly, the surging demand for cell-based assays in drug discovery and development necessitates sophisticated shaking mechanisms for optimal cell culturing. Secondly, technological advancements such as precise temperature control and improved automation capabilities continue to improve efficiency and reproducibility. Lastly, increasing investments in research and development within the biotechnology and pharmaceutical sectors are driving the adoption of advanced laboratory equipment.
Challenges in the Automated Cell Shaker Market Sector
The Automated Cell Shaker market faces several challenges. High initial investment costs can hinder adoption among smaller research labs and companies. Supply chain disruptions, particularly for specialized components, can impact production and lead times. Intense competition among manufacturers leads to price pressure and necessitates continuous innovation to maintain a competitive edge. Furthermore, stringent regulatory compliance requirements add complexity and cost to product development and market entry. These factors influence the overall market growth rate and impact individual players' market positions.
Leading Players in the Automated Cell Shaker Market Market
- Thermo Fisher Scientific Inc.
- Eppendorf SE
- Corning Incorporated
- Boekel Scientific
- Kuhner Shaker
- Heidolph
- VELP Scientifica
- Grant Instruments
- OHAUS Corporation
- Labnet International
- VWR International
- Sartorius AG *List Not Exhaustive
Key Developments in Automated Cell Shaker Market Sector
- Jan 2023: Thermo Fisher Scientific launched a new high-throughput automated cell shaker with advanced data logging capabilities.
- Oct 2022: Eppendorf SE announced a strategic partnership with a leading cell culture media supplier to offer integrated solutions.
- June 2021: Sartorius AG acquired a smaller competitor specializing in miniaturized cell shakers. (Further details on specific acquisitions and launches are available in the full report.)
Strategic Automated Cell Shaker Market Market Outlook
The Automated Cell Shaker market is poised for significant growth in the coming years, driven by sustained investments in life sciences research and the increasing demand for high-throughput automation solutions. Strategic opportunities exist for players who can develop innovative products tailored to specific niche applications, such as personalized medicine and advanced cell therapies. Further consolidation and strategic partnerships are expected, with a focus on enhancing product portfolios and expanding market reach. Companies that can effectively navigate regulatory complexities and address supply chain challenges will be best positioned to capitalize on the market’s growth potential.
Automated Cell Shaker Market Segmentation
-
1. Product
- 1.1. Automated Cell Shakers
- 1.2. Orbital Shakers
- 1.3. Ambient Shakers
- 1.4. Benchtop Incubator Shakers
- 1.5. Cell Shaker with Rotatory Arms
- 1.6. Accessories
-
2. Cell Culture Type
- 2.1. Infinite Cell Line Cultures
- 2.2. Finite Cell Line Cultures
-
3. Application
- 3.1. Drug Development
- 3.2. Regenerative Medicine
- 3.3. Cell Therapy
- 3.4. Stem Cell Research
-
4. End User
- 4.1. Pharmaceutical Companies
- 4.2. Biopharmaceutical Companies,
- 4.3. CDMOs/CMOs
- 4.4. Hospitals
- 4.5. Other End Users
Automated Cell Shaker Market Segmentation By Geography
-
1. North America
- 1.1. United States
- 1.2. Canada
- 1.3. Mexico
-
2. Europe
- 2.1. Germany
- 2.2. United Kingdom
- 2.3. France
- 2.4. Italy
- 2.5. Spain
- 2.6. Rest of Europe
-
3. Asia Pacific
- 3.1. China
- 3.2. Japan
- 3.3. India
- 3.4. Australia
- 3.5. South Korea
- 3.6. Rest of Asia Pacific
-
4. Middle East and Africa
- 4.1. GCC
- 4.2. South Africa
- 4.3. Rest of Middle East and Africa
-
5. South America
- 5.1. Brazil
- 5.2. Argentina
- 5.3. Rest of South America
Automated Cell Shaker Market REPORT HIGHLIGHTS
| Aspects | Details |
|---|---|
| Study Period | 2019-2033 |
| Base Year | 2024 |
| Estimated Year | 2025 |
| Forecast Period | 2025-2033 |
| Historical Period | 2019-2024 |
| Growth Rate | CAGR of 4.00% from 2019-2033 |
| Segmentation |
|
Table of Contents
- 1. Introduction
- 1.1. Research Scope
- 1.2. Market Segmentation
- 1.3. Research Methodology
- 1.4. Definitions and Assumptions
- 2. Executive Summary
- 2.1. Introduction
- 3. Market Dynamics
- 3.1. Introduction
- 3.2. Market Drivers
- 3.2.1. The Growing Demand for Cell Culture; Rising Research in Fields like Life Sciences and Biotechnology
- 3.3. Market Restrains
- 3.3.1. The Growing Demand for Cell Culture; Rising Research in Fields like Life Sciences and Biotechnology
- 3.4. Market Trends
- 3.4.1. The Orbital Shakers Segment is Expected to Witness Significant Growth During the Forecast Period
- 4. Market Factor Analysis
- 4.1. Porters Five Forces
- 4.2. Supply/Value Chain
- 4.3. PESTEL analysis
- 4.4. Market Entropy
- 4.5. Patent/Trademark Analysis
- 5. Global Automated Cell Shaker Market Analysis, Insights and Forecast, 2019-2031
- 5.1. Market Analysis, Insights and Forecast - by Product
- 5.1.1. Automated Cell Shakers
- 5.1.2. Orbital Shakers
- 5.1.3. Ambient Shakers
- 5.1.4. Benchtop Incubator Shakers
- 5.1.5. Cell Shaker with Rotatory Arms
- 5.1.6. Accessories
- 5.2. Market Analysis, Insights and Forecast - by Cell Culture Type
- 5.2.1. Infinite Cell Line Cultures
- 5.2.2. Finite Cell Line Cultures
- 5.3. Market Analysis, Insights and Forecast - by Application
- 5.3.1. Drug Development
- 5.3.2. Regenerative Medicine
- 5.3.3. Cell Therapy
- 5.3.4. Stem Cell Research
- 5.4. Market Analysis, Insights and Forecast - by End User
- 5.4.1. Pharmaceutical Companies
- 5.4.2. Biopharmaceutical Companies,
- 5.4.3. CDMOs/CMOs
- 5.4.4. Hospitals
- 5.4.5. Other End Users
- 5.5. Market Analysis, Insights and Forecast - by Region
- 5.5.1. North America
- 5.5.2. Europe
- 5.5.3. Asia Pacific
- 5.5.4. Middle East and Africa
- 5.5.5. South America
- 5.1. Market Analysis, Insights and Forecast - by Product
- 6. North America Automated Cell Shaker Market Analysis, Insights and Forecast, 2019-2031
- 6.1. Market Analysis, Insights and Forecast - by Product
- 6.1.1. Automated Cell Shakers
- 6.1.2. Orbital Shakers
- 6.1.3. Ambient Shakers
- 6.1.4. Benchtop Incubator Shakers
- 6.1.5. Cell Shaker with Rotatory Arms
- 6.1.6. Accessories
- 6.2. Market Analysis, Insights and Forecast - by Cell Culture Type
- 6.2.1. Infinite Cell Line Cultures
- 6.2.2. Finite Cell Line Cultures
- 6.3. Market Analysis, Insights and Forecast - by Application
- 6.3.1. Drug Development
- 6.3.2. Regenerative Medicine
- 6.3.3. Cell Therapy
- 6.3.4. Stem Cell Research
- 6.4. Market Analysis, Insights and Forecast - by End User
- 6.4.1. Pharmaceutical Companies
- 6.4.2. Biopharmaceutical Companies,
- 6.4.3. CDMOs/CMOs
- 6.4.4. Hospitals
- 6.4.5. Other End Users
- 6.1. Market Analysis, Insights and Forecast - by Product
- 7. Europe Automated Cell Shaker Market Analysis, Insights and Forecast, 2019-2031
- 7.1. Market Analysis, Insights and Forecast - by Product
- 7.1.1. Automated Cell Shakers
- 7.1.2. Orbital Shakers
- 7.1.3. Ambient Shakers
- 7.1.4. Benchtop Incubator Shakers
- 7.1.5. Cell Shaker with Rotatory Arms
- 7.1.6. Accessories
- 7.2. Market Analysis, Insights and Forecast - by Cell Culture Type
- 7.2.1. Infinite Cell Line Cultures
- 7.2.2. Finite Cell Line Cultures
- 7.3. Market Analysis, Insights and Forecast - by Application
- 7.3.1. Drug Development
- 7.3.2. Regenerative Medicine
- 7.3.3. Cell Therapy
- 7.3.4. Stem Cell Research
- 7.4. Market Analysis, Insights and Forecast - by End User
- 7.4.1. Pharmaceutical Companies
- 7.4.2. Biopharmaceutical Companies,
- 7.4.3. CDMOs/CMOs
- 7.4.4. Hospitals
- 7.4.5. Other End Users
- 7.1. Market Analysis, Insights and Forecast - by Product
- 8. Asia Pacific Automated Cell Shaker Market Analysis, Insights and Forecast, 2019-2031
- 8.1. Market Analysis, Insights and Forecast - by Product
- 8.1.1. Automated Cell Shakers
- 8.1.2. Orbital Shakers
- 8.1.3. Ambient Shakers
- 8.1.4. Benchtop Incubator Shakers
- 8.1.5. Cell Shaker with Rotatory Arms
- 8.1.6. Accessories
- 8.2. Market Analysis, Insights and Forecast - by Cell Culture Type
- 8.2.1. Infinite Cell Line Cultures
- 8.2.2. Finite Cell Line Cultures
- 8.3. Market Analysis, Insights and Forecast - by Application
- 8.3.1. Drug Development
- 8.3.2. Regenerative Medicine
- 8.3.3. Cell Therapy
- 8.3.4. Stem Cell Research
- 8.4. Market Analysis, Insights and Forecast - by End User
- 8.4.1. Pharmaceutical Companies
- 8.4.2. Biopharmaceutical Companies,
- 8.4.3. CDMOs/CMOs
- 8.4.4. Hospitals
- 8.4.5. Other End Users
- 8.1. Market Analysis, Insights and Forecast - by Product
- 9. Middle East and Africa Automated Cell Shaker Market Analysis, Insights and Forecast, 2019-2031
- 9.1. Market Analysis, Insights and Forecast - by Product
- 9.1.1. Automated Cell Shakers
- 9.1.2. Orbital Shakers
- 9.1.3. Ambient Shakers
- 9.1.4. Benchtop Incubator Shakers
- 9.1.5. Cell Shaker with Rotatory Arms
- 9.1.6. Accessories
- 9.2. Market Analysis, Insights and Forecast - by Cell Culture Type
- 9.2.1. Infinite Cell Line Cultures
- 9.2.2. Finite Cell Line Cultures
- 9.3. Market Analysis, Insights and Forecast - by Application
- 9.3.1. Drug Development
- 9.3.2. Regenerative Medicine
- 9.3.3. Cell Therapy
- 9.3.4. Stem Cell Research
- 9.4. Market Analysis, Insights and Forecast - by End User
- 9.4.1. Pharmaceutical Companies
- 9.4.2. Biopharmaceutical Companies,
- 9.4.3. CDMOs/CMOs
- 9.4.4. Hospitals
- 9.4.5. Other End Users
- 9.1. Market Analysis, Insights and Forecast - by Product
- 10. South America Automated Cell Shaker Market Analysis, Insights and Forecast, 2019-2031
- 10.1. Market Analysis, Insights and Forecast - by Product
- 10.1.1. Automated Cell Shakers
- 10.1.2. Orbital Shakers
- 10.1.3. Ambient Shakers
- 10.1.4. Benchtop Incubator Shakers
- 10.1.5. Cell Shaker with Rotatory Arms
- 10.1.6. Accessories
- 10.2. Market Analysis, Insights and Forecast - by Cell Culture Type
- 10.2.1. Infinite Cell Line Cultures
- 10.2.2. Finite Cell Line Cultures
- 10.3. Market Analysis, Insights and Forecast - by Application
- 10.3.1. Drug Development
- 10.3.2. Regenerative Medicine
- 10.3.3. Cell Therapy
- 10.3.4. Stem Cell Research
- 10.4. Market Analysis, Insights and Forecast - by End User
- 10.4.1. Pharmaceutical Companies
- 10.4.2. Biopharmaceutical Companies,
- 10.4.3. CDMOs/CMOs
- 10.4.4. Hospitals
- 10.4.5. Other End Users
- 10.1. Market Analysis, Insights and Forecast - by Product
- 11. Competitive Analysis
- 11.1. Global Market Share Analysis 2024
- 11.2. Company Profiles
- 11.2.1 Thermo Fisher scientific Inc
- 11.2.1.1. Overview
- 11.2.1.2. Products
- 11.2.1.3. SWOT Analysis
- 11.2.1.4. Recent Developments
- 11.2.1.5. Financials (Based on Availability)
- 11.2.2 Eppendorf SE
- 11.2.2.1. Overview
- 11.2.2.2. Products
- 11.2.2.3. SWOT Analysis
- 11.2.2.4. Recent Developments
- 11.2.2.5. Financials (Based on Availability)
- 11.2.3 Corning Incorporated
- 11.2.3.1. Overview
- 11.2.3.2. Products
- 11.2.3.3. SWOT Analysis
- 11.2.3.4. Recent Developments
- 11.2.3.5. Financials (Based on Availability)
- 11.2.4 Boekel Scientific
- 11.2.4.1. Overview
- 11.2.4.2. Products
- 11.2.4.3. SWOT Analysis
- 11.2.4.4. Recent Developments
- 11.2.4.5. Financials (Based on Availability)
- 11.2.5 Kuhner Shaker
- 11.2.5.1. Overview
- 11.2.5.2. Products
- 11.2.5.3. SWOT Analysis
- 11.2.5.4. Recent Developments
- 11.2.5.5. Financials (Based on Availability)
- 11.2.6 Heidolph
- 11.2.6.1. Overview
- 11.2.6.2. Products
- 11.2.6.3. SWOT Analysis
- 11.2.6.4. Recent Developments
- 11.2.6.5. Financials (Based on Availability)
- 11.2.7 VELP Scientifica
- 11.2.7.1. Overview
- 11.2.7.2. Products
- 11.2.7.3. SWOT Analysis
- 11.2.7.4. Recent Developments
- 11.2.7.5. Financials (Based on Availability)
- 11.2.8 Grant Instruments
- 11.2.8.1. Overview
- 11.2.8.2. Products
- 11.2.8.3. SWOT Analysis
- 11.2.8.4. Recent Developments
- 11.2.8.5. Financials (Based on Availability)
- 11.2.9 OHAUS Corporation
- 11.2.9.1. Overview
- 11.2.9.2. Products
- 11.2.9.3. SWOT Analysis
- 11.2.9.4. Recent Developments
- 11.2.9.5. Financials (Based on Availability)
- 11.2.10 Labnet International
- 11.2.10.1. Overview
- 11.2.10.2. Products
- 11.2.10.3. SWOT Analysis
- 11.2.10.4. Recent Developments
- 11.2.10.5. Financials (Based on Availability)
- 11.2.11 VWR International
- 11.2.11.1. Overview
- 11.2.11.2. Products
- 11.2.11.3. SWOT Analysis
- 11.2.11.4. Recent Developments
- 11.2.11.5. Financials (Based on Availability)
- 11.2.12 Sartorius AG*List Not Exhaustive
- 11.2.12.1. Overview
- 11.2.12.2. Products
- 11.2.12.3. SWOT Analysis
- 11.2.12.4. Recent Developments
- 11.2.12.5. Financials (Based on Availability)
- 11.2.1 Thermo Fisher scientific Inc
List of Figures
- Figure 1: Global Automated Cell Shaker Market Revenue Breakdown (Million, %) by Region 2024 & 2032
- Figure 2: Global Automated Cell Shaker Market Volume Breakdown (Million, %) by Region 2024 & 2032
- Figure 3: North America Automated Cell Shaker Market Revenue (Million), by Product 2024 & 2032
- Figure 4: North America Automated Cell Shaker Market Volume (Million), by Product 2024 & 2032
- Figure 5: North America Automated Cell Shaker Market Revenue Share (%), by Product 2024 & 2032
- Figure 6: North America Automated Cell Shaker Market Volume Share (%), by Product 2024 & 2032
- Figure 7: North America Automated Cell Shaker Market Revenue (Million), by Cell Culture Type 2024 & 2032
- Figure 8: North America Automated Cell Shaker Market Volume (Million), by Cell Culture Type 2024 & 2032
- Figure 9: North America Automated Cell Shaker Market Revenue Share (%), by Cell Culture Type 2024 & 2032
- Figure 10: North America Automated Cell Shaker Market Volume Share (%), by Cell Culture Type 2024 & 2032
- Figure 11: North America Automated Cell Shaker Market Revenue (Million), by Application 2024 & 2032
- Figure 12: North America Automated Cell Shaker Market Volume (Million), by Application 2024 & 2032
- Figure 13: North America Automated Cell Shaker Market Revenue Share (%), by Application 2024 & 2032
- Figure 14: North America Automated Cell Shaker Market Volume Share (%), by Application 2024 & 2032
- Figure 15: North America Automated Cell Shaker Market Revenue (Million), by End User 2024 & 2032
- Figure 16: North America Automated Cell Shaker Market Volume (Million), by End User 2024 & 2032
- Figure 17: North America Automated Cell Shaker Market Revenue Share (%), by End User 2024 & 2032
- Figure 18: North America Automated Cell Shaker Market Volume Share (%), by End User 2024 & 2032
- Figure 19: North America Automated Cell Shaker Market Revenue (Million), by Country 2024 & 2032
- Figure 20: North America Automated Cell Shaker Market Volume (Million), by Country 2024 & 2032
- Figure 21: North America Automated Cell Shaker Market Revenue Share (%), by Country 2024 & 2032
- Figure 22: North America Automated Cell Shaker Market Volume Share (%), by Country 2024 & 2032
- Figure 23: Europe Automated Cell Shaker Market Revenue (Million), by Product 2024 & 2032
- Figure 24: Europe Automated Cell Shaker Market Volume (Million), by Product 2024 & 2032
- Figure 25: Europe Automated Cell Shaker Market Revenue Share (%), by Product 2024 & 2032
- Figure 26: Europe Automated Cell Shaker Market Volume Share (%), by Product 2024 & 2032
- Figure 27: Europe Automated Cell Shaker Market Revenue (Million), by Cell Culture Type 2024 & 2032
- Figure 28: Europe Automated Cell Shaker Market Volume (Million), by Cell Culture Type 2024 & 2032
- Figure 29: Europe Automated Cell Shaker Market Revenue Share (%), by Cell Culture Type 2024 & 2032
- Figure 30: Europe Automated Cell Shaker Market Volume Share (%), by Cell Culture Type 2024 & 2032
- Figure 31: Europe Automated Cell Shaker Market Revenue (Million), by Application 2024 & 2032
- Figure 32: Europe Automated Cell Shaker Market Volume (Million), by Application 2024 & 2032
- Figure 33: Europe Automated Cell Shaker Market Revenue Share (%), by Application 2024 & 2032
- Figure 34: Europe Automated Cell Shaker Market Volume Share (%), by Application 2024 & 2032
- Figure 35: Europe Automated Cell Shaker Market Revenue (Million), by End User 2024 & 2032
- Figure 36: Europe Automated Cell Shaker Market Volume (Million), by End User 2024 & 2032
- Figure 37: Europe Automated Cell Shaker Market Revenue Share (%), by End User 2024 & 2032
- Figure 38: Europe Automated Cell Shaker Market Volume Share (%), by End User 2024 & 2032
- Figure 39: Europe Automated Cell Shaker Market Revenue (Million), by Country 2024 & 2032
- Figure 40: Europe Automated Cell Shaker Market Volume (Million), by Country 2024 & 2032
- Figure 41: Europe Automated Cell Shaker Market Revenue Share (%), by Country 2024 & 2032
- Figure 42: Europe Automated Cell Shaker Market Volume Share (%), by Country 2024 & 2032
- Figure 43: Asia Pacific Automated Cell Shaker Market Revenue (Million), by Product 2024 & 2032
- Figure 44: Asia Pacific Automated Cell Shaker Market Volume (Million), by Product 2024 & 2032
- Figure 45: Asia Pacific Automated Cell Shaker Market Revenue Share (%), by Product 2024 & 2032
- Figure 46: Asia Pacific Automated Cell Shaker Market Volume Share (%), by Product 2024 & 2032
- Figure 47: Asia Pacific Automated Cell Shaker Market Revenue (Million), by Cell Culture Type 2024 & 2032
- Figure 48: Asia Pacific Automated Cell Shaker Market Volume (Million), by Cell Culture Type 2024 & 2032
- Figure 49: Asia Pacific Automated Cell Shaker Market Revenue Share (%), by Cell Culture Type 2024 & 2032
- Figure 50: Asia Pacific Automated Cell Shaker Market Volume Share (%), by Cell Culture Type 2024 & 2032
- Figure 51: Asia Pacific Automated Cell Shaker Market Revenue (Million), by Application 2024 & 2032
- Figure 52: Asia Pacific Automated Cell Shaker Market Volume (Million), by Application 2024 & 2032
- Figure 53: Asia Pacific Automated Cell Shaker Market Revenue Share (%), by Application 2024 & 2032
- Figure 54: Asia Pacific Automated Cell Shaker Market Volume Share (%), by Application 2024 & 2032
- Figure 55: Asia Pacific Automated Cell Shaker Market Revenue (Million), by End User 2024 & 2032
- Figure 56: Asia Pacific Automated Cell Shaker Market Volume (Million), by End User 2024 & 2032
- Figure 57: Asia Pacific Automated Cell Shaker Market Revenue Share (%), by End User 2024 & 2032
- Figure 58: Asia Pacific Automated Cell Shaker Market Volume Share (%), by End User 2024 & 2032
- Figure 59: Asia Pacific Automated Cell Shaker Market Revenue (Million), by Country 2024 & 2032
- Figure 60: Asia Pacific Automated Cell Shaker Market Volume (Million), by Country 2024 & 2032
- Figure 61: Asia Pacific Automated Cell Shaker Market Revenue Share (%), by Country 2024 & 2032
- Figure 62: Asia Pacific Automated Cell Shaker Market Volume Share (%), by Country 2024 & 2032
- Figure 63: Middle East and Africa Automated Cell Shaker Market Revenue (Million), by Product 2024 & 2032
- Figure 64: Middle East and Africa Automated Cell Shaker Market Volume (Million), by Product 2024 & 2032
- Figure 65: Middle East and Africa Automated Cell Shaker Market Revenue Share (%), by Product 2024 & 2032
- Figure 66: Middle East and Africa Automated Cell Shaker Market Volume Share (%), by Product 2024 & 2032
- Figure 67: Middle East and Africa Automated Cell Shaker Market Revenue (Million), by Cell Culture Type 2024 & 2032
- Figure 68: Middle East and Africa Automated Cell Shaker Market Volume (Million), by Cell Culture Type 2024 & 2032
- Figure 69: Middle East and Africa Automated Cell Shaker Market Revenue Share (%), by Cell Culture Type 2024 & 2032
- Figure 70: Middle East and Africa Automated Cell Shaker Market Volume Share (%), by Cell Culture Type 2024 & 2032
- Figure 71: Middle East and Africa Automated Cell Shaker Market Revenue (Million), by Application 2024 & 2032
- Figure 72: Middle East and Africa Automated Cell Shaker Market Volume (Million), by Application 2024 & 2032
- Figure 73: Middle East and Africa Automated Cell Shaker Market Revenue Share (%), by Application 2024 & 2032
- Figure 74: Middle East and Africa Automated Cell Shaker Market Volume Share (%), by Application 2024 & 2032
- Figure 75: Middle East and Africa Automated Cell Shaker Market Revenue (Million), by End User 2024 & 2032
- Figure 76: Middle East and Africa Automated Cell Shaker Market Volume (Million), by End User 2024 & 2032
- Figure 77: Middle East and Africa Automated Cell Shaker Market Revenue Share (%), by End User 2024 & 2032
- Figure 78: Middle East and Africa Automated Cell Shaker Market Volume Share (%), by End User 2024 & 2032
- Figure 79: Middle East and Africa Automated Cell Shaker Market Revenue (Million), by Country 2024 & 2032
- Figure 80: Middle East and Africa Automated Cell Shaker Market Volume (Million), by Country 2024 & 2032
- Figure 81: Middle East and Africa Automated Cell Shaker Market Revenue Share (%), by Country 2024 & 2032
- Figure 82: Middle East and Africa Automated Cell Shaker Market Volume Share (%), by Country 2024 & 2032
- Figure 83: South America Automated Cell Shaker Market Revenue (Million), by Product 2024 & 2032
- Figure 84: South America Automated Cell Shaker Market Volume (Million), by Product 2024 & 2032
- Figure 85: South America Automated Cell Shaker Market Revenue Share (%), by Product 2024 & 2032
- Figure 86: South America Automated Cell Shaker Market Volume Share (%), by Product 2024 & 2032
- Figure 87: South America Automated Cell Shaker Market Revenue (Million), by Cell Culture Type 2024 & 2032
- Figure 88: South America Automated Cell Shaker Market Volume (Million), by Cell Culture Type 2024 & 2032
- Figure 89: South America Automated Cell Shaker Market Revenue Share (%), by Cell Culture Type 2024 & 2032
- Figure 90: South America Automated Cell Shaker Market Volume Share (%), by Cell Culture Type 2024 & 2032
- Figure 91: South America Automated Cell Shaker Market Revenue (Million), by Application 2024 & 2032
- Figure 92: South America Automated Cell Shaker Market Volume (Million), by Application 2024 & 2032
- Figure 93: South America Automated Cell Shaker Market Revenue Share (%), by Application 2024 & 2032
- Figure 94: South America Automated Cell Shaker Market Volume Share (%), by Application 2024 & 2032
- Figure 95: South America Automated Cell Shaker Market Revenue (Million), by End User 2024 & 2032
- Figure 96: South America Automated Cell Shaker Market Volume (Million), by End User 2024 & 2032
- Figure 97: South America Automated Cell Shaker Market Revenue Share (%), by End User 2024 & 2032
- Figure 98: South America Automated Cell Shaker Market Volume Share (%), by End User 2024 & 2032
- Figure 99: South America Automated Cell Shaker Market Revenue (Million), by Country 2024 & 2032
- Figure 100: South America Automated Cell Shaker Market Volume (Million), by Country 2024 & 2032
- Figure 101: South America Automated Cell Shaker Market Revenue Share (%), by Country 2024 & 2032
- Figure 102: South America Automated Cell Shaker Market Volume Share (%), by Country 2024 & 2032
List of Tables
- Table 1: Global Automated Cell Shaker Market Revenue Million Forecast, by Region 2019 & 2032
- Table 2: Global Automated Cell Shaker Market Volume Million Forecast, by Region 2019 & 2032
- Table 3: Global Automated Cell Shaker Market Revenue Million Forecast, by Product 2019 & 2032
- Table 4: Global Automated Cell Shaker Market Volume Million Forecast, by Product 2019 & 2032
- Table 5: Global Automated Cell Shaker Market Revenue Million Forecast, by Cell Culture Type 2019 & 2032
- Table 6: Global Automated Cell Shaker Market Volume Million Forecast, by Cell Culture Type 2019 & 2032
- Table 7: Global Automated Cell Shaker Market Revenue Million Forecast, by Application 2019 & 2032
- Table 8: Global Automated Cell Shaker Market Volume Million Forecast, by Application 2019 & 2032
- Table 9: Global Automated Cell Shaker Market Revenue Million Forecast, by End User 2019 & 2032
- Table 10: Global Automated Cell Shaker Market Volume Million Forecast, by End User 2019 & 2032
- Table 11: Global Automated Cell Shaker Market Revenue Million Forecast, by Region 2019 & 2032
- Table 12: Global Automated Cell Shaker Market Volume Million Forecast, by Region 2019 & 2032
- Table 13: Global Automated Cell Shaker Market Revenue Million Forecast, by Product 2019 & 2032
- Table 14: Global Automated Cell Shaker Market Volume Million Forecast, by Product 2019 & 2032
- Table 15: Global Automated Cell Shaker Market Revenue Million Forecast, by Cell Culture Type 2019 & 2032
- Table 16: Global Automated Cell Shaker Market Volume Million Forecast, by Cell Culture Type 2019 & 2032
- Table 17: Global Automated Cell Shaker Market Revenue Million Forecast, by Application 2019 & 2032
- Table 18: Global Automated Cell Shaker Market Volume Million Forecast, by Application 2019 & 2032
- Table 19: Global Automated Cell Shaker Market Revenue Million Forecast, by End User 2019 & 2032
- Table 20: Global Automated Cell Shaker Market Volume Million Forecast, by End User 2019 & 2032
- Table 21: Global Automated Cell Shaker Market Revenue Million Forecast, by Country 2019 & 2032
- Table 22: Global Automated Cell Shaker Market Volume Million Forecast, by Country 2019 & 2032
- Table 23: United States Automated Cell Shaker Market Revenue (Million) Forecast, by Application 2019 & 2032
- Table 24: United States Automated Cell Shaker Market Volume (Million) Forecast, by Application 2019 & 2032
- Table 25: Canada Automated Cell Shaker Market Revenue (Million) Forecast, by Application 2019 & 2032
- Table 26: Canada Automated Cell Shaker Market Volume (Million) Forecast, by Application 2019 & 2032
- Table 27: Mexico Automated Cell Shaker Market Revenue (Million) Forecast, by Application 2019 & 2032
- Table 28: Mexico Automated Cell Shaker Market Volume (Million) Forecast, by Application 2019 & 2032
- Table 29: Global Automated Cell Shaker Market Revenue Million Forecast, by Product 2019 & 2032
- Table 30: Global Automated Cell Shaker Market Volume Million Forecast, by Product 2019 & 2032
- Table 31: Global Automated Cell Shaker Market Revenue Million Forecast, by Cell Culture Type 2019 & 2032
- Table 32: Global Automated Cell Shaker Market Volume Million Forecast, by Cell Culture Type 2019 & 2032
- Table 33: Global Automated Cell Shaker Market Revenue Million Forecast, by Application 2019 & 2032
- Table 34: Global Automated Cell Shaker Market Volume Million Forecast, by Application 2019 & 2032
- Table 35: Global Automated Cell Shaker Market Revenue Million Forecast, by End User 2019 & 2032
- Table 36: Global Automated Cell Shaker Market Volume Million Forecast, by End User 2019 & 2032
- Table 37: Global Automated Cell Shaker Market Revenue Million Forecast, by Country 2019 & 2032
- Table 38: Global Automated Cell Shaker Market Volume Million Forecast, by Country 2019 & 2032
- Table 39: Germany Automated Cell Shaker Market Revenue (Million) Forecast, by Application 2019 & 2032
- Table 40: Germany Automated Cell Shaker Market Volume (Million) Forecast, by Application 2019 & 2032
- Table 41: United Kingdom Automated Cell Shaker Market Revenue (Million) Forecast, by Application 2019 & 2032
- Table 42: United Kingdom Automated Cell Shaker Market Volume (Million) Forecast, by Application 2019 & 2032
- Table 43: France Automated Cell Shaker Market Revenue (Million) Forecast, by Application 2019 & 2032
- Table 44: France Automated Cell Shaker Market Volume (Million) Forecast, by Application 2019 & 2032
- Table 45: Italy Automated Cell Shaker Market Revenue (Million) Forecast, by Application 2019 & 2032
- Table 46: Italy Automated Cell Shaker Market Volume (Million) Forecast, by Application 2019 & 2032
- Table 47: Spain Automated Cell Shaker Market Revenue (Million) Forecast, by Application 2019 & 2032
- Table 48: Spain Automated Cell Shaker Market Volume (Million) Forecast, by Application 2019 & 2032
- Table 49: Rest of Europe Automated Cell Shaker Market Revenue (Million) Forecast, by Application 2019 & 2032
- Table 50: Rest of Europe Automated Cell Shaker Market Volume (Million) Forecast, by Application 2019 & 2032
- Table 51: Global Automated Cell Shaker Market Revenue Million Forecast, by Product 2019 & 2032
- Table 52: Global Automated Cell Shaker Market Volume Million Forecast, by Product 2019 & 2032
- Table 53: Global Automated Cell Shaker Market Revenue Million Forecast, by Cell Culture Type 2019 & 2032
- Table 54: Global Automated Cell Shaker Market Volume Million Forecast, by Cell Culture Type 2019 & 2032
- Table 55: Global Automated Cell Shaker Market Revenue Million Forecast, by Application 2019 & 2032
- Table 56: Global Automated Cell Shaker Market Volume Million Forecast, by Application 2019 & 2032
- Table 57: Global Automated Cell Shaker Market Revenue Million Forecast, by End User 2019 & 2032
- Table 58: Global Automated Cell Shaker Market Volume Million Forecast, by End User 2019 & 2032
- Table 59: Global Automated Cell Shaker Market Revenue Million Forecast, by Country 2019 & 2032
- Table 60: Global Automated Cell Shaker Market Volume Million Forecast, by Country 2019 & 2032
- Table 61: China Automated Cell Shaker Market Revenue (Million) Forecast, by Application 2019 & 2032
- Table 62: China Automated Cell Shaker Market Volume (Million) Forecast, by Application 2019 & 2032
- Table 63: Japan Automated Cell Shaker Market Revenue (Million) Forecast, by Application 2019 & 2032
- Table 64: Japan Automated Cell Shaker Market Volume (Million) Forecast, by Application 2019 & 2032
- Table 65: India Automated Cell Shaker Market Revenue (Million) Forecast, by Application 2019 & 2032
- Table 66: India Automated Cell Shaker Market Volume (Million) Forecast, by Application 2019 & 2032
- Table 67: Australia Automated Cell Shaker Market Revenue (Million) Forecast, by Application 2019 & 2032
- Table 68: Australia Automated Cell Shaker Market Volume (Million) Forecast, by Application 2019 & 2032
- Table 69: South Korea Automated Cell Shaker Market Revenue (Million) Forecast, by Application 2019 & 2032
- Table 70: South Korea Automated Cell Shaker Market Volume (Million) Forecast, by Application 2019 & 2032
- Table 71: Rest of Asia Pacific Automated Cell Shaker Market Revenue (Million) Forecast, by Application 2019 & 2032
- Table 72: Rest of Asia Pacific Automated Cell Shaker Market Volume (Million) Forecast, by Application 2019 & 2032
- Table 73: Global Automated Cell Shaker Market Revenue Million Forecast, by Product 2019 & 2032
- Table 74: Global Automated Cell Shaker Market Volume Million Forecast, by Product 2019 & 2032
- Table 75: Global Automated Cell Shaker Market Revenue Million Forecast, by Cell Culture Type 2019 & 2032
- Table 76: Global Automated Cell Shaker Market Volume Million Forecast, by Cell Culture Type 2019 & 2032
- Table 77: Global Automated Cell Shaker Market Revenue Million Forecast, by Application 2019 & 2032
- Table 78: Global Automated Cell Shaker Market Volume Million Forecast, by Application 2019 & 2032
- Table 79: Global Automated Cell Shaker Market Revenue Million Forecast, by End User 2019 & 2032
- Table 80: Global Automated Cell Shaker Market Volume Million Forecast, by End User 2019 & 2032
- Table 81: Global Automated Cell Shaker Market Revenue Million Forecast, by Country 2019 & 2032
- Table 82: Global Automated Cell Shaker Market Volume Million Forecast, by Country 2019 & 2032
- Table 83: GCC Automated Cell Shaker Market Revenue (Million) Forecast, by Application 2019 & 2032
- Table 84: GCC Automated Cell Shaker Market Volume (Million) Forecast, by Application 2019 & 2032
- Table 85: South Africa Automated Cell Shaker Market Revenue (Million) Forecast, by Application 2019 & 2032
- Table 86: South Africa Automated Cell Shaker Market Volume (Million) Forecast, by Application 2019 & 2032
- Table 87: Rest of Middle East and Africa Automated Cell Shaker Market Revenue (Million) Forecast, by Application 2019 & 2032
- Table 88: Rest of Middle East and Africa Automated Cell Shaker Market Volume (Million) Forecast, by Application 2019 & 2032
- Table 89: Global Automated Cell Shaker Market Revenue Million Forecast, by Product 2019 & 2032
- Table 90: Global Automated Cell Shaker Market Volume Million Forecast, by Product 2019 & 2032
- Table 91: Global Automated Cell Shaker Market Revenue Million Forecast, by Cell Culture Type 2019 & 2032
- Table 92: Global Automated Cell Shaker Market Volume Million Forecast, by Cell Culture Type 2019 & 2032
- Table 93: Global Automated Cell Shaker Market Revenue Million Forecast, by Application 2019 & 2032
- Table 94: Global Automated Cell Shaker Market Volume Million Forecast, by Application 2019 & 2032
- Table 95: Global Automated Cell Shaker Market Revenue Million Forecast, by End User 2019 & 2032
- Table 96: Global Automated Cell Shaker Market Volume Million Forecast, by End User 2019 & 2032
- Table 97: Global Automated Cell Shaker Market Revenue Million Forecast, by Country 2019 & 2032
- Table 98: Global Automated Cell Shaker Market Volume Million Forecast, by Country 2019 & 2032
- Table 99: Brazil Automated Cell Shaker Market Revenue (Million) Forecast, by Application 2019 & 2032
- Table 100: Brazil Automated Cell Shaker Market Volume (Million) Forecast, by Application 2019 & 2032
- Table 101: Argentina Automated Cell Shaker Market Revenue (Million) Forecast, by Application 2019 & 2032
- Table 102: Argentina Automated Cell Shaker Market Volume (Million) Forecast, by Application 2019 & 2032
- Table 103: Rest of South America Automated Cell Shaker Market Revenue (Million) Forecast, by Application 2019 & 2032
- Table 104: Rest of South America Automated Cell Shaker Market Volume (Million) Forecast, by Application 2019 & 2032
Frequently Asked Questions
1. What is the projected Compound Annual Growth Rate (CAGR) of the Automated Cell Shaker Market?
The projected CAGR is approximately 4.00%.
2. Which companies are prominent players in the Automated Cell Shaker Market?
Key companies in the market include Thermo Fisher scientific Inc, Eppendorf SE, Corning Incorporated, Boekel Scientific, Kuhner Shaker, Heidolph, VELP Scientifica, Grant Instruments, OHAUS Corporation, Labnet International, VWR International, Sartorius AG*List Not Exhaustive.
3. What are the main segments of the Automated Cell Shaker Market?
The market segments include Product, Cell Culture Type, Application, End User.
4. Can you provide details about the market size?
The market size is estimated to be USD 646.12 Million as of 2022.
5. What are some drivers contributing to market growth?
The Growing Demand for Cell Culture; Rising Research in Fields like Life Sciences and Biotechnology.
6. What are the notable trends driving market growth?
The Orbital Shakers Segment is Expected to Witness Significant Growth During the Forecast Period.
7. Are there any restraints impacting market growth?
The Growing Demand for Cell Culture; Rising Research in Fields like Life Sciences and Biotechnology.
8. Can you provide examples of recent developments in the market?
N/A
9. What pricing options are available for accessing the report?
Pricing options include single-user, multi-user, and enterprise licenses priced at USD 4750, USD 5250, and USD 8750 respectively.
10. Is the market size provided in terms of value or volume?
The market size is provided in terms of value, measured in Million and volume, measured in Million.
11. Are there any specific market keywords associated with the report?
Yes, the market keyword associated with the report is "Automated Cell Shaker Market," which aids in identifying and referencing the specific market segment covered.
12. How do I determine which pricing option suits my needs best?
The pricing options vary based on user requirements and access needs. Individual users may opt for single-user licenses, while businesses requiring broader access may choose multi-user or enterprise licenses for cost-effective access to the report.
13. Are there any additional resources or data provided in the Automated Cell Shaker Market report?
While the report offers comprehensive insights, it's advisable to review the specific contents or supplementary materials provided to ascertain if additional resources or data are available.
14. How can I stay updated on further developments or reports in the Automated Cell Shaker Market?
To stay informed about further developments, trends, and reports in the Automated Cell Shaker Market, consider subscribing to industry newsletters, following relevant companies and organizations, or regularly checking reputable industry news sources and publications.
Methodology
Step 1 - Identification of Relevant Samples Size from Population Database


Step 2 - Approaches for Defining Global Market Size (Value, Volume* & Price*)

Note*: In applicable scenarios
Step 3 - Data Sources
Primary Research
- Web Analytics
- Survey Reports
- Research Institute
- Latest Research Reports
- Opinion Leaders
Secondary Research
- Annual Reports
- White Paper
- Latest Press Release
- Industry Association
- Paid Database
- Investor Presentations

Step 4 - Data Triangulation
Involves using different sources of information in order to increase the validity of a study
These sources are likely to be stakeholders in a program - participants, other researchers, program staff, other community members, and so on.
Then we put all data in single framework & apply various statistical tools to find out the dynamic on the market.
During the analysis stage, feedback from the stakeholder groups would be compared to determine areas of agreement as well as areas of divergence


