

Key Insights
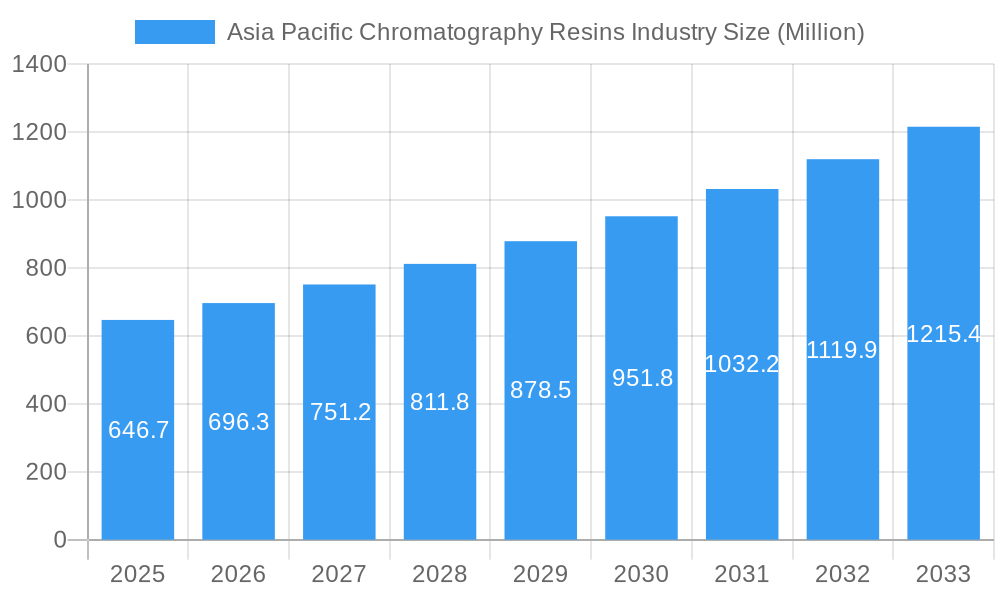
The Asia Pacific chromatography resins market, valued at $646.7 million in 2025, is poised for robust growth, exhibiting a Compound Annual Growth Rate (CAGR) exceeding 7% from 2025 to 2033. This expansion is fueled by several key factors. The burgeoning pharmaceutical industry within the region, particularly in countries like China, India, and Japan, is a significant driver, demanding high-purity compounds for drug production. Increased investments in research and development across the life sciences sector further bolster market growth. Furthermore, the rising prevalence of chronic diseases necessitates advanced diagnostic and therapeutic solutions, increasing the demand for sophisticated separation techniques relying on chromatography resins. The preference for natural-based resins, due to growing environmental concerns and the push for sustainable practices within the industry, is another significant trend impacting market segmentation. However, the market faces certain restraints, including the high cost of advanced chromatography resins and the potential regulatory hurdles associated with new product approvals. Competition among established players like General Electric, Bio-Rad Laboratories, Merck KGaA, and others, is intense, driving innovation and price competitiveness.
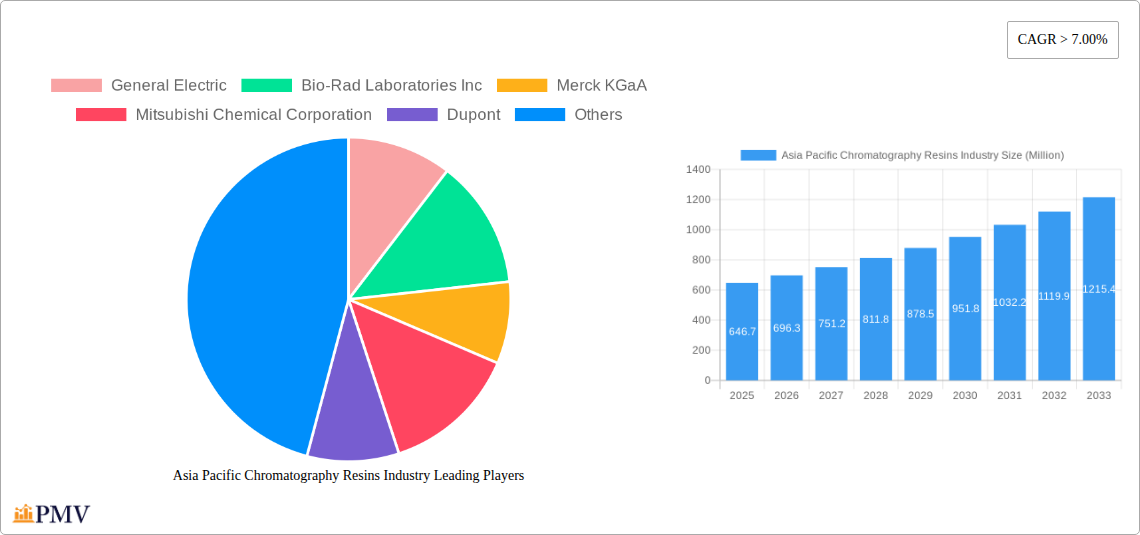
Asia Pacific Chromatography Resins Industry Market Size (In Million)
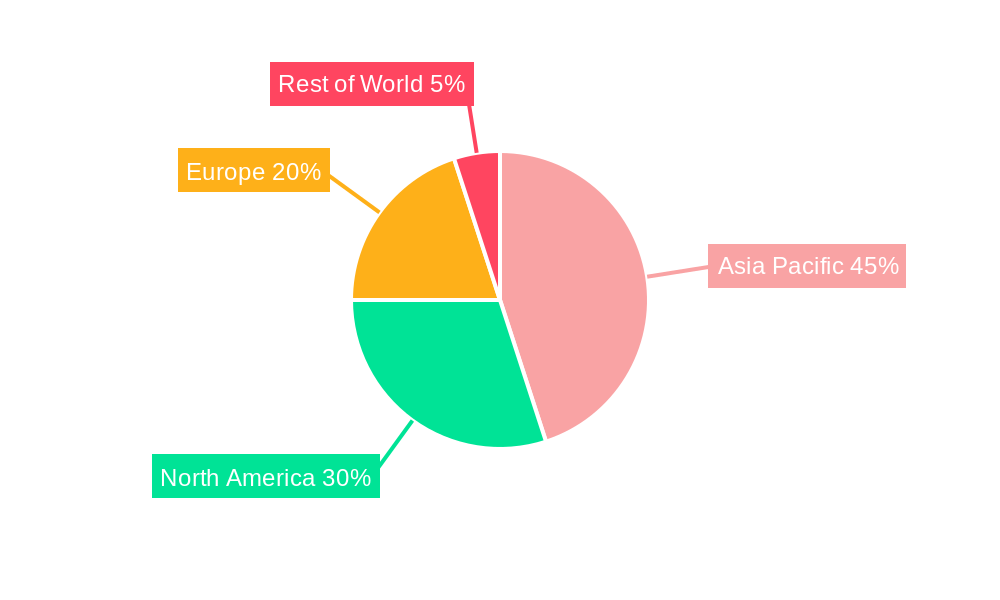
The market segmentation reveals a strong dependence on the pharmaceutical sector, followed by food and beverages, and other end-user industries. Within technology segments, Ion Exchange Chromatography resins currently dominate, but Affinity and Size Exclusion Chromatography resins are experiencing rapid growth due to their enhanced selectivity and efficiency. The Asia Pacific region's diverse economic landscape and varied regulatory environments presents both opportunities and challenges. While China and India represent large, rapidly expanding markets, variations in regulatory frameworks and infrastructure development across different countries within the region influence overall market dynamics. The consistent growth trajectory, however, indicates a strong future for chromatography resins in Asia Pacific, driven by continuous technological advancements and the increasing demand for high-quality products across diverse applications.
Asia Pacific Chromatography Resins Industry Company Market Share
Asia Pacific Chromatography Resins Industry: A Comprehensive Market Report (2019-2033)
This comprehensive report provides an in-depth analysis of the Asia Pacific chromatography resins market, offering valuable insights for industry stakeholders, investors, and researchers. The study covers the period from 2019 to 2033, with a focus on the forecast period of 2025-2033 and a base year of 2025. The report utilizes a robust methodology, combining primary and secondary research, to deliver accurate and reliable market estimations. It features detailed segmentations by technology, origin, end-user industry, and geography, providing a granular understanding of the market dynamics. The report also examines key industry players, their competitive strategies, and emerging trends shaping the future of the Asia Pacific chromatography resins market. The total market size in 2025 is estimated at xx Million and is projected to reach xx Million by 2033, registering a CAGR of xx% during the forecast period.
Asia Pacific Chromatography Resins Industry Market Structure & Competitive Dynamics
The Asia Pacific chromatography resins market exhibits a moderately concentrated structure, with several multinational corporations and regional players vying for market share. The market's competitive landscape is characterized by intense rivalry, driven by factors such as product innovation, pricing strategies, and strategic partnerships. Major players, including General Electric, Bio-Rad Laboratories Inc, Merck KGaA, Mitsubishi Chemical Corporation, Dupont, Pall Corporation, Tosoh Bioscience LLC, Purolite, Agilent Technologies, Avantor Inc, and Thermo Fisher Scientific, hold significant market share, often employing a mix of organic growth and acquisitions to expand their presence. Innovation ecosystems are vibrant, with ongoing research and development efforts focused on enhancing resin performance, expanding applications, and developing novel technologies. Regulatory frameworks, particularly those related to pharmaceutical manufacturing and environmental protection, play a crucial role in shaping market dynamics. Product substitutes, such as alternative separation techniques, pose a degree of competitive pressure. End-user trends, primarily driven by the growth of the pharmaceutical and biotechnology sectors, are a major influence on market demand. Mergers and acquisitions (M&A) activities are frequent, leading to market consolidation and reshaping the competitive landscape. In recent years, M&A deal values have ranged from xx Million to xx Million, reflecting the strategic importance of the chromatography resins market. The market share of the top five players is estimated to be around xx% in 2025.
Asia Pacific Chromatography Resins Industry Industry Trends & Insights
The Asia Pacific chromatography resins market is experiencing robust growth, driven by several key factors. The increasing demand for high-purity pharmaceuticals and biopharmaceuticals is a major growth driver, with stringent regulatory requirements mandating the use of advanced separation techniques. Technological advancements, such as the development of high-performance resins with improved selectivity and efficiency, are further fueling market expansion. The growing adoption of chromatography in various industries, including food and beverage testing, environmental monitoring, and industrial processing, is contributing to market growth. Consumer preference for high-quality products and enhanced safety standards is driving the demand for advanced separation technologies. Competitive dynamics are shaping the market, with leading players investing heavily in research and development, expanding their product portfolios, and strengthening their distribution networks. The market is witnessing a gradual shift toward synthetic-based resins due to their consistent quality and performance compared to natural-based alternatives. The projected CAGR for the market during the forecast period (2025-2033) is xx%, reflecting the sustained growth momentum expected in the region. Market penetration of advanced chromatography techniques, particularly in emerging economies, is steadily increasing, driven by rising investments in healthcare and infrastructure.
Dominant Markets & Segments in Asia Pacific Chromatography Resins Industry
Leading Region/Country: China dominates the Asia Pacific chromatography resins market, driven by its robust pharmaceutical industry, growing biopharmaceutical sector, and substantial investments in research and development. India is another key market with significant growth potential.
Dominant Segments:
- End-user Industry: The pharmaceutical industry is the largest end-user segment for chromatography resins in the Asia Pacific region. The sector’s stringent regulatory guidelines, focusing on the purity and quality of drugs, mandates the use of these resins, driving the segment's demand.
- Technology: Ion exchange chromatography resins hold the largest market share, owing to their versatile applications and cost-effectiveness. However, the demand for affinity chromatography resins is rapidly increasing due to their high specificity and efficiency in purifying biomolecules.
- Origin: Synthetic-based resins are the dominant segment, offering advantages in terms of consistency, reproducibility, and scalability compared to their natural counterparts.
- Other End-user Industries: Growth in water and environmental agencies’ demand for advanced purification solutions and rising food and beverage industry standards are expanding the market into these sectors. The “Other” end-user category showcases steady growth across multiple applications and industries.
Key Drivers:
- Economic Policies: Government initiatives promoting pharmaceutical manufacturing and biotechnology research & development in China and India.
- Infrastructure Development: Expansion of research facilities, advanced laboratories, and pharmaceutical manufacturing plants across the region.
- Regulatory Landscape: Stringent quality and purity regulations in the pharmaceutical and food & beverage industries are further fueling demand.
Asia Pacific Chromatography Resins Industry Product Innovations
Recent years have witnessed significant advancements in chromatography resin technology, focusing on enhanced selectivity, higher binding capacity, improved flow rates, and greater resistance to harsh chemical conditions. New resin materials and modified surface chemistries have broadened applications across diverse industries. These innovations enhance the efficiency and cost-effectiveness of separation processes. Companies are strategically focusing on developing specialized resins tailored for specific applications, resulting in improved purification yields and reduced processing times. This includes developments in monolithic columns, providing higher efficiency and throughput compared to traditional packed columns.
Report Segmentation & Scope
This report segments the Asia Pacific chromatography resins market comprehensively:
By Technology: Ion Exchange Chromatography Resins, Affinity Chromatography Resins, Size Exclusion Chromatography Resins, Hydrophobic Interaction Chromatography Resins, and Other Technologies. Each segment's growth trajectory and competitive dynamics are analyzed, with detailed projections for market size and share.
By Origin: Natural-based and Synthetic-based resins are segmented to understand material-based trends and implications.
By End-user Industry: Pharmaceuticals, Water and Environmental Agencies, Food and Beverages, and Other End-user Industries. Market size and growth rates are detailed by end-use application.
Each segment analysis includes market size estimations, growth projections, and competitive analyses, offering a comprehensive view of the market structure and dynamics.
Key Drivers of Asia Pacific Chromatography Resins Industry Growth
The Asia Pacific chromatography resins market's growth is primarily driven by the burgeoning pharmaceutical and biotechnology industries, demanding high-purity products. Stringent regulatory frameworks mandating advanced purification techniques further propel market expansion. Technological advancements, resulting in more efficient and cost-effective resins, also contribute to this growth. Increasing investments in research and development by key players are augmenting innovations and application expansions.
Challenges in the Asia Pacific Chromatography Resins Industry Sector
The market faces challenges such as price fluctuations in raw materials, stringent regulatory approvals, and intense competition. Supply chain disruptions and the need for specialized expertise can impact market growth. The price sensitivity of certain end-user segments also poses a challenge. The overall impact of these challenges on market growth is estimated to be around xx% during the forecast period.
Leading Players in the Asia Pacific Chromatography Resins Industry Market
Key Developments in Asia Pacific Chromatography Resins Industry Sector
- January 2023: Merck KGaA launched a new line of high-performance chromatography resins for biopharmaceutical purification.
- June 2022: Bio-Rad Laboratories Inc announced a strategic partnership with a regional distributor to expand its market reach in Southeast Asia.
- October 2021: A major M&A deal involving two chromatography resin manufacturers consolidated market share and reshaped the competitive landscape (specific details omitted for confidentiality reasons). Deal value was estimated at xx Million.
Strategic Asia Pacific Chromatography Resins Industry Market Outlook
The Asia Pacific chromatography resins market is poised for sustained growth, driven by a confluence of factors, including the booming pharmaceutical industry, increasing adoption in diverse sectors, and ongoing technological advancements. Strategic opportunities exist in developing specialized resins for niche applications, expanding into emerging markets, and forging strategic partnerships. The market's future potential is significant, with continued growth expected across various segments. Focus on innovation and strategic partnerships will be crucial for players aiming to capitalize on this growth.
Asia Pacific Chromatography Resins Industry Segmentation
-
1. Origin
-
1.1. Natural-based
- 1.1.1. Agarose
- 1.1.2. Dextran
-
1.2. Synthetic-based
- 1.2.1. Silica Gel
- 1.2.2. Aluminum Oxide
- 1.2.3. Polystyrene
- 1.2.4. Other Synthetic-based Resins
-
1.1. Natural-based
-
2. Technology
- 2.1. Ion Exchange Chromatography Resins
- 2.2. Affinity Chromatography Resins
- 2.3. Size Exclusion Chromatography Resins
- 2.4. Hydrophobic Interaction Chromatography Resins
- 2.5. Other Technologies
-
3. End-user Industry
-
3.1. Pharmaceuticals
- 3.1.1. Biotechnology
- 3.1.2. Drug Discovery
- 3.1.3. Drug Production
- 3.2. Water and Environmental Agencies
- 3.3. Food and Beverages
- 3.4. Other End-user Industries
-
3.1. Pharmaceuticals
-
4. Geography
- 4.1. China
- 4.2. India
- 4.3. Japan
- 4.4. Rest of Asia-Pacific
Asia Pacific Chromatography Resins Industry Segmentation By Geography
- 1. China
- 2. India
- 3. Japan
- 4. Rest of Asia Pacific
Asia Pacific Chromatography Resins Industry Regional Market Share
Geographic Coverage of Asia Pacific Chromatography Resins Industry
Asia Pacific Chromatography Resins Industry REPORT HIGHLIGHTS
| Aspects | Details |
|---|---|
| Study Period | 2020-2034 |
| Base Year | 2025 |
| Estimated Year | 2026 |
| Forecast Period | 2026-2034 |
| Historical Period | 2020-2025 |
| Growth Rate | CAGR of > 7.00% from 2020-2034 |
| Segmentation |
|
Table of Contents
- 1. Introduction
- 1.1. Research Scope
- 1.2. Market Segmentation
- 1.3. Research Objective
- 1.4. Definitions and Assumptions
- 2. Executive Summary
- 2.1. Market Snapshot
- 3. Market Dynamics
- 3.1. Market Drivers
- 3.2. Market Restrains
- 3.3. Market Trends
- 3.4. Market Opportunities
- 4. Market Factor Analysis
- 4.1. Porters Five Forces
- 4.1.1. Bargaining Power of Suppliers
- 4.1.2. Bargaining Power of Buyers
- 4.1.3. Threat of New Entrants
- 4.1.4. Threat of Substitutes
- 4.1.5. Competitive Rivalry
- 4.2. PESTEL analysis
- 4.3. BCG Analysis
- 4.3.1. Stars (High Growth, High Market Share)
- 4.3.2. Cash Cows (Low Growth, High Market Share)
- 4.3.3. Question Mark (High Growth, Low Market Share)
- 4.3.4. Dogs (Low Growth, Low Market Share)
- 4.4. Ansoff Matrix Analysis
- 4.5. Supply Chain Analysis
- 4.6. Regulatory Landscape
- 4.7. Current Market Potential and Opportunity Assessment (TAM–SAM–SOM Framework)
- 4.8. PMV Analyst Note
- 4.1. Porters Five Forces
- 5. Market Analysis, Insights and Forecast 2021-2033
- 5.1. Market Analysis, Insights and Forecast - by Origin
- 5.1.1. Natural-based
- 5.1.1.1. Agarose
- 5.1.1.2. Dextran
- 5.1.2. Synthetic-based
- 5.1.2.1. Silica Gel
- 5.1.2.2. Aluminum Oxide
- 5.1.2.3. Polystyrene
- 5.1.2.4. Other Synthetic-based Resins
- 5.1.1. Natural-based
- 5.2. Market Analysis, Insights and Forecast - by Technology
- 5.2.1. Ion Exchange Chromatography Resins
- 5.2.2. Affinity Chromatography Resins
- 5.2.3. Size Exclusion Chromatography Resins
- 5.2.4. Hydrophobic Interaction Chromatography Resins
- 5.2.5. Other Technologies
- 5.3. Market Analysis, Insights and Forecast - by End-user Industry
- 5.3.1. Pharmaceuticals
- 5.3.1.1. Biotechnology
- 5.3.1.2. Drug Discovery
- 5.3.1.3. Drug Production
- 5.3.2. Water and Environmental Agencies
- 5.3.3. Food and Beverages
- 5.3.4. Other End-user Industries
- 5.3.1. Pharmaceuticals
- 5.4. Market Analysis, Insights and Forecast - by Geography
- 5.4.1. China
- 5.4.2. India
- 5.4.3. Japan
- 5.4.4. Rest of Asia-Pacific
- 5.5. Market Analysis, Insights and Forecast - by Region
- 5.5.1. China
- 5.5.2. India
- 5.5.3. Japan
- 5.5.4. Rest of Asia Pacific
- 5.1. Market Analysis, Insights and Forecast - by Origin
- 6. Asia Pacific Chromatography Resins Industry Analysis, Insights and Forecast, 2021-2033
- 6.1. Market Analysis, Insights and Forecast - by Origin
- 6.1.1. Natural-based
- 6.1.1.1. Agarose
- 6.1.1.2. Dextran
- 6.1.2. Synthetic-based
- 6.1.2.1. Silica Gel
- 6.1.2.2. Aluminum Oxide
- 6.1.2.3. Polystyrene
- 6.1.2.4. Other Synthetic-based Resins
- 6.1.1. Natural-based
- 6.2. Market Analysis, Insights and Forecast - by Technology
- 6.2.1. Ion Exchange Chromatography Resins
- 6.2.2. Affinity Chromatography Resins
- 6.2.3. Size Exclusion Chromatography Resins
- 6.2.4. Hydrophobic Interaction Chromatography Resins
- 6.2.5. Other Technologies
- 6.3. Market Analysis, Insights and Forecast - by End-user Industry
- 6.3.1. Pharmaceuticals
- 6.3.1.1. Biotechnology
- 6.3.1.2. Drug Discovery
- 6.3.1.3. Drug Production
- 6.3.2. Water and Environmental Agencies
- 6.3.3. Food and Beverages
- 6.3.4. Other End-user Industries
- 6.3.1. Pharmaceuticals
- 6.4. Market Analysis, Insights and Forecast - by Geography
- 6.4.1. China
- 6.4.2. India
- 6.4.3. Japan
- 6.4.4. Rest of Asia-Pacific
- 6.1. Market Analysis, Insights and Forecast - by Origin
- 7. China Asia Pacific Chromatography Resins Industry Analysis, Insights and Forecast, 2020-2032
- 7.1. Market Analysis, Insights and Forecast - by Origin
- 7.1.1. Natural-based
- 7.1.1.1. Agarose
- 7.1.1.2. Dextran
- 7.1.2. Synthetic-based
- 7.1.2.1. Silica Gel
- 7.1.2.2. Aluminum Oxide
- 7.1.2.3. Polystyrene
- 7.1.2.4. Other Synthetic-based Resins
- 7.1.1. Natural-based
- 7.2. Market Analysis, Insights and Forecast - by Technology
- 7.2.1. Ion Exchange Chromatography Resins
- 7.2.2. Affinity Chromatography Resins
- 7.2.3. Size Exclusion Chromatography Resins
- 7.2.4. Hydrophobic Interaction Chromatography Resins
- 7.2.5. Other Technologies
- 7.3. Market Analysis, Insights and Forecast - by End-user Industry
- 7.3.1. Pharmaceuticals
- 7.3.1.1. Biotechnology
- 7.3.1.2. Drug Discovery
- 7.3.1.3. Drug Production
- 7.3.2. Water and Environmental Agencies
- 7.3.3. Food and Beverages
- 7.3.4. Other End-user Industries
- 7.3.1. Pharmaceuticals
- 7.4. Market Analysis, Insights and Forecast - by Geography
- 7.4.1. China
- 7.4.2. India
- 7.4.3. Japan
- 7.4.4. Rest of Asia-Pacific
- 7.1. Market Analysis, Insights and Forecast - by Origin
- 8. India Asia Pacific Chromatography Resins Industry Analysis, Insights and Forecast, 2020-2032
- 8.1. Market Analysis, Insights and Forecast - by Origin
- 8.1.1. Natural-based
- 8.1.1.1. Agarose
- 8.1.1.2. Dextran
- 8.1.2. Synthetic-based
- 8.1.2.1. Silica Gel
- 8.1.2.2. Aluminum Oxide
- 8.1.2.3. Polystyrene
- 8.1.2.4. Other Synthetic-based Resins
- 8.1.1. Natural-based
- 8.2. Market Analysis, Insights and Forecast - by Technology
- 8.2.1. Ion Exchange Chromatography Resins
- 8.2.2. Affinity Chromatography Resins
- 8.2.3. Size Exclusion Chromatography Resins
- 8.2.4. Hydrophobic Interaction Chromatography Resins
- 8.2.5. Other Technologies
- 8.3. Market Analysis, Insights and Forecast - by End-user Industry
- 8.3.1. Pharmaceuticals
- 8.3.1.1. Biotechnology
- 8.3.1.2. Drug Discovery
- 8.3.1.3. Drug Production
- 8.3.2. Water and Environmental Agencies
- 8.3.3. Food and Beverages
- 8.3.4. Other End-user Industries
- 8.3.1. Pharmaceuticals
- 8.4. Market Analysis, Insights and Forecast - by Geography
- 8.4.1. China
- 8.4.2. India
- 8.4.3. Japan
- 8.4.4. Rest of Asia-Pacific
- 8.1. Market Analysis, Insights and Forecast - by Origin
- 9. Japan Asia Pacific Chromatography Resins Industry Analysis, Insights and Forecast, 2020-2032
- 9.1. Market Analysis, Insights and Forecast - by Origin
- 9.1.1. Natural-based
- 9.1.1.1. Agarose
- 9.1.1.2. Dextran
- 9.1.2. Synthetic-based
- 9.1.2.1. Silica Gel
- 9.1.2.2. Aluminum Oxide
- 9.1.2.3. Polystyrene
- 9.1.2.4. Other Synthetic-based Resins
- 9.1.1. Natural-based
- 9.2. Market Analysis, Insights and Forecast - by Technology
- 9.2.1. Ion Exchange Chromatography Resins
- 9.2.2. Affinity Chromatography Resins
- 9.2.3. Size Exclusion Chromatography Resins
- 9.2.4. Hydrophobic Interaction Chromatography Resins
- 9.2.5. Other Technologies
- 9.3. Market Analysis, Insights and Forecast - by End-user Industry
- 9.3.1. Pharmaceuticals
- 9.3.1.1. Biotechnology
- 9.3.1.2. Drug Discovery
- 9.3.1.3. Drug Production
- 9.3.2. Water and Environmental Agencies
- 9.3.3. Food and Beverages
- 9.3.4. Other End-user Industries
- 9.3.1. Pharmaceuticals
- 9.4. Market Analysis, Insights and Forecast - by Geography
- 9.4.1. China
- 9.4.2. India
- 9.4.3. Japan
- 9.4.4. Rest of Asia-Pacific
- 9.1. Market Analysis, Insights and Forecast - by Origin
- 10. Rest of Asia Pacific Asia Pacific Chromatography Resins Industry Analysis, Insights and Forecast, 2020-2032
- 10.1. Market Analysis, Insights and Forecast - by Origin
- 10.1.1. Natural-based
- 10.1.1.1. Agarose
- 10.1.1.2. Dextran
- 10.1.2. Synthetic-based
- 10.1.2.1. Silica Gel
- 10.1.2.2. Aluminum Oxide
- 10.1.2.3. Polystyrene
- 10.1.2.4. Other Synthetic-based Resins
- 10.1.1. Natural-based
- 10.2. Market Analysis, Insights and Forecast - by Technology
- 10.2.1. Ion Exchange Chromatography Resins
- 10.2.2. Affinity Chromatography Resins
- 10.2.3. Size Exclusion Chromatography Resins
- 10.2.4. Hydrophobic Interaction Chromatography Resins
- 10.2.5. Other Technologies
- 10.3. Market Analysis, Insights and Forecast - by End-user Industry
- 10.3.1. Pharmaceuticals
- 10.3.1.1. Biotechnology
- 10.3.1.2. Drug Discovery
- 10.3.1.3. Drug Production
- 10.3.2. Water and Environmental Agencies
- 10.3.3. Food and Beverages
- 10.3.4. Other End-user Industries
- 10.3.1. Pharmaceuticals
- 10.4. Market Analysis, Insights and Forecast - by Geography
- 10.4.1. China
- 10.4.2. India
- 10.4.3. Japan
- 10.4.4. Rest of Asia-Pacific
- 10.1. Market Analysis, Insights and Forecast - by Origin
- 11. Competitive Analysis
- 11.1. Company Profiles
- 11.1.1 General Electric
- 11.1.1.1. Company Overview
- 11.1.1.2. Products
- 11.1.1.3. Company Financials
- 11.1.1.4. SWOT Analysis
- 11.1.2 Bio-Rad Laboratories Inc
- 11.1.2.1. Company Overview
- 11.1.2.2. Products
- 11.1.2.3. Company Financials
- 11.1.2.4. SWOT Analysis
- 11.1.3 Merck KGaA
- 11.1.3.1. Company Overview
- 11.1.3.2. Products
- 11.1.3.3. Company Financials
- 11.1.3.4. SWOT Analysis
- 11.1.4 Mitsubishi Chemical Corporation
- 11.1.4.1. Company Overview
- 11.1.4.2. Products
- 11.1.4.3. Company Financials
- 11.1.4.4. SWOT Analysis
- 11.1.5 Dupont
- 11.1.5.1. Company Overview
- 11.1.5.2. Products
- 11.1.5.3. Company Financials
- 11.1.5.4. SWOT Analysis
- 11.1.6 Pall Corporation
- 11.1.6.1. Company Overview
- 11.1.6.2. Products
- 11.1.6.3. Company Financials
- 11.1.6.4. SWOT Analysis
- 11.1.7 Tosoh Bioscience LLC*List Not Exhaustive
- 11.1.7.1. Company Overview
- 11.1.7.2. Products
- 11.1.7.3. Company Financials
- 11.1.7.4. SWOT Analysis
- 11.1.8 Purolite
- 11.1.8.1. Company Overview
- 11.1.8.2. Products
- 11.1.8.3. Company Financials
- 11.1.8.4. SWOT Analysis
- 11.1.9 Agilient Technologies
- 11.1.9.1. Company Overview
- 11.1.9.2. Products
- 11.1.9.3. Company Financials
- 11.1.9.4. SWOT Analysis
- 11.1.10 Avantor Inc
- 11.1.10.1. Company Overview
- 11.1.10.2. Products
- 11.1.10.3. Company Financials
- 11.1.10.4. SWOT Analysis
- 11.1.11 Thermo Fisher Scientific
- 11.1.11.1. Company Overview
- 11.1.11.2. Products
- 11.1.11.3. Company Financials
- 11.1.11.4. SWOT Analysis
- 11.1.1 General Electric
- 11.2. Market Entropy
- 11.2.1 Company's Key Areas Served
- 11.2.2 Recent Developments
- 11.3. Company Market Share Analysis 2025
- 11.3.1 Top 5 Companies Market Share Analysis
- 11.3.2 Top 3 Companies Market Share Analysis
- 11.4. List of Potential Customers
- 12. Research Methodology
List of Figures
- Figure 1: Asia Pacific Chromatography Resins Industry Revenue Breakdown (Million, %) by Product 2025 & 2033
- Figure 2: Asia Pacific Chromatography Resins Industry Share (%) by Company 2025
List of Tables
- Table 1: Asia Pacific Chromatography Resins Industry Revenue Million Forecast, by Origin 2020 & 2033
- Table 2: Asia Pacific Chromatography Resins Industry Volume K Tons Forecast, by Origin 2020 & 2033
- Table 3: Asia Pacific Chromatography Resins Industry Revenue Million Forecast, by Technology 2020 & 2033
- Table 4: Asia Pacific Chromatography Resins Industry Volume K Tons Forecast, by Technology 2020 & 2033
- Table 5: Asia Pacific Chromatography Resins Industry Revenue Million Forecast, by End-user Industry 2020 & 2033
- Table 6: Asia Pacific Chromatography Resins Industry Volume K Tons Forecast, by End-user Industry 2020 & 2033
- Table 7: Asia Pacific Chromatography Resins Industry Revenue Million Forecast, by Geography 2020 & 2033
- Table 8: Asia Pacific Chromatography Resins Industry Volume K Tons Forecast, by Geography 2020 & 2033
- Table 9: Asia Pacific Chromatography Resins Industry Revenue Million Forecast, by Region 2020 & 2033
- Table 10: Asia Pacific Chromatography Resins Industry Volume K Tons Forecast, by Region 2020 & 2033
- Table 11: Asia Pacific Chromatography Resins Industry Revenue Million Forecast, by Origin 2020 & 2033
- Table 12: Asia Pacific Chromatography Resins Industry Volume K Tons Forecast, by Origin 2020 & 2033
- Table 13: Asia Pacific Chromatography Resins Industry Revenue Million Forecast, by Technology 2020 & 2033
- Table 14: Asia Pacific Chromatography Resins Industry Volume K Tons Forecast, by Technology 2020 & 2033
- Table 15: Asia Pacific Chromatography Resins Industry Revenue Million Forecast, by End-user Industry 2020 & 2033
- Table 16: Asia Pacific Chromatography Resins Industry Volume K Tons Forecast, by End-user Industry 2020 & 2033
- Table 17: Asia Pacific Chromatography Resins Industry Revenue Million Forecast, by Geography 2020 & 2033
- Table 18: Asia Pacific Chromatography Resins Industry Volume K Tons Forecast, by Geography 2020 & 2033
- Table 19: Asia Pacific Chromatography Resins Industry Revenue Million Forecast, by Country 2020 & 2033
- Table 20: Asia Pacific Chromatography Resins Industry Volume K Tons Forecast, by Country 2020 & 2033
- Table 21: Asia Pacific Chromatography Resins Industry Revenue Million Forecast, by Origin 2020 & 2033
- Table 22: Asia Pacific Chromatography Resins Industry Volume K Tons Forecast, by Origin 2020 & 2033
- Table 23: Asia Pacific Chromatography Resins Industry Revenue Million Forecast, by Technology 2020 & 2033
- Table 24: Asia Pacific Chromatography Resins Industry Volume K Tons Forecast, by Technology 2020 & 2033
- Table 25: Asia Pacific Chromatography Resins Industry Revenue Million Forecast, by End-user Industry 2020 & 2033
- Table 26: Asia Pacific Chromatography Resins Industry Volume K Tons Forecast, by End-user Industry 2020 & 2033
- Table 27: Asia Pacific Chromatography Resins Industry Revenue Million Forecast, by Geography 2020 & 2033
- Table 28: Asia Pacific Chromatography Resins Industry Volume K Tons Forecast, by Geography 2020 & 2033
- Table 29: Asia Pacific Chromatography Resins Industry Revenue Million Forecast, by Country 2020 & 2033
- Table 30: Asia Pacific Chromatography Resins Industry Volume K Tons Forecast, by Country 2020 & 2033
- Table 31: Asia Pacific Chromatography Resins Industry Revenue Million Forecast, by Origin 2020 & 2033
- Table 32: Asia Pacific Chromatography Resins Industry Volume K Tons Forecast, by Origin 2020 & 2033
- Table 33: Asia Pacific Chromatography Resins Industry Revenue Million Forecast, by Technology 2020 & 2033
- Table 34: Asia Pacific Chromatography Resins Industry Volume K Tons Forecast, by Technology 2020 & 2033
- Table 35: Asia Pacific Chromatography Resins Industry Revenue Million Forecast, by End-user Industry 2020 & 2033
- Table 36: Asia Pacific Chromatography Resins Industry Volume K Tons Forecast, by End-user Industry 2020 & 2033
- Table 37: Asia Pacific Chromatography Resins Industry Revenue Million Forecast, by Geography 2020 & 2033
- Table 38: Asia Pacific Chromatography Resins Industry Volume K Tons Forecast, by Geography 2020 & 2033
- Table 39: Asia Pacific Chromatography Resins Industry Revenue Million Forecast, by Country 2020 & 2033
- Table 40: Asia Pacific Chromatography Resins Industry Volume K Tons Forecast, by Country 2020 & 2033
- Table 41: Asia Pacific Chromatography Resins Industry Revenue Million Forecast, by Origin 2020 & 2033
- Table 42: Asia Pacific Chromatography Resins Industry Volume K Tons Forecast, by Origin 2020 & 2033
- Table 43: Asia Pacific Chromatography Resins Industry Revenue Million Forecast, by Technology 2020 & 2033
- Table 44: Asia Pacific Chromatography Resins Industry Volume K Tons Forecast, by Technology 2020 & 2033
- Table 45: Asia Pacific Chromatography Resins Industry Revenue Million Forecast, by End-user Industry 2020 & 2033
- Table 46: Asia Pacific Chromatography Resins Industry Volume K Tons Forecast, by End-user Industry 2020 & 2033
- Table 47: Asia Pacific Chromatography Resins Industry Revenue Million Forecast, by Geography 2020 & 2033
- Table 48: Asia Pacific Chromatography Resins Industry Volume K Tons Forecast, by Geography 2020 & 2033
- Table 49: Asia Pacific Chromatography Resins Industry Revenue Million Forecast, by Country 2020 & 2033
- Table 50: Asia Pacific Chromatography Resins Industry Volume K Tons Forecast, by Country 2020 & 2033
Frequently Asked Questions
1. What is the projected Compound Annual Growth Rate (CAGR) of the Asia Pacific Chromatography Resins Industry?
The projected CAGR is approximately > 7.00%.
2. Which companies are prominent players in the Asia Pacific Chromatography Resins Industry?
Key companies in the market include General Electric, Bio-Rad Laboratories Inc, Merck KGaA, Mitsubishi Chemical Corporation, Dupont, Pall Corporation, Tosoh Bioscience LLC*List Not Exhaustive, Purolite, Agilient Technologies, Avantor Inc, Thermo Fisher Scientific.
3. What are the main segments of the Asia Pacific Chromatography Resins Industry?
The market segments include Origin, Technology, End-user Industry, Geography.
4. Can you provide details about the market size?
The market size is estimated to be USD 646.7 Million as of 2022.
5. What are some drivers contributing to market growth?
; Rising Demand from the Pharmaceutical Sector; Technological Advancements in Chromatography Resins; Increasing Importance of Chromatography Tests in Drug Approvals.
6. What are the notable trends driving market growth?
Increasing Demand from Pharmaceutical Sector.
7. Are there any restraints impacting market growth?
; High Costs vs. Productivity of Chromatography Systems.
8. Can you provide examples of recent developments in the market?
N/A
9. What pricing options are available for accessing the report?
Pricing options include single-user, multi-user, and enterprise licenses priced at USD 4750, USD 5250, and USD 8750 respectively.
10. Is the market size provided in terms of value or volume?
The market size is provided in terms of value, measured in Million and volume, measured in K Tons.
11. Are there any specific market keywords associated with the report?
Yes, the market keyword associated with the report is "Asia Pacific Chromatography Resins Industry," which aids in identifying and referencing the specific market segment covered.
12. How do I determine which pricing option suits my needs best?
The pricing options vary based on user requirements and access needs. Individual users may opt for single-user licenses, while businesses requiring broader access may choose multi-user or enterprise licenses for cost-effective access to the report.
13. Are there any additional resources or data provided in the Asia Pacific Chromatography Resins Industry report?
While the report offers comprehensive insights, it's advisable to review the specific contents or supplementary materials provided to ascertain if additional resources or data are available.
14. How can I stay updated on further developments or reports in the Asia Pacific Chromatography Resins Industry?
To stay informed about further developments, trends, and reports in the Asia Pacific Chromatography Resins Industry, consider subscribing to industry newsletters, following relevant companies and organizations, or regularly checking reputable industry news sources and publications.
Methodology
Step 1 - Identification of Relevant Samples Size from Population Database


Step 2 - Approaches for Defining Global Market Size (Value, Volume* & Price*)

Note*: In applicable scenarios
Step 3 - Data Sources
Primary Research
- Web Analytics
- Survey Reports
- Research Institute
- Latest Research Reports
- Opinion Leaders
Secondary Research
- Annual Reports
- White Paper
- Latest Press Release
- Industry Association
- Paid Database
- Investor Presentations

Step 4 - Data Triangulation
Involves using different sources of information in order to increase the validity of a study
These sources are likely to be stakeholders in a program - participants, other researchers, program staff, other community members, and so on.
Then we put all data in single framework & apply various statistical tools to find out the dynamic on the market.
During the analysis stage, feedback from the stakeholder groups would be compared to determine areas of agreement as well as areas of divergence