

Key Insights
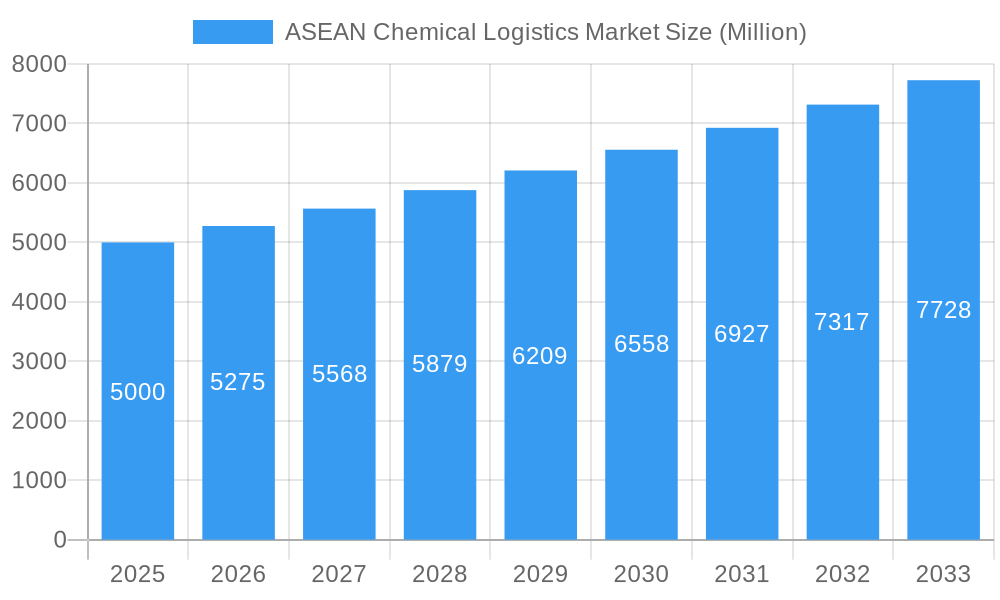
The ASEAN Chemical Logistics Market is poised for substantial growth, projecting a Compound Annual Growth Rate (CAGR) of 9.53%. This expansion is propelled by the region's dynamic chemical industry and evolving manufacturing sector. Key growth drivers include escalating demand for specialty chemicals in pharmaceuticals, cosmetics, and oil & gas; increased intra-ASEAN trade facilitated by infrastructure development and trade agreements; and the integration of advanced logistics technologies such as real-time tracking and sophisticated inventory management systems. The market is segmented by service (transportation, warehousing), mode of transportation (road, rail, air, sea, pipeline), and end-user industry. While road transport currently leads, the demand for expedited delivery is accelerating the adoption of air and rail for time-sensitive chemical consignments. The burgeoning e-commerce sector further amplifies the need for efficient last-mile delivery solutions, presenting a critical focus area for market participants. Navigating challenges such as infrastructural disparities, stringent regulations for hazardous chemical transport, and supply chain resilience will be crucial. Emerging trends include a strong emphasis on green logistics and reducing the environmental footprint of chemical transportation.
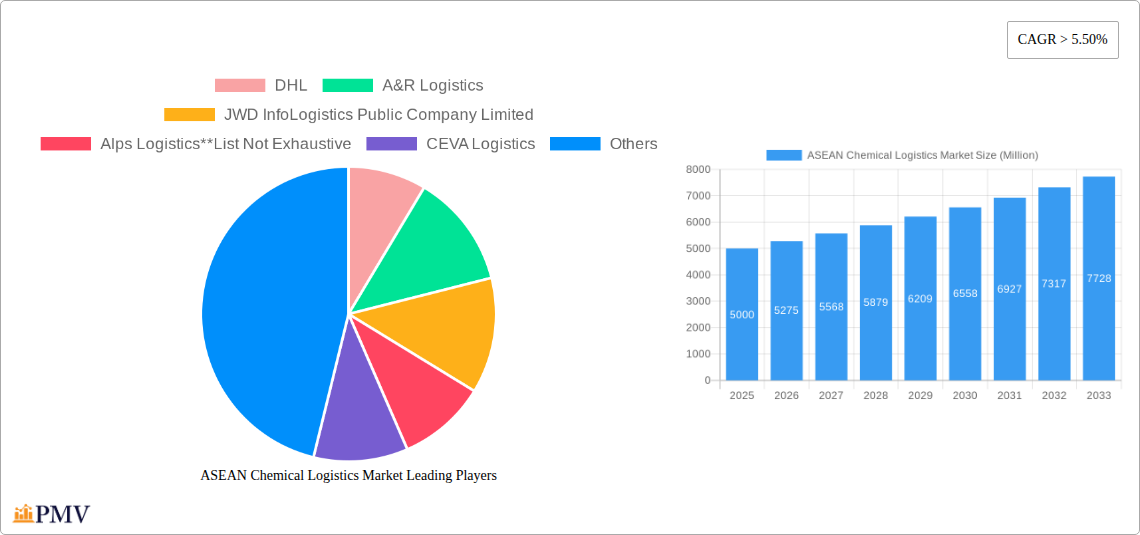
ASEAN Chemical Logistics Market Market Size (In Billion)
Leading players including DHL, A&R Logistics, and JWD InfoLogistics are strategically expanding their service offerings and investing in infrastructure to capitalize on this market opportunity. The competitive environment is characterized by a mix of established multinational corporations and agile regional providers. Future market dynamics will be shaped by government initiatives promoting regional economic integration, the adoption of Industry 4.0 technologies within chemical supply chains, and a growing commitment to sustainable logistics practices. With an estimated market size of 47.53 billion in the base year 2025, significant opportunities are available for both large-scale multinational entities and specialized niche logistics providers to achieve growth and market penetration.
ASEAN Chemical Logistics Market Company Market Share
ASEAN Chemical Logistics Market: A Comprehensive Report (2019-2033)
This in-depth report provides a comprehensive analysis of the ASEAN chemical logistics market, covering market size, growth drivers, competitive landscape, and future outlook. The study period spans from 2019 to 2033, with 2025 as the base and estimated year. The report offers actionable insights for stakeholders across the chemical supply chain, from manufacturers to logistics providers. With a focus on key segments and leading players like DHL, A&R Logistics, JWD InfoLogistics, and Alps Logistics, this report is an essential resource for strategic decision-making.
ASEAN Chemical Logistics Market Structure & Competitive Dynamics
The ASEAN chemical logistics market exhibits a moderately concentrated structure, with several large multinational players competing alongside regional specialists. Market share is dynamic, influenced by M&A activity and evolving end-user demands. Innovation in areas like green logistics and digitalization is driving differentiation. Regulatory frameworks vary across ASEAN nations, impacting compliance and operational costs. Product substitution is limited due to the specialized nature of chemical handling, however, the increasing adoption of sustainable practices is driving innovation in environmentally friendly transportation and warehousing. End-user trends, such as the growth of the pharmaceutical and specialty chemical sectors, significantly influence market demand. Recent M&A activities, though exact deal values remain at xx Million, indicate consolidation within the sector.
- Market Concentration: Moderately concentrated, with both large global and regional players.
- Innovation Ecosystems: Focus on green logistics, digitalization, and enhanced safety protocols.
- Regulatory Frameworks: Vary across ASEAN nations, impacting compliance and operational costs.
- Product Substitutes: Limited due to specialized nature of chemical handling.
- End-User Trends: Growing pharmaceutical, specialty chemicals, and cosmetic industries fuel demand.
- M&A Activities: Recent deals (xx Million in value) reflect consolidation and expansion strategies.
ASEAN Chemical Logistics Market Industry Trends & Insights
The ASEAN chemical logistics market is experiencing robust growth, driven by increasing industrialization, expanding manufacturing capacity, and rising cross-border trade within the region. The market is projected to witness a CAGR of xx% during the forecast period (2025-2033), reaching a market value of xx Million by 2033. Technological advancements, including the adoption of IoT and AI-powered solutions, are transforming efficiency and enhancing supply chain visibility. Consumer preferences towards sustainable and ethical sourcing practices are pushing adoption of green logistics solutions. Intense competition drives innovation and necessitates efficient operations. Market penetration of advanced logistics technologies is increasing, with xx% adoption rate projected by 2033.
Dominant Markets & Segments in ASEAN Chemical Logistics Market
The report identifies specific leading regions, countries, and segments within the ASEAN chemical logistics market.
- By Service: Transportation currently holds the largest market share, followed by warehousing and distribution. Growth in the consulting & management services segment is anticipated due to the increasing complexity of chemical logistics.
- By Mode of Transportation: Roadways dominate due to extensive road networks, while waterway transportation is significant for bulk chemicals. Airways cater to high-value, time-sensitive shipments.
- By End User: The pharmaceutical industry and the specialty chemical industry are major drivers of market demand, fueled by expanding production and exports.
Key Drivers:
- Robust economic growth across ASEAN nations
- Increasing industrialization and manufacturing expansion
- Growing cross-border trade within ASEAN
- Development of improved infrastructure (e.g., ports, roadways)
- Government initiatives promoting regional economic integration
The dominance analysis showcases Singapore and Malaysia as leading countries due to their advanced infrastructure and strategic location. Vietnam's rapidly growing manufacturing sector is also driving strong growth.
ASEAN Chemical Logistics Market Product Innovations
Recent innovations focus on enhancing safety, efficiency, and sustainability in chemical logistics. This includes specialized containers for hazardous materials, automated warehousing systems, and real-time tracking solutions. The integration of IoT and AI technologies enhances visibility, optimizes routes, and minimizes risks. These technological advancements are improving efficiency, reducing costs, and enhancing overall supply chain resilience.
Report Segmentation & Scope
This report segments the ASEAN chemical logistics market comprehensively across:
By Service: Transportation, Warehousing, Distribution, and Inventory Management, Consulting & Management Services, Customs & Security, Green Logistics, Others. Each segment's growth projection, market size, and competitive dynamics are analyzed.
By Mode of Transportation: Roadways, Railways, Airways, Waterways, Pipelines. Growth projections for each mode are provided based on infrastructure development and cost-efficiency factors. Competitive dynamics are analyzed considering each mode's strengths and limitations.
By End User: Pharmaceutical Industry, Specialty Chemical Industry, Oil and Gas Industry, Cosmetic Industry, Others. The report details each end-user's contribution to market size and growth projections. Competitive dynamics consider the unique logistics requirements of each industry.
Key Drivers of ASEAN Chemical Logistics Market Growth
Several factors fuel the growth of the ASEAN chemical logistics market. Strong economic growth across the region drives demand for chemical products. Increasing industrialization and manufacturing capacity necessitate robust logistics networks. Growing cross-border trade within ASEAN necessitates efficient and reliable transport and warehousing. Government initiatives aimed at improving infrastructure (such as port expansions and improved road networks) further enhance the sector's growth. Finally, the rising adoption of technology to enhance efficiency and supply chain visibility are crucial catalysts for market expansion.
Challenges in the ASEAN Chemical Logistics Market Sector
The ASEAN chemical logistics market faces challenges such as varying regulatory frameworks across different countries, leading to compliance complexities. Supply chain disruptions due to geopolitical events or natural disasters impact the sector's resilience. Furthermore, intense competition among logistics providers requires companies to maintain operational efficiency and offer competitive pricing. These challenges, if not effectively addressed, can hamper the sector's growth and profitability.
Leading Players in the ASEAN Chemical Logistics Market Market
- DHL
- A&R Logistics
- JWD InfoLogistics Public Company Limited
- Alps Logistics
- CEVA Logistics
- Agility Logistics
- CT Logistics
- Tiong Nam Logistics Holdings BhD
- Eagles Air & Sea
- BDP International
- Rinchem
- Rhenus Logistics
Key Developments in ASEAN Chemical Logistics Market Sector
- October 2022: Rinchem's new Malaysian chemical warehouse (45,000 sq. ft., 3100 pallet positions) expands its capacity in the region.
- February 2022: Leschaco opens a new chemical and dangerous goods warehouse in Port Klang, Malaysia (120,000 sq. ft., 13,000 pallet positions), highlighting the growing demand for contract logistics.
- October 2021: Ratanakorn Asset and FLS form a joint venture (FLS Supply Chain Centers) to develop specialized warehouse complexes in Thailand, starting with a 10,000-square-meter hazardous chemical warehouse in Maptaphut, Rayong.
Strategic ASEAN Chemical Logistics Market Outlook
The ASEAN chemical logistics market presents significant growth potential, driven by continued economic expansion, rising industrial activity, and advancements in technology. Strategic opportunities lie in investing in innovative solutions for hazardous materials handling, implementing sustainable practices, and capitalizing on the increasing demand for specialized services. Companies that adapt quickly to evolving regulatory requirements and successfully navigate the competitive landscape are poised for significant success.
ASEAN Chemical Logistics Market Segmentation
-
1. Service
- 1.1. Transportation
- 1.2. Warehous
- 1.3. Consulting & Management Services
- 1.4. Customs & Security
- 1.5. Green Logistics
- 1.6. Others
-
2. Mode of Transportation
- 2.1. Roadways
- 2.2. Railways
- 2.3. Airways
- 2.4. Waterways
- 2.5. Pipelines
-
3. End User
- 3.1. Pharmaceutical Industry
- 3.2. Specialty Chemical Industry
- 3.3. Oil and Gas Industry
- 3.4. Cosmetic Industry
- 3.5. Others
-
4. Geography
- 4.1. Singapore
- 4.2. Thailand
- 4.3. Malaysia
- 4.4. Vietnam
- 4.5. Indonesia
- 4.6. Philippines
- 4.7. Rest of ASEAN
ASEAN Chemical Logistics Market Segmentation By Geography
- 1. Singapore
- 2. Thailand
- 3. Malaysia
- 4. Vietnam
- 5. Indonesia
- 6. Philippines
- 7. Rest of ASEAN
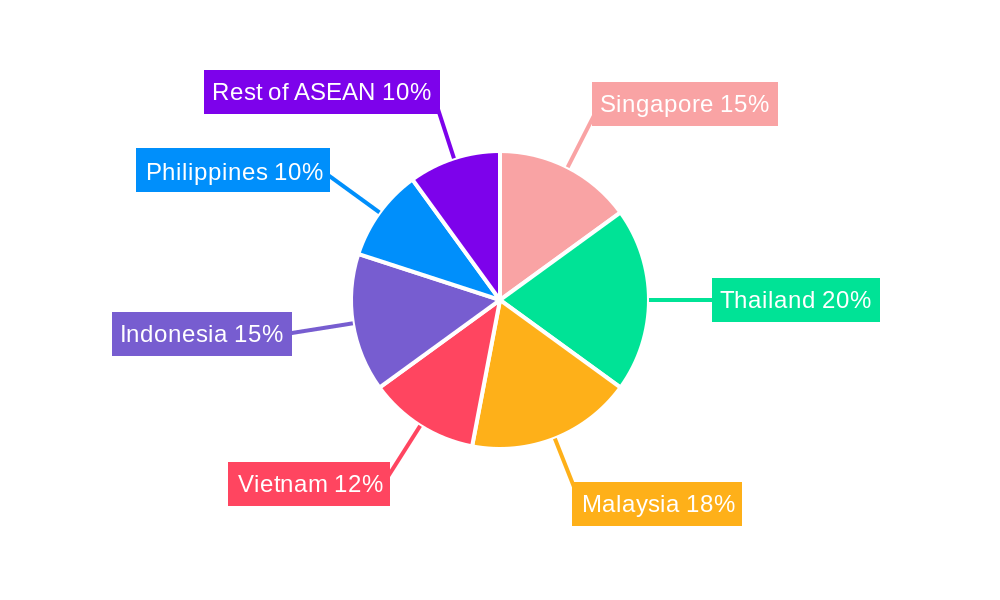
ASEAN Chemical Logistics Market Regional Market Share
Geographic Coverage of ASEAN Chemical Logistics Market
ASEAN Chemical Logistics Market REPORT HIGHLIGHTS
| Aspects | Details |
|---|---|
| Study Period | 2020-2034 |
| Base Year | 2025 |
| Estimated Year | 2026 |
| Forecast Period | 2026-2034 |
| Historical Period | 2020-2025 |
| Growth Rate | CAGR of 9.53% from 2020-2034 |
| Segmentation |
|
Table of Contents
- 1. Introduction
- 1.1. Research Scope
- 1.2. Market Segmentation
- 1.3. Research Objective
- 1.4. Definitions and Assumptions
- 2. Executive Summary
- 2.1. Market Snapshot
- 3. Market Dynamics
- 3.1. Market Drivers
- 3.2. Market Restrains
- 3.3. Market Trends
- 3.4. Market Opportunities
- 4. Market Factor Analysis
- 4.1. Porters Five Forces
- 4.1.1. Bargaining Power of Suppliers
- 4.1.2. Bargaining Power of Buyers
- 4.1.3. Threat of New Entrants
- 4.1.4. Threat of Substitutes
- 4.1.5. Competitive Rivalry
- 4.2. PESTEL analysis
- 4.3. BCG Analysis
- 4.3.1. Stars (High Growth, High Market Share)
- 4.3.2. Cash Cows (Low Growth, High Market Share)
- 4.3.3. Question Mark (High Growth, Low Market Share)
- 4.3.4. Dogs (Low Growth, Low Market Share)
- 4.4. Ansoff Matrix Analysis
- 4.5. Supply Chain Analysis
- 4.6. Regulatory Landscape
- 4.7. Current Market Potential and Opportunity Assessment (TAM–SAM–SOM Framework)
- 4.8. PMV Analyst Note
- 4.1. Porters Five Forces
- 5. Market Analysis, Insights and Forecast 2021-2033
- 5.1. Market Analysis, Insights and Forecast - by Service
- 5.1.1. Transportation
- 5.1.2. Warehous
- 5.1.3. Consulting & Management Services
- 5.1.4. Customs & Security
- 5.1.5. Green Logistics
- 5.1.6. Others
- 5.2. Market Analysis, Insights and Forecast - by Mode of Transportation
- 5.2.1. Roadways
- 5.2.2. Railways
- 5.2.3. Airways
- 5.2.4. Waterways
- 5.2.5. Pipelines
- 5.3. Market Analysis, Insights and Forecast - by End User
- 5.3.1. Pharmaceutical Industry
- 5.3.2. Specialty Chemical Industry
- 5.3.3. Oil and Gas Industry
- 5.3.4. Cosmetic Industry
- 5.3.5. Others
- 5.4. Market Analysis, Insights and Forecast - by Geography
- 5.4.1. Singapore
- 5.4.2. Thailand
- 5.4.3. Malaysia
- 5.4.4. Vietnam
- 5.4.5. Indonesia
- 5.4.6. Philippines
- 5.4.7. Rest of ASEAN
- 5.5. Market Analysis, Insights and Forecast - by Region
- 5.5.1. Singapore
- 5.5.2. Thailand
- 5.5.3. Malaysia
- 5.5.4. Vietnam
- 5.5.5. Indonesia
- 5.5.6. Philippines
- 5.5.7. Rest of ASEAN
- 5.1. Market Analysis, Insights and Forecast - by Service
- 6. Global ASEAN Chemical Logistics Market Analysis, Insights and Forecast, 2021-2033
- 6.1. Market Analysis, Insights and Forecast - by Service
- 6.1.1. Transportation
- 6.1.2. Warehous
- 6.1.3. Consulting & Management Services
- 6.1.4. Customs & Security
- 6.1.5. Green Logistics
- 6.1.6. Others
- 6.2. Market Analysis, Insights and Forecast - by Mode of Transportation
- 6.2.1. Roadways
- 6.2.2. Railways
- 6.2.3. Airways
- 6.2.4. Waterways
- 6.2.5. Pipelines
- 6.3. Market Analysis, Insights and Forecast - by End User
- 6.3.1. Pharmaceutical Industry
- 6.3.2. Specialty Chemical Industry
- 6.3.3. Oil and Gas Industry
- 6.3.4. Cosmetic Industry
- 6.3.5. Others
- 6.4. Market Analysis, Insights and Forecast - by Geography
- 6.4.1. Singapore
- 6.4.2. Thailand
- 6.4.3. Malaysia
- 6.4.4. Vietnam
- 6.4.5. Indonesia
- 6.4.6. Philippines
- 6.4.7. Rest of ASEAN
- 6.1. Market Analysis, Insights and Forecast - by Service
- 7. Singapore ASEAN Chemical Logistics Market Analysis, Insights and Forecast, 2020-2032
- 7.1. Market Analysis, Insights and Forecast - by Service
- 7.1.1. Transportation
- 7.1.2. Warehous
- 7.1.3. Consulting & Management Services
- 7.1.4. Customs & Security
- 7.1.5. Green Logistics
- 7.1.6. Others
- 7.2. Market Analysis, Insights and Forecast - by Mode of Transportation
- 7.2.1. Roadways
- 7.2.2. Railways
- 7.2.3. Airways
- 7.2.4. Waterways
- 7.2.5. Pipelines
- 7.3. Market Analysis, Insights and Forecast - by End User
- 7.3.1. Pharmaceutical Industry
- 7.3.2. Specialty Chemical Industry
- 7.3.3. Oil and Gas Industry
- 7.3.4. Cosmetic Industry
- 7.3.5. Others
- 7.4. Market Analysis, Insights and Forecast - by Geography
- 7.4.1. Singapore
- 7.4.2. Thailand
- 7.4.3. Malaysia
- 7.4.4. Vietnam
- 7.4.5. Indonesia
- 7.4.6. Philippines
- 7.4.7. Rest of ASEAN
- 7.1. Market Analysis, Insights and Forecast - by Service
- 8. Thailand ASEAN Chemical Logistics Market Analysis, Insights and Forecast, 2020-2032
- 8.1. Market Analysis, Insights and Forecast - by Service
- 8.1.1. Transportation
- 8.1.2. Warehous
- 8.1.3. Consulting & Management Services
- 8.1.4. Customs & Security
- 8.1.5. Green Logistics
- 8.1.6. Others
- 8.2. Market Analysis, Insights and Forecast - by Mode of Transportation
- 8.2.1. Roadways
- 8.2.2. Railways
- 8.2.3. Airways
- 8.2.4. Waterways
- 8.2.5. Pipelines
- 8.3. Market Analysis, Insights and Forecast - by End User
- 8.3.1. Pharmaceutical Industry
- 8.3.2. Specialty Chemical Industry
- 8.3.3. Oil and Gas Industry
- 8.3.4. Cosmetic Industry
- 8.3.5. Others
- 8.4. Market Analysis, Insights and Forecast - by Geography
- 8.4.1. Singapore
- 8.4.2. Thailand
- 8.4.3. Malaysia
- 8.4.4. Vietnam
- 8.4.5. Indonesia
- 8.4.6. Philippines
- 8.4.7. Rest of ASEAN
- 8.1. Market Analysis, Insights and Forecast - by Service
- 9. Malaysia ASEAN Chemical Logistics Market Analysis, Insights and Forecast, 2020-2032
- 9.1. Market Analysis, Insights and Forecast - by Service
- 9.1.1. Transportation
- 9.1.2. Warehous
- 9.1.3. Consulting & Management Services
- 9.1.4. Customs & Security
- 9.1.5. Green Logistics
- 9.1.6. Others
- 9.2. Market Analysis, Insights and Forecast - by Mode of Transportation
- 9.2.1. Roadways
- 9.2.2. Railways
- 9.2.3. Airways
- 9.2.4. Waterways
- 9.2.5. Pipelines
- 9.3. Market Analysis, Insights and Forecast - by End User
- 9.3.1. Pharmaceutical Industry
- 9.3.2. Specialty Chemical Industry
- 9.3.3. Oil and Gas Industry
- 9.3.4. Cosmetic Industry
- 9.3.5. Others
- 9.4. Market Analysis, Insights and Forecast - by Geography
- 9.4.1. Singapore
- 9.4.2. Thailand
- 9.4.3. Malaysia
- 9.4.4. Vietnam
- 9.4.5. Indonesia
- 9.4.6. Philippines
- 9.4.7. Rest of ASEAN
- 9.1. Market Analysis, Insights and Forecast - by Service
- 10. Vietnam ASEAN Chemical Logistics Market Analysis, Insights and Forecast, 2020-2032
- 10.1. Market Analysis, Insights and Forecast - by Service
- 10.1.1. Transportation
- 10.1.2. Warehous
- 10.1.3. Consulting & Management Services
- 10.1.4. Customs & Security
- 10.1.5. Green Logistics
- 10.1.6. Others
- 10.2. Market Analysis, Insights and Forecast - by Mode of Transportation
- 10.2.1. Roadways
- 10.2.2. Railways
- 10.2.3. Airways
- 10.2.4. Waterways
- 10.2.5. Pipelines
- 10.3. Market Analysis, Insights and Forecast - by End User
- 10.3.1. Pharmaceutical Industry
- 10.3.2. Specialty Chemical Industry
- 10.3.3. Oil and Gas Industry
- 10.3.4. Cosmetic Industry
- 10.3.5. Others
- 10.4. Market Analysis, Insights and Forecast - by Geography
- 10.4.1. Singapore
- 10.4.2. Thailand
- 10.4.3. Malaysia
- 10.4.4. Vietnam
- 10.4.5. Indonesia
- 10.4.6. Philippines
- 10.4.7. Rest of ASEAN
- 10.1. Market Analysis, Insights and Forecast - by Service
- 11. Indonesia ASEAN Chemical Logistics Market Analysis, Insights and Forecast, 2020-2032
- 11.1. Market Analysis, Insights and Forecast - by Service
- 11.1.1. Transportation
- 11.1.2. Warehous
- 11.1.3. Consulting & Management Services
- 11.1.4. Customs & Security
- 11.1.5. Green Logistics
- 11.1.6. Others
- 11.2. Market Analysis, Insights and Forecast - by Mode of Transportation
- 11.2.1. Roadways
- 11.2.2. Railways
- 11.2.3. Airways
- 11.2.4. Waterways
- 11.2.5. Pipelines
- 11.3. Market Analysis, Insights and Forecast - by End User
- 11.3.1. Pharmaceutical Industry
- 11.3.2. Specialty Chemical Industry
- 11.3.3. Oil and Gas Industry
- 11.3.4. Cosmetic Industry
- 11.3.5. Others
- 11.4. Market Analysis, Insights and Forecast - by Geography
- 11.4.1. Singapore
- 11.4.2. Thailand
- 11.4.3. Malaysia
- 11.4.4. Vietnam
- 11.4.5. Indonesia
- 11.4.6. Philippines
- 11.4.7. Rest of ASEAN
- 11.1. Market Analysis, Insights and Forecast - by Service
- 12. Philippines ASEAN Chemical Logistics Market Analysis, Insights and Forecast, 2020-2032
- 12.1. Market Analysis, Insights and Forecast - by Service
- 12.1.1. Transportation
- 12.1.2. Warehous
- 12.1.3. Consulting & Management Services
- 12.1.4. Customs & Security
- 12.1.5. Green Logistics
- 12.1.6. Others
- 12.2. Market Analysis, Insights and Forecast - by Mode of Transportation
- 12.2.1. Roadways
- 12.2.2. Railways
- 12.2.3. Airways
- 12.2.4. Waterways
- 12.2.5. Pipelines
- 12.3. Market Analysis, Insights and Forecast - by End User
- 12.3.1. Pharmaceutical Industry
- 12.3.2. Specialty Chemical Industry
- 12.3.3. Oil and Gas Industry
- 12.3.4. Cosmetic Industry
- 12.3.5. Others
- 12.4. Market Analysis, Insights and Forecast - by Geography
- 12.4.1. Singapore
- 12.4.2. Thailand
- 12.4.3. Malaysia
- 12.4.4. Vietnam
- 12.4.5. Indonesia
- 12.4.6. Philippines
- 12.4.7. Rest of ASEAN
- 12.1. Market Analysis, Insights and Forecast - by Service
- 13. Rest of ASEAN ASEAN Chemical Logistics Market Analysis, Insights and Forecast, 2020-2032
- 13.1. Market Analysis, Insights and Forecast - by Service
- 13.1.1. Transportation
- 13.1.2. Warehous
- 13.1.3. Consulting & Management Services
- 13.1.4. Customs & Security
- 13.1.5. Green Logistics
- 13.1.6. Others
- 13.2. Market Analysis, Insights and Forecast - by Mode of Transportation
- 13.2.1. Roadways
- 13.2.2. Railways
- 13.2.3. Airways
- 13.2.4. Waterways
- 13.2.5. Pipelines
- 13.3. Market Analysis, Insights and Forecast - by End User
- 13.3.1. Pharmaceutical Industry
- 13.3.2. Specialty Chemical Industry
- 13.3.3. Oil and Gas Industry
- 13.3.4. Cosmetic Industry
- 13.3.5. Others
- 13.4. Market Analysis, Insights and Forecast - by Geography
- 13.4.1. Singapore
- 13.4.2. Thailand
- 13.4.3. Malaysia
- 13.4.4. Vietnam
- 13.4.5. Indonesia
- 13.4.6. Philippines
- 13.4.7. Rest of ASEAN
- 13.1. Market Analysis, Insights and Forecast - by Service
- 14. Competitive Analysis
- 14.1. Company Profiles
- 14.1.1 DHL
- 14.1.1.1. Company Overview
- 14.1.1.2. Products
- 14.1.1.3. Company Financials
- 14.1.1.4. SWOT Analysis
- 14.1.2 A&R Logistics
- 14.1.2.1. Company Overview
- 14.1.2.2. Products
- 14.1.2.3. Company Financials
- 14.1.2.4. SWOT Analysis
- 14.1.3 JWD InfoLogistics Public Company Limited
- 14.1.3.1. Company Overview
- 14.1.3.2. Products
- 14.1.3.3. Company Financials
- 14.1.3.4. SWOT Analysis
- 14.1.4 Alps Logistics**List Not Exhaustive
- 14.1.4.1. Company Overview
- 14.1.4.2. Products
- 14.1.4.3. Company Financials
- 14.1.4.4. SWOT Analysis
- 14.1.5 CEVA Logistics
- 14.1.5.1. Company Overview
- 14.1.5.2. Products
- 14.1.5.3. Company Financials
- 14.1.5.4. SWOT Analysis
- 14.1.6 Agility Logistics
- 14.1.6.1. Company Overview
- 14.1.6.2. Products
- 14.1.6.3. Company Financials
- 14.1.6.4. SWOT Analysis
- 14.1.7 CT Logistics
- 14.1.7.1. Company Overview
- 14.1.7.2. Products
- 14.1.7.3. Company Financials
- 14.1.7.4. SWOT Analysis
- 14.1.8 Tiong Nam Logistics Holdings BhD
- 14.1.8.1. Company Overview
- 14.1.8.2. Products
- 14.1.8.3. Company Financials
- 14.1.8.4. SWOT Analysis
- 14.1.9 Eagles Air & Sea
- 14.1.9.1. Company Overview
- 14.1.9.2. Products
- 14.1.9.3. Company Financials
- 14.1.9.4. SWOT Analysis
- 14.1.10 BDP International
- 14.1.10.1. Company Overview
- 14.1.10.2. Products
- 14.1.10.3. Company Financials
- 14.1.10.4. SWOT Analysis
- 14.1.11 Rinchem
- 14.1.11.1. Company Overview
- 14.1.11.2. Products
- 14.1.11.3. Company Financials
- 14.1.11.4. SWOT Analysis
- 14.1.12 Rhenus Logistics
- 14.1.12.1. Company Overview
- 14.1.12.2. Products
- 14.1.12.3. Company Financials
- 14.1.12.4. SWOT Analysis
- 14.1.1 DHL
- 14.2. Market Entropy
- 14.2.1 Company's Key Areas Served
- 14.2.2 Recent Developments
- 14.3. Company Market Share Analysis 2025
- 14.3.1 Top 5 Companies Market Share Analysis
- 14.3.2 Top 3 Companies Market Share Analysis
- 14.4. List of Potential Customers
- 15. Research Methodology
List of Figures
- Figure 1: Global ASEAN Chemical Logistics Market Revenue Breakdown (billion, %) by Region 2025 & 2033
- Figure 2: Singapore ASEAN Chemical Logistics Market Revenue (billion), by Service 2025 & 2033
- Figure 3: Singapore ASEAN Chemical Logistics Market Revenue Share (%), by Service 2025 & 2033
- Figure 4: Singapore ASEAN Chemical Logistics Market Revenue (billion), by Mode of Transportation 2025 & 2033
- Figure 5: Singapore ASEAN Chemical Logistics Market Revenue Share (%), by Mode of Transportation 2025 & 2033
- Figure 6: Singapore ASEAN Chemical Logistics Market Revenue (billion), by End User 2025 & 2033
- Figure 7: Singapore ASEAN Chemical Logistics Market Revenue Share (%), by End User 2025 & 2033
- Figure 8: Singapore ASEAN Chemical Logistics Market Revenue (billion), by Geography 2025 & 2033
- Figure 9: Singapore ASEAN Chemical Logistics Market Revenue Share (%), by Geography 2025 & 2033
- Figure 10: Singapore ASEAN Chemical Logistics Market Revenue (billion), by Country 2025 & 2033
- Figure 11: Singapore ASEAN Chemical Logistics Market Revenue Share (%), by Country 2025 & 2033
- Figure 12: Thailand ASEAN Chemical Logistics Market Revenue (billion), by Service 2025 & 2033
- Figure 13: Thailand ASEAN Chemical Logistics Market Revenue Share (%), by Service 2025 & 2033
- Figure 14: Thailand ASEAN Chemical Logistics Market Revenue (billion), by Mode of Transportation 2025 & 2033
- Figure 15: Thailand ASEAN Chemical Logistics Market Revenue Share (%), by Mode of Transportation 2025 & 2033
- Figure 16: Thailand ASEAN Chemical Logistics Market Revenue (billion), by End User 2025 & 2033
- Figure 17: Thailand ASEAN Chemical Logistics Market Revenue Share (%), by End User 2025 & 2033
- Figure 18: Thailand ASEAN Chemical Logistics Market Revenue (billion), by Geography 2025 & 2033
- Figure 19: Thailand ASEAN Chemical Logistics Market Revenue Share (%), by Geography 2025 & 2033
- Figure 20: Thailand ASEAN Chemical Logistics Market Revenue (billion), by Country 2025 & 2033
- Figure 21: Thailand ASEAN Chemical Logistics Market Revenue Share (%), by Country 2025 & 2033
- Figure 22: Malaysia ASEAN Chemical Logistics Market Revenue (billion), by Service 2025 & 2033
- Figure 23: Malaysia ASEAN Chemical Logistics Market Revenue Share (%), by Service 2025 & 2033
- Figure 24: Malaysia ASEAN Chemical Logistics Market Revenue (billion), by Mode of Transportation 2025 & 2033
- Figure 25: Malaysia ASEAN Chemical Logistics Market Revenue Share (%), by Mode of Transportation 2025 & 2033
- Figure 26: Malaysia ASEAN Chemical Logistics Market Revenue (billion), by End User 2025 & 2033
- Figure 27: Malaysia ASEAN Chemical Logistics Market Revenue Share (%), by End User 2025 & 2033
- Figure 28: Malaysia ASEAN Chemical Logistics Market Revenue (billion), by Geography 2025 & 2033
- Figure 29: Malaysia ASEAN Chemical Logistics Market Revenue Share (%), by Geography 2025 & 2033
- Figure 30: Malaysia ASEAN Chemical Logistics Market Revenue (billion), by Country 2025 & 2033
- Figure 31: Malaysia ASEAN Chemical Logistics Market Revenue Share (%), by Country 2025 & 2033
- Figure 32: Vietnam ASEAN Chemical Logistics Market Revenue (billion), by Service 2025 & 2033
- Figure 33: Vietnam ASEAN Chemical Logistics Market Revenue Share (%), by Service 2025 & 2033
- Figure 34: Vietnam ASEAN Chemical Logistics Market Revenue (billion), by Mode of Transportation 2025 & 2033
- Figure 35: Vietnam ASEAN Chemical Logistics Market Revenue Share (%), by Mode of Transportation 2025 & 2033
- Figure 36: Vietnam ASEAN Chemical Logistics Market Revenue (billion), by End User 2025 & 2033
- Figure 37: Vietnam ASEAN Chemical Logistics Market Revenue Share (%), by End User 2025 & 2033
- Figure 38: Vietnam ASEAN Chemical Logistics Market Revenue (billion), by Geography 2025 & 2033
- Figure 39: Vietnam ASEAN Chemical Logistics Market Revenue Share (%), by Geography 2025 & 2033
- Figure 40: Vietnam ASEAN Chemical Logistics Market Revenue (billion), by Country 2025 & 2033
- Figure 41: Vietnam ASEAN Chemical Logistics Market Revenue Share (%), by Country 2025 & 2033
- Figure 42: Indonesia ASEAN Chemical Logistics Market Revenue (billion), by Service 2025 & 2033
- Figure 43: Indonesia ASEAN Chemical Logistics Market Revenue Share (%), by Service 2025 & 2033
- Figure 44: Indonesia ASEAN Chemical Logistics Market Revenue (billion), by Mode of Transportation 2025 & 2033
- Figure 45: Indonesia ASEAN Chemical Logistics Market Revenue Share (%), by Mode of Transportation 2025 & 2033
- Figure 46: Indonesia ASEAN Chemical Logistics Market Revenue (billion), by End User 2025 & 2033
- Figure 47: Indonesia ASEAN Chemical Logistics Market Revenue Share (%), by End User 2025 & 2033
- Figure 48: Indonesia ASEAN Chemical Logistics Market Revenue (billion), by Geography 2025 & 2033
- Figure 49: Indonesia ASEAN Chemical Logistics Market Revenue Share (%), by Geography 2025 & 2033
- Figure 50: Indonesia ASEAN Chemical Logistics Market Revenue (billion), by Country 2025 & 2033
- Figure 51: Indonesia ASEAN Chemical Logistics Market Revenue Share (%), by Country 2025 & 2033
- Figure 52: Philippines ASEAN Chemical Logistics Market Revenue (billion), by Service 2025 & 2033
- Figure 53: Philippines ASEAN Chemical Logistics Market Revenue Share (%), by Service 2025 & 2033
- Figure 54: Philippines ASEAN Chemical Logistics Market Revenue (billion), by Mode of Transportation 2025 & 2033
- Figure 55: Philippines ASEAN Chemical Logistics Market Revenue Share (%), by Mode of Transportation 2025 & 2033
- Figure 56: Philippines ASEAN Chemical Logistics Market Revenue (billion), by End User 2025 & 2033
- Figure 57: Philippines ASEAN Chemical Logistics Market Revenue Share (%), by End User 2025 & 2033
- Figure 58: Philippines ASEAN Chemical Logistics Market Revenue (billion), by Geography 2025 & 2033
- Figure 59: Philippines ASEAN Chemical Logistics Market Revenue Share (%), by Geography 2025 & 2033
- Figure 60: Philippines ASEAN Chemical Logistics Market Revenue (billion), by Country 2025 & 2033
- Figure 61: Philippines ASEAN Chemical Logistics Market Revenue Share (%), by Country 2025 & 2033
- Figure 62: Rest of ASEAN ASEAN Chemical Logistics Market Revenue (billion), by Service 2025 & 2033
- Figure 63: Rest of ASEAN ASEAN Chemical Logistics Market Revenue Share (%), by Service 2025 & 2033
- Figure 64: Rest of ASEAN ASEAN Chemical Logistics Market Revenue (billion), by Mode of Transportation 2025 & 2033
- Figure 65: Rest of ASEAN ASEAN Chemical Logistics Market Revenue Share (%), by Mode of Transportation 2025 & 2033
- Figure 66: Rest of ASEAN ASEAN Chemical Logistics Market Revenue (billion), by End User 2025 & 2033
- Figure 67: Rest of ASEAN ASEAN Chemical Logistics Market Revenue Share (%), by End User 2025 & 2033
- Figure 68: Rest of ASEAN ASEAN Chemical Logistics Market Revenue (billion), by Geography 2025 & 2033
- Figure 69: Rest of ASEAN ASEAN Chemical Logistics Market Revenue Share (%), by Geography 2025 & 2033
- Figure 70: Rest of ASEAN ASEAN Chemical Logistics Market Revenue (billion), by Country 2025 & 2033
- Figure 71: Rest of ASEAN ASEAN Chemical Logistics Market Revenue Share (%), by Country 2025 & 2033
List of Tables
- Table 1: Global ASEAN Chemical Logistics Market Revenue billion Forecast, by Service 2020 & 2033
- Table 2: Global ASEAN Chemical Logistics Market Revenue billion Forecast, by Mode of Transportation 2020 & 2033
- Table 3: Global ASEAN Chemical Logistics Market Revenue billion Forecast, by End User 2020 & 2033
- Table 4: Global ASEAN Chemical Logistics Market Revenue billion Forecast, by Geography 2020 & 2033
- Table 5: Global ASEAN Chemical Logistics Market Revenue billion Forecast, by Region 2020 & 2033
- Table 6: Global ASEAN Chemical Logistics Market Revenue billion Forecast, by Service 2020 & 2033
- Table 7: Global ASEAN Chemical Logistics Market Revenue billion Forecast, by Mode of Transportation 2020 & 2033
- Table 8: Global ASEAN Chemical Logistics Market Revenue billion Forecast, by End User 2020 & 2033
- Table 9: Global ASEAN Chemical Logistics Market Revenue billion Forecast, by Geography 2020 & 2033
- Table 10: Global ASEAN Chemical Logistics Market Revenue billion Forecast, by Country 2020 & 2033
- Table 11: Global ASEAN Chemical Logistics Market Revenue billion Forecast, by Service 2020 & 2033
- Table 12: Global ASEAN Chemical Logistics Market Revenue billion Forecast, by Mode of Transportation 2020 & 2033
- Table 13: Global ASEAN Chemical Logistics Market Revenue billion Forecast, by End User 2020 & 2033
- Table 14: Global ASEAN Chemical Logistics Market Revenue billion Forecast, by Geography 2020 & 2033
- Table 15: Global ASEAN Chemical Logistics Market Revenue billion Forecast, by Country 2020 & 2033
- Table 16: Global ASEAN Chemical Logistics Market Revenue billion Forecast, by Service 2020 & 2033
- Table 17: Global ASEAN Chemical Logistics Market Revenue billion Forecast, by Mode of Transportation 2020 & 2033
- Table 18: Global ASEAN Chemical Logistics Market Revenue billion Forecast, by End User 2020 & 2033
- Table 19: Global ASEAN Chemical Logistics Market Revenue billion Forecast, by Geography 2020 & 2033
- Table 20: Global ASEAN Chemical Logistics Market Revenue billion Forecast, by Country 2020 & 2033
- Table 21: Global ASEAN Chemical Logistics Market Revenue billion Forecast, by Service 2020 & 2033
- Table 22: Global ASEAN Chemical Logistics Market Revenue billion Forecast, by Mode of Transportation 2020 & 2033
- Table 23: Global ASEAN Chemical Logistics Market Revenue billion Forecast, by End User 2020 & 2033
- Table 24: Global ASEAN Chemical Logistics Market Revenue billion Forecast, by Geography 2020 & 2033
- Table 25: Global ASEAN Chemical Logistics Market Revenue billion Forecast, by Country 2020 & 2033
- Table 26: Global ASEAN Chemical Logistics Market Revenue billion Forecast, by Service 2020 & 2033
- Table 27: Global ASEAN Chemical Logistics Market Revenue billion Forecast, by Mode of Transportation 2020 & 2033
- Table 28: Global ASEAN Chemical Logistics Market Revenue billion Forecast, by End User 2020 & 2033
- Table 29: Global ASEAN Chemical Logistics Market Revenue billion Forecast, by Geography 2020 & 2033
- Table 30: Global ASEAN Chemical Logistics Market Revenue billion Forecast, by Country 2020 & 2033
- Table 31: Global ASEAN Chemical Logistics Market Revenue billion Forecast, by Service 2020 & 2033
- Table 32: Global ASEAN Chemical Logistics Market Revenue billion Forecast, by Mode of Transportation 2020 & 2033
- Table 33: Global ASEAN Chemical Logistics Market Revenue billion Forecast, by End User 2020 & 2033
- Table 34: Global ASEAN Chemical Logistics Market Revenue billion Forecast, by Geography 2020 & 2033
- Table 35: Global ASEAN Chemical Logistics Market Revenue billion Forecast, by Country 2020 & 2033
- Table 36: Global ASEAN Chemical Logistics Market Revenue billion Forecast, by Service 2020 & 2033
- Table 37: Global ASEAN Chemical Logistics Market Revenue billion Forecast, by Mode of Transportation 2020 & 2033
- Table 38: Global ASEAN Chemical Logistics Market Revenue billion Forecast, by End User 2020 & 2033
- Table 39: Global ASEAN Chemical Logistics Market Revenue billion Forecast, by Geography 2020 & 2033
- Table 40: Global ASEAN Chemical Logistics Market Revenue billion Forecast, by Country 2020 & 2033
Frequently Asked Questions
1. What is the projected Compound Annual Growth Rate (CAGR) of the ASEAN Chemical Logistics Market?
The projected CAGR is approximately 9.53%.
2. Which companies are prominent players in the ASEAN Chemical Logistics Market?
Key companies in the market include DHL, A&R Logistics, JWD InfoLogistics Public Company Limited, Alps Logistics**List Not Exhaustive, CEVA Logistics, Agility Logistics, CT Logistics, Tiong Nam Logistics Holdings BhD, Eagles Air & Sea, BDP International, Rinchem, Rhenus Logistics.
3. What are the main segments of the ASEAN Chemical Logistics Market?
The market segments include Service, Mode of Transportation, End User, Geography.
4. Can you provide details about the market size?
The market size is estimated to be USD 47.53 billion as of 2022.
5. What are some drivers contributing to market growth?
The Rise in Demand for Specialty Chemicals in ASEAN Countries Increasing Trade Logistics Activity; Partnerships and Collaborations Between Major Players in the Chemical Logistics Market are Being Formed for the Creation of Innovative Goods and Technologically Enhanced Services.
6. What are the notable trends driving market growth?
The Rise in Chemical Production is Expected to Propel the Growth of the Chemical Logistics Market.
7. Are there any restraints impacting market growth?
Complexities Related to Chemical Logistics; High Cost Involved in the Transportation of Chemicals.
8. Can you provide examples of recent developments in the market?
October 2022: Rinchem is nearing the completion of a brand-new chemical warehouse based in Malaysia slated to be ready in Q2 of 2023. While the company currently has two other warehouses in the Asia Pacific (Taiwan & South Korea), this will be Rinchem's first warehouse located in Malaysia. The 45,000 sq. ft. dangerous goods warehouse will have the capacity to store 3100 pallet positions. Rinchem's warehouses are custom-built to support the proper segregation of various hazard classes and to offer multiple temperature zones.
9. What pricing options are available for accessing the report?
Pricing options include single-user, multi-user, and enterprise licenses priced at USD 4750, USD 5250, and USD 8750 respectively.
10. Is the market size provided in terms of value or volume?
The market size is provided in terms of value, measured in billion.
11. Are there any specific market keywords associated with the report?
Yes, the market keyword associated with the report is "ASEAN Chemical Logistics Market," which aids in identifying and referencing the specific market segment covered.
12. How do I determine which pricing option suits my needs best?
The pricing options vary based on user requirements and access needs. Individual users may opt for single-user licenses, while businesses requiring broader access may choose multi-user or enterprise licenses for cost-effective access to the report.
13. Are there any additional resources or data provided in the ASEAN Chemical Logistics Market report?
While the report offers comprehensive insights, it's advisable to review the specific contents or supplementary materials provided to ascertain if additional resources or data are available.
14. How can I stay updated on further developments or reports in the ASEAN Chemical Logistics Market?
To stay informed about further developments, trends, and reports in the ASEAN Chemical Logistics Market, consider subscribing to industry newsletters, following relevant companies and organizations, or regularly checking reputable industry news sources and publications.
Methodology
Step 1 - Identification of Relevant Samples Size from Population Database


Step 2 - Approaches for Defining Global Market Size (Value, Volume* & Price*)

Note*: In applicable scenarios
Step 3 - Data Sources
Primary Research
- Web Analytics
- Survey Reports
- Research Institute
- Latest Research Reports
- Opinion Leaders
Secondary Research
- Annual Reports
- White Paper
- Latest Press Release
- Industry Association
- Paid Database
- Investor Presentations

Step 4 - Data Triangulation
Involves using different sources of information in order to increase the validity of a study
These sources are likely to be stakeholders in a program - participants, other researchers, program staff, other community members, and so on.
Then we put all data in single framework & apply various statistical tools to find out the dynamic on the market.
During the analysis stage, feedback from the stakeholder groups would be compared to determine areas of agreement as well as areas of divergence