
Key Insights
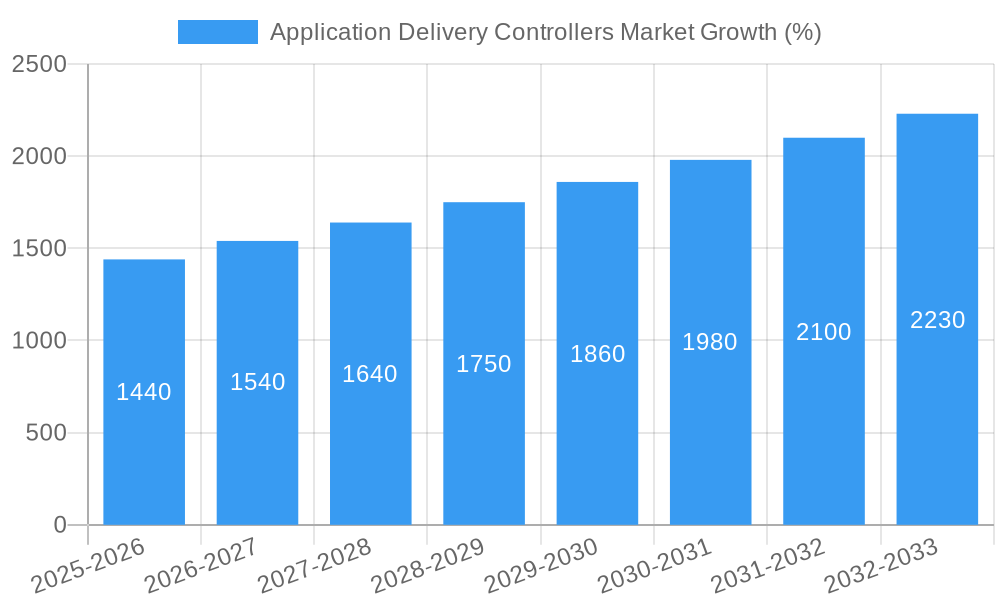
The Application Delivery Controller (ADC) market is experiencing robust growth, driven by the increasing adoption of cloud computing, the rise of digital transformation initiatives across various industries, and the need for enhanced application performance and security. The market's Compound Annual Growth Rate (CAGR) of 9.63% from 2019-2024 indicates significant expansion, projected to continue into the forecast period (2025-2033). Key drivers include the surge in mobile and internet usage, the proliferation of microservices architectures, and the escalating demand for secure and reliable application delivery across diverse platforms. The cloud deployment segment dominates the market due to its scalability, cost-effectiveness, and ease of management, while large enterprises are the major consumers owing to their complex application environments and heightened security needs. The BFSI (Banking, Financial Services, and Insurance) sector leads in adoption, followed by retail and IT & Telecom, reflecting the critical need for secure and high-performing applications in these sectors. However, factors such as the high initial investment for ADCs and the complexity associated with their implementation act as restraints on market growth. Nevertheless, the ongoing expansion of digital ecosystems and the increasing focus on optimizing application delivery are expected to offset these limitations, ensuring continued market expansion in the coming years. The competitive landscape is characterized by both established players and emerging vendors, leading to innovation and competitive pricing, further fueling market growth. Geographic distribution showcases strong performance in North America and Europe, with Asia-Pacific demonstrating rapid growth potential owing to its expanding digital infrastructure and rising adoption of cloud services. Overall, the ADC market presents a compelling opportunity for businesses focused on providing advanced application delivery solutions.
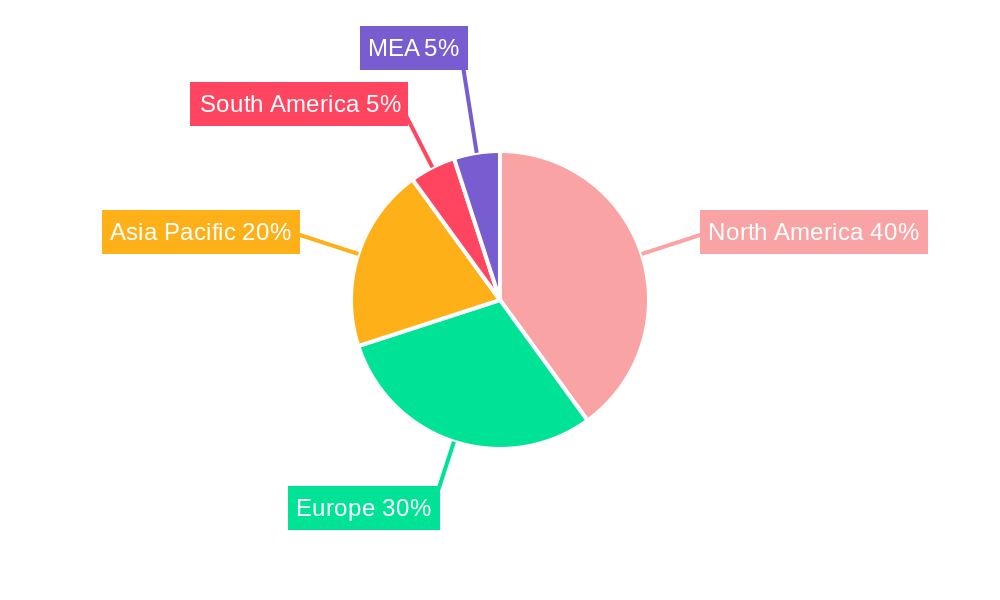
The market's segmentation by deployment (cloud vs. on-premise), enterprise size (SMEs vs. large enterprises), and end-user vertical (BFSI, retail, IT & Telecom, healthcare, etc.) provides a granular understanding of market dynamics. Analysis of regional data indicates that North America currently holds the largest market share, attributed to early adoption of cloud technologies and a well-established digital infrastructure. However, Asia-Pacific is poised for significant growth due to increasing digitalization across various sectors and government initiatives promoting digital transformation. Europe also represents a substantial market, driven by the adoption of cloud services and robust digital economies. The competitive landscape features a mix of established vendors offering comprehensive solutions and smaller, niche players focusing on specific market segments. This competitive dynamic fosters innovation, resulting in enhanced product offerings and competitive pricing, thereby benefiting end-users. Continued advancements in ADC technologies, such as AI-powered optimization and advanced security features, are expected to further drive market expansion.
Application Delivery Controllers Market: A Comprehensive Report (2019-2033)
This detailed report provides a comprehensive analysis of the Application Delivery Controllers (ADC) market, offering actionable insights for businesses and investors. Covering the period from 2019 to 2033, with a focus on 2025, this study examines market dynamics, competitive landscapes, and future growth potential. The report segments the market by deployment (cloud, on-premise), enterprise size (SMEs, large enterprises), and end-user vertical (BFSI, retail, IT and telecom, healthcare, others), providing granular data for informed decision-making. The total market size is estimated at xx Million in 2025 and is projected to reach xx Million by 2033, exhibiting a CAGR of xx%.
Application Delivery Controllers Market Market Structure & Competitive Dynamics
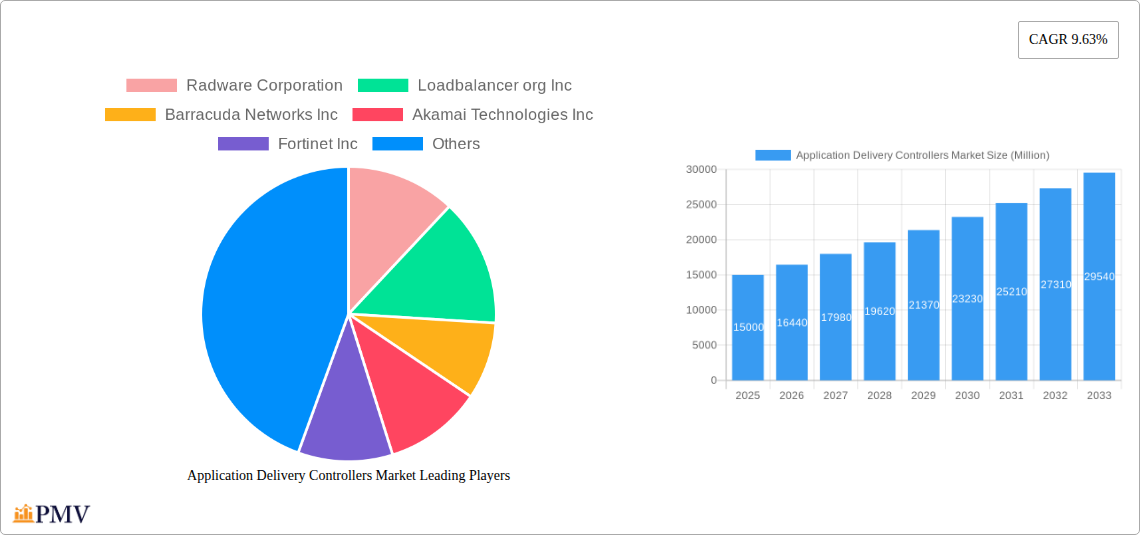
The Application Delivery Controllers market is characterized by a moderately concentrated structure, with a few major players holding significant market share. Radware Corporation, F5 Networks Inc, Juniper Networks Inc, and Citrix Systems Inc are among the leading vendors, each leveraging its unique strengths to compete. The market exhibits a dynamic innovation ecosystem, driven by ongoing technological advancements such as AI and automation, impacting ADC features and functionalities. Regulatory frameworks, particularly around data privacy and security, influence market practices and product development. Product substitutes, such as cloud-based load balancing services, exert competitive pressure. Furthermore, end-user trends toward cloud adoption and digital transformation fuel market expansion. M&A activities, although not extremely frequent, have shaped the market landscape, with deal values ranging from xx Million to xx Million in recent years. For instance, the acquisition of Company X by Company Y in 2022 resulted in a xx% increase in Company Y’s market share. Key metrics like market share and M&A deal values are included in this report to offer a clear understanding of competitive dynamics.
Application Delivery Controllers Market Industry Trends & Insights
The Application Delivery Controllers market is experiencing significant growth, driven by several factors. The increasing adoption of cloud computing, the surge in mobile and internet traffic, and the growing demand for enhanced application security and performance are primary growth drivers. The market exhibits a notable shift toward cloud-based ADC deployments, reflecting the broader industry trend towards cloud adoption. Technological disruptions, such as the integration of AI and machine learning into ADC solutions, are enhancing functionalities and improving operational efficiency. Consumer preferences are increasingly focused on seamless application experiences, driving demand for high-performing and secure ADC solutions. Competitive dynamics are characterized by innovation, strategic partnerships, and mergers & acquisitions, all contributing to market evolution. The global Application Delivery Controllers market is expected to witness substantial growth, with a projected CAGR of xx% during the forecast period (2025-2033). Market penetration is expected to increase significantly in developing economies. This report provides detailed insights into these trends, quantified through CAGR and market penetration data.
Dominant Markets & Segments in Application Delivery Controllers Market
Leading Region/Country: North America currently holds a dominant position in the ADC market, driven by high cloud adoption rates, robust IT infrastructure, and the presence of major technology players. Europe follows closely, with significant growth expected in the Asia-Pacific region.
By Deployment: The cloud deployment segment is experiencing rapid growth, exceeding the on-premise segment due to its scalability, cost-effectiveness, and ease of management.
By Enterprise Size: Large enterprises currently dominate the market due to their significant IT investments and complex application requirements. However, the SME segment is expected to witness substantial growth in the coming years due to increasing digitalization efforts.
By End-user Vertical: The BFSI sector is a key adopter of ADCs, driven by stringent security requirements and high transaction volumes. The IT and Telecom sector also holds significant market share, while retail and healthcare industries are growing rapidly due to increasing online transactions and the need for robust healthcare applications. Other end-user verticals also demonstrate significant growth potential due to increased digital adoption.
The dominance of North America in this market can be attributed to several factors, including a strong emphasis on technological innovation and a mature IT infrastructure. Government policies promoting digital transformation and favorable economic conditions also contribute to market growth. Economic policies, particularly in the Asia-Pacific region, are actively supporting the growth of the ADC market by encouraging the adoption of cloud technology and digital infrastructure development.
Application Delivery Controllers Market Product Innovations
Recent product innovations in the Application Delivery Controllers market are focused on enhancing security, improving performance, and simplifying management. Advanced features like AI-powered automation, enhanced security protocols, and streamlined integration with cloud platforms are becoming increasingly prevalent. These innovations address the growing need for secure, scalable, and efficient application delivery in today's dynamic digital landscape. The market is witnessing the integration of advanced security features, like DDoS protection and application-level security, into ADC solutions, improving their market fit. The trend is towards software-defined ADCs (SD-ADC) that offer greater flexibility and scalability compared to traditional hardware-based solutions.
Report Segmentation & Scope
This report provides a comprehensive segmentation of the Application Delivery Controllers market across various key parameters:
By Deployment: The cloud segment is projected to witness a significant CAGR of xx% during the forecast period, driven by the increasing preference for cloud-based infrastructure. The on-premise segment, while mature, will continue to grow at a slower pace, driven by existing enterprise systems. Competitive dynamics within each segment are shaped by specific vendor offerings and pricing strategies.
By Enterprise Size: The Large Enterprises segment dominates the current market, yet the SME segment is projected to experience significant growth driven by increased digitalization.
By End-user Vertical: The BFSI sector demonstrates sustained demand for highly secure and reliable ADC solutions, leading this segment. Other sectors, including retail, IT and Telecom, healthcare, and others, also exhibit strong growth potential due to varied industry-specific application needs and diverse digital transformations.
Key Drivers of Application Delivery Controllers Market Growth
Several key factors drive the growth of the Application Delivery Controllers market. The proliferation of cloud computing necessitates robust application delivery solutions, fueling market expansion. The increasing demand for enhanced application security and performance, coupled with the growth of mobile and internet traffic, further necessitates the use of ADCs. Government regulations and initiatives promoting digital transformation and cybersecurity in various sectors also significantly contribute to market growth. The rising adoption of DevOps and CI/CD methodologies necessitates efficient application delivery mechanisms, driving demand for ADCs.
Challenges in the Application Delivery Controllers Market Sector
The Application Delivery Controllers market faces several challenges. The complexity of integrating ADCs with existing infrastructure can hinder adoption, particularly in legacy systems. The need for skilled personnel to manage and maintain ADC solutions can also pose a challenge. Additionally, the increasing prevalence of sophisticated cyber threats demands ongoing investment in security enhancements, representing a significant cost factor. Furthermore, maintaining compatibility with diverse application environments and adapting to evolving technological trends poses additional challenges. These factors might slightly restrain the market's growth rate in certain segments.
Leading Players in the Application Delivery Controllers Market Market
- Radware Corporation
- Loadbalancer.org Inc
- Barracuda Networks Inc
- Akamai Technologies Inc
- Fortinet Inc
- F5 Networks Inc
- Piolink Inc
- Juniper Networks Inc
- Kemp Technologies Inc
- A10 Networks Inc
- Array Networks Inc
- Sangfor Technologies Inc
- Citrix Systems Inc
- HAProxy Technologies LLC
Key Developments in Application Delivery Controllers Market Sector
June 2023: Fortinet announced 11 new MSSPs adopting Fortinet Secure SD-WAN, expanding its reach and strengthening its position in the market. This signifies a move towards integrated security solutions for application delivery.
February 2023: Juniper Networks' collaboration with IBM to integrate network automation capabilities with Juniper's RAN optimization technology will enhance the efficiency and scalability of network infrastructure, impacting ADC deployment and management strategies. This collaboration indicates the increasing importance of automation and AI in the ADC market.
Strategic Application Delivery Controllers Market Market Outlook
The Application Delivery Controllers market presents significant growth opportunities. The continued adoption of cloud computing, coupled with increasing demand for secure and high-performing applications, will drive market expansion. Strategic partnerships, acquisitions, and the development of innovative solutions will shape the competitive landscape. The focus on AI-powered automation and enhanced security features will further enhance the functionality and market appeal of ADC solutions. Companies that can successfully adapt to emerging technological trends and address the evolving security needs of enterprises will capture significant market share. The overall outlook for the Application Delivery Controllers market is positive, with substantial growth potential in the coming years.
Application Delivery Controllers Market Segmentation
-
1. Deployment
- 1.1. Cloud
- 1.2. On-premise
-
2. Enterprise Size
- 2.1. Small and Medium Enterprises (SMEs)
- 2.2. Large Enterprises
-
3. End-user Vertical
- 3.1. BFSI
- 3.2. Retail
- 3.3. IT and Telecom
- 3.4. Healthcare
- 3.5. Other End-user Verticals
Application Delivery Controllers Market Segmentation By Geography
- 1. North America
- 2. Europe
- 3. Asia Pacific
- 4. Rest of the World
Application Delivery Controllers Market REPORT HIGHLIGHTS
| Aspects | Details |
|---|---|
| Study Period | 2019-2033 |
| Base Year | 2024 |
| Estimated Year | 2025 |
| Forecast Period | 2025-2033 |
| Historical Period | 2019-2024 |
| Growth Rate | CAGR of 9.63% from 2019-2033 |
| Segmentation |
|
Table of Contents
- 1. Introduction
- 1.1. Research Scope
- 1.2. Market Segmentation
- 1.3. Research Methodology
- 1.4. Definitions and Assumptions
- 2. Executive Summary
- 2.1. Introduction
- 3. Market Dynamics
- 3.1. Introduction
- 3.2. Market Drivers
- 3.2.1. Rising Demand for Reliable Application Performance; Increasing Cyberattacks
- 3.3. Market Restrains
- 3.3.1. Increasing Network Complexity; Management Challenges and Higher Costs of ADCs
- 3.4. Market Trends
- 3.4.1. BFSI By End-user Vertical Segment is Expected to Hold Significant Market Share
- 4. Market Factor Analysis
- 4.1. Porters Five Forces
- 4.2. Supply/Value Chain
- 4.3. PESTEL analysis
- 4.4. Market Entropy
- 4.5. Patent/Trademark Analysis
- 5. Global Application Delivery Controllers Market Analysis, Insights and Forecast, 2019-2031
- 5.1. Market Analysis, Insights and Forecast - by Deployment
- 5.1.1. Cloud
- 5.1.2. On-premise
- 5.2. Market Analysis, Insights and Forecast - by Enterprise Size
- 5.2.1. Small and Medium Enterprises (SMEs)
- 5.2.2. Large Enterprises
- 5.3. Market Analysis, Insights and Forecast - by End-user Vertical
- 5.3.1. BFSI
- 5.3.2. Retail
- 5.3.3. IT and Telecom
- 5.3.4. Healthcare
- 5.3.5. Other End-user Verticals
- 5.4. Market Analysis, Insights and Forecast - by Region
- 5.4.1. North America
- 5.4.2. Europe
- 5.4.3. Asia Pacific
- 5.4.4. Rest of the World
- 5.1. Market Analysis, Insights and Forecast - by Deployment
- 6. North America Application Delivery Controllers Market Analysis, Insights and Forecast, 2019-2031
- 6.1. Market Analysis, Insights and Forecast - by Deployment
- 6.1.1. Cloud
- 6.1.2. On-premise
- 6.2. Market Analysis, Insights and Forecast - by Enterprise Size
- 6.2.1. Small and Medium Enterprises (SMEs)
- 6.2.2. Large Enterprises
- 6.3. Market Analysis, Insights and Forecast - by End-user Vertical
- 6.3.1. BFSI
- 6.3.2. Retail
- 6.3.3. IT and Telecom
- 6.3.4. Healthcare
- 6.3.5. Other End-user Verticals
- 6.1. Market Analysis, Insights and Forecast - by Deployment
- 7. Europe Application Delivery Controllers Market Analysis, Insights and Forecast, 2019-2031
- 7.1. Market Analysis, Insights and Forecast - by Deployment
- 7.1.1. Cloud
- 7.1.2. On-premise
- 7.2. Market Analysis, Insights and Forecast - by Enterprise Size
- 7.2.1. Small and Medium Enterprises (SMEs)
- 7.2.2. Large Enterprises
- 7.3. Market Analysis, Insights and Forecast - by End-user Vertical
- 7.3.1. BFSI
- 7.3.2. Retail
- 7.3.3. IT and Telecom
- 7.3.4. Healthcare
- 7.3.5. Other End-user Verticals
- 7.1. Market Analysis, Insights and Forecast - by Deployment
- 8. Asia Pacific Application Delivery Controllers Market Analysis, Insights and Forecast, 2019-2031
- 8.1. Market Analysis, Insights and Forecast - by Deployment
- 8.1.1. Cloud
- 8.1.2. On-premise
- 8.2. Market Analysis, Insights and Forecast - by Enterprise Size
- 8.2.1. Small and Medium Enterprises (SMEs)
- 8.2.2. Large Enterprises
- 8.3. Market Analysis, Insights and Forecast - by End-user Vertical
- 8.3.1. BFSI
- 8.3.2. Retail
- 8.3.3. IT and Telecom
- 8.3.4. Healthcare
- 8.3.5. Other End-user Verticals
- 8.1. Market Analysis, Insights and Forecast - by Deployment
- 9. Rest of the World Application Delivery Controllers Market Analysis, Insights and Forecast, 2019-2031
- 9.1. Market Analysis, Insights and Forecast - by Deployment
- 9.1.1. Cloud
- 9.1.2. On-premise
- 9.2. Market Analysis, Insights and Forecast - by Enterprise Size
- 9.2.1. Small and Medium Enterprises (SMEs)
- 9.2.2. Large Enterprises
- 9.3. Market Analysis, Insights and Forecast - by End-user Vertical
- 9.3.1. BFSI
- 9.3.2. Retail
- 9.3.3. IT and Telecom
- 9.3.4. Healthcare
- 9.3.5. Other End-user Verticals
- 9.1. Market Analysis, Insights and Forecast - by Deployment
- 10. North America Application Delivery Controllers Market Analysis, Insights and Forecast, 2019-2031
- 10.1. Market Analysis, Insights and Forecast - By Country/Sub-region
- 10.1.1 United States
- 10.1.2 Canada
- 10.1.3 Mexico
- 11. Europe Application Delivery Controllers Market Analysis, Insights and Forecast, 2019-2031
- 11.1. Market Analysis, Insights and Forecast - By Country/Sub-region
- 11.1.1 Germany
- 11.1.2 United Kingdom
- 11.1.3 France
- 11.1.4 Spain
- 11.1.5 Italy
- 11.1.6 Spain
- 11.1.7 Belgium
- 11.1.8 Netherland
- 11.1.9 Nordics
- 11.1.10 Rest of Europe
- 12. Asia Pacific Application Delivery Controllers Market Analysis, Insights and Forecast, 2019-2031
- 12.1. Market Analysis, Insights and Forecast - By Country/Sub-region
- 12.1.1 China
- 12.1.2 Japan
- 12.1.3 India
- 12.1.4 South Korea
- 12.1.5 Southeast Asia
- 12.1.6 Australia
- 12.1.7 Indonesia
- 12.1.8 Phillipes
- 12.1.9 Singapore
- 12.1.10 Thailandc
- 12.1.11 Rest of Asia Pacific
- 13. South America Application Delivery Controllers Market Analysis, Insights and Forecast, 2019-2031
- 13.1. Market Analysis, Insights and Forecast - By Country/Sub-region
- 13.1.1 Brazil
- 13.1.2 Argentina
- 13.1.3 Peru
- 13.1.4 Chile
- 13.1.5 Colombia
- 13.1.6 Ecuador
- 13.1.7 Venezuela
- 13.1.8 Rest of South America
- 14. North America Application Delivery Controllers Market Analysis, Insights and Forecast, 2019-2031
- 14.1. Market Analysis, Insights and Forecast - By Country/Sub-region
- 14.1.1 United States
- 14.1.2 Canada
- 14.1.3 Mexico
- 15. MEA Application Delivery Controllers Market Analysis, Insights and Forecast, 2019-2031
- 15.1. Market Analysis, Insights and Forecast - By Country/Sub-region
- 15.1.1 United Arab Emirates
- 15.1.2 Saudi Arabia
- 15.1.3 South Africa
- 15.1.4 Rest of Middle East and Africa
- 16. Competitive Analysis
- 16.1. Global Market Share Analysis 2024
- 16.2. Company Profiles
- 16.2.1 Radware Corporation
- 16.2.1.1. Overview
- 16.2.1.2. Products
- 16.2.1.3. SWOT Analysis
- 16.2.1.4. Recent Developments
- 16.2.1.5. Financials (Based on Availability)
- 16.2.2 Loadbalancer org Inc
- 16.2.2.1. Overview
- 16.2.2.2. Products
- 16.2.2.3. SWOT Analysis
- 16.2.2.4. Recent Developments
- 16.2.2.5. Financials (Based on Availability)
- 16.2.3 Barracuda Networks Inc
- 16.2.3.1. Overview
- 16.2.3.2. Products
- 16.2.3.3. SWOT Analysis
- 16.2.3.4. Recent Developments
- 16.2.3.5. Financials (Based on Availability)
- 16.2.4 Akamai Technologies Inc
- 16.2.4.1. Overview
- 16.2.4.2. Products
- 16.2.4.3. SWOT Analysis
- 16.2.4.4. Recent Developments
- 16.2.4.5. Financials (Based on Availability)
- 16.2.5 Fortinet Inc
- 16.2.5.1. Overview
- 16.2.5.2. Products
- 16.2.5.3. SWOT Analysis
- 16.2.5.4. Recent Developments
- 16.2.5.5. Financials (Based on Availability)
- 16.2.6 F5 Networks Inc
- 16.2.6.1. Overview
- 16.2.6.2. Products
- 16.2.6.3. SWOT Analysis
- 16.2.6.4. Recent Developments
- 16.2.6.5. Financials (Based on Availability)
- 16.2.7 Piolink Inc
- 16.2.7.1. Overview
- 16.2.7.2. Products
- 16.2.7.3. SWOT Analysis
- 16.2.7.4. Recent Developments
- 16.2.7.5. Financials (Based on Availability)
- 16.2.8 Juniper Networks Inc
- 16.2.8.1. Overview
- 16.2.8.2. Products
- 16.2.8.3. SWOT Analysis
- 16.2.8.4. Recent Developments
- 16.2.8.5. Financials (Based on Availability)
- 16.2.9 Kemp Technologies Inc
- 16.2.9.1. Overview
- 16.2.9.2. Products
- 16.2.9.3. SWOT Analysis
- 16.2.9.4. Recent Developments
- 16.2.9.5. Financials (Based on Availability)
- 16.2.10 A10 Networks Inc
- 16.2.10.1. Overview
- 16.2.10.2. Products
- 16.2.10.3. SWOT Analysis
- 16.2.10.4. Recent Developments
- 16.2.10.5. Financials (Based on Availability)
- 16.2.11 Array Networks Inc
- 16.2.11.1. Overview
- 16.2.11.2. Products
- 16.2.11.3. SWOT Analysis
- 16.2.11.4. Recent Developments
- 16.2.11.5. Financials (Based on Availability)
- 16.2.12 Sangfor Technologies Inc
- 16.2.12.1. Overview
- 16.2.12.2. Products
- 16.2.12.3. SWOT Analysis
- 16.2.12.4. Recent Developments
- 16.2.12.5. Financials (Based on Availability)
- 16.2.13 Citrix Systems Inc
- 16.2.13.1. Overview
- 16.2.13.2. Products
- 16.2.13.3. SWOT Analysis
- 16.2.13.4. Recent Developments
- 16.2.13.5. Financials (Based on Availability)
- 16.2.14 HAProxy Technologies LLC
- 16.2.14.1. Overview
- 16.2.14.2. Products
- 16.2.14.3. SWOT Analysis
- 16.2.14.4. Recent Developments
- 16.2.14.5. Financials (Based on Availability)
- 16.2.1 Radware Corporation
List of Figures
- Figure 1: Global Application Delivery Controllers Market Revenue Breakdown (Million, %) by Region 2024 & 2032
- Figure 2: North America Application Delivery Controllers Market Revenue (Million), by Country 2024 & 2032
- Figure 3: North America Application Delivery Controllers Market Revenue Share (%), by Country 2024 & 2032
- Figure 4: Europe Application Delivery Controllers Market Revenue (Million), by Country 2024 & 2032
- Figure 5: Europe Application Delivery Controllers Market Revenue Share (%), by Country 2024 & 2032
- Figure 6: Asia Pacific Application Delivery Controllers Market Revenue (Million), by Country 2024 & 2032
- Figure 7: Asia Pacific Application Delivery Controllers Market Revenue Share (%), by Country 2024 & 2032
- Figure 8: South America Application Delivery Controllers Market Revenue (Million), by Country 2024 & 2032
- Figure 9: South America Application Delivery Controllers Market Revenue Share (%), by Country 2024 & 2032
- Figure 10: North America Application Delivery Controllers Market Revenue (Million), by Country 2024 & 2032
- Figure 11: North America Application Delivery Controllers Market Revenue Share (%), by Country 2024 & 2032
- Figure 12: MEA Application Delivery Controllers Market Revenue (Million), by Country 2024 & 2032
- Figure 13: MEA Application Delivery Controllers Market Revenue Share (%), by Country 2024 & 2032
- Figure 14: North America Application Delivery Controllers Market Revenue (Million), by Deployment 2024 & 2032
- Figure 15: North America Application Delivery Controllers Market Revenue Share (%), by Deployment 2024 & 2032
- Figure 16: North America Application Delivery Controllers Market Revenue (Million), by Enterprise Size 2024 & 2032
- Figure 17: North America Application Delivery Controllers Market Revenue Share (%), by Enterprise Size 2024 & 2032
- Figure 18: North America Application Delivery Controllers Market Revenue (Million), by End-user Vertical 2024 & 2032
- Figure 19: North America Application Delivery Controllers Market Revenue Share (%), by End-user Vertical 2024 & 2032
- Figure 20: North America Application Delivery Controllers Market Revenue (Million), by Country 2024 & 2032
- Figure 21: North America Application Delivery Controllers Market Revenue Share (%), by Country 2024 & 2032
- Figure 22: Europe Application Delivery Controllers Market Revenue (Million), by Deployment 2024 & 2032
- Figure 23: Europe Application Delivery Controllers Market Revenue Share (%), by Deployment 2024 & 2032
- Figure 24: Europe Application Delivery Controllers Market Revenue (Million), by Enterprise Size 2024 & 2032
- Figure 25: Europe Application Delivery Controllers Market Revenue Share (%), by Enterprise Size 2024 & 2032
- Figure 26: Europe Application Delivery Controllers Market Revenue (Million), by End-user Vertical 2024 & 2032
- Figure 27: Europe Application Delivery Controllers Market Revenue Share (%), by End-user Vertical 2024 & 2032
- Figure 28: Europe Application Delivery Controllers Market Revenue (Million), by Country 2024 & 2032
- Figure 29: Europe Application Delivery Controllers Market Revenue Share (%), by Country 2024 & 2032
- Figure 30: Asia Pacific Application Delivery Controllers Market Revenue (Million), by Deployment 2024 & 2032
- Figure 31: Asia Pacific Application Delivery Controllers Market Revenue Share (%), by Deployment 2024 & 2032
- Figure 32: Asia Pacific Application Delivery Controllers Market Revenue (Million), by Enterprise Size 2024 & 2032
- Figure 33: Asia Pacific Application Delivery Controllers Market Revenue Share (%), by Enterprise Size 2024 & 2032
- Figure 34: Asia Pacific Application Delivery Controllers Market Revenue (Million), by End-user Vertical 2024 & 2032
- Figure 35: Asia Pacific Application Delivery Controllers Market Revenue Share (%), by End-user Vertical 2024 & 2032
- Figure 36: Asia Pacific Application Delivery Controllers Market Revenue (Million), by Country 2024 & 2032
- Figure 37: Asia Pacific Application Delivery Controllers Market Revenue Share (%), by Country 2024 & 2032
- Figure 38: Rest of the World Application Delivery Controllers Market Revenue (Million), by Deployment 2024 & 2032
- Figure 39: Rest of the World Application Delivery Controllers Market Revenue Share (%), by Deployment 2024 & 2032
- Figure 40: Rest of the World Application Delivery Controllers Market Revenue (Million), by Enterprise Size 2024 & 2032
- Figure 41: Rest of the World Application Delivery Controllers Market Revenue Share (%), by Enterprise Size 2024 & 2032
- Figure 42: Rest of the World Application Delivery Controllers Market Revenue (Million), by End-user Vertical 2024 & 2032
- Figure 43: Rest of the World Application Delivery Controllers Market Revenue Share (%), by End-user Vertical 2024 & 2032
- Figure 44: Rest of the World Application Delivery Controllers Market Revenue (Million), by Country 2024 & 2032
- Figure 45: Rest of the World Application Delivery Controllers Market Revenue Share (%), by Country 2024 & 2032
List of Tables
- Table 1: Global Application Delivery Controllers Market Revenue Million Forecast, by Region 2019 & 2032
- Table 2: Global Application Delivery Controllers Market Revenue Million Forecast, by Deployment 2019 & 2032
- Table 3: Global Application Delivery Controllers Market Revenue Million Forecast, by Enterprise Size 2019 & 2032
- Table 4: Global Application Delivery Controllers Market Revenue Million Forecast, by End-user Vertical 2019 & 2032
- Table 5: Global Application Delivery Controllers Market Revenue Million Forecast, by Region 2019 & 2032
- Table 6: Global Application Delivery Controllers Market Revenue Million Forecast, by Country 2019 & 2032
- Table 7: United States Application Delivery Controllers Market Revenue (Million) Forecast, by Application 2019 & 2032
- Table 8: Canada Application Delivery Controllers Market Revenue (Million) Forecast, by Application 2019 & 2032
- Table 9: Mexico Application Delivery Controllers Market Revenue (Million) Forecast, by Application 2019 & 2032
- Table 10: Global Application Delivery Controllers Market Revenue Million Forecast, by Country 2019 & 2032
- Table 11: Germany Application Delivery Controllers Market Revenue (Million) Forecast, by Application 2019 & 2032
- Table 12: United Kingdom Application Delivery Controllers Market Revenue (Million) Forecast, by Application 2019 & 2032
- Table 13: France Application Delivery Controllers Market Revenue (Million) Forecast, by Application 2019 & 2032
- Table 14: Spain Application Delivery Controllers Market Revenue (Million) Forecast, by Application 2019 & 2032
- Table 15: Italy Application Delivery Controllers Market Revenue (Million) Forecast, by Application 2019 & 2032
- Table 16: Spain Application Delivery Controllers Market Revenue (Million) Forecast, by Application 2019 & 2032
- Table 17: Belgium Application Delivery Controllers Market Revenue (Million) Forecast, by Application 2019 & 2032
- Table 18: Netherland Application Delivery Controllers Market Revenue (Million) Forecast, by Application 2019 & 2032
- Table 19: Nordics Application Delivery Controllers Market Revenue (Million) Forecast, by Application 2019 & 2032
- Table 20: Rest of Europe Application Delivery Controllers Market Revenue (Million) Forecast, by Application 2019 & 2032
- Table 21: Global Application Delivery Controllers Market Revenue Million Forecast, by Country 2019 & 2032
- Table 22: China Application Delivery Controllers Market Revenue (Million) Forecast, by Application 2019 & 2032
- Table 23: Japan Application Delivery Controllers Market Revenue (Million) Forecast, by Application 2019 & 2032
- Table 24: India Application Delivery Controllers Market Revenue (Million) Forecast, by Application 2019 & 2032
- Table 25: South Korea Application Delivery Controllers Market Revenue (Million) Forecast, by Application 2019 & 2032
- Table 26: Southeast Asia Application Delivery Controllers Market Revenue (Million) Forecast, by Application 2019 & 2032
- Table 27: Australia Application Delivery Controllers Market Revenue (Million) Forecast, by Application 2019 & 2032
- Table 28: Indonesia Application Delivery Controllers Market Revenue (Million) Forecast, by Application 2019 & 2032
- Table 29: Phillipes Application Delivery Controllers Market Revenue (Million) Forecast, by Application 2019 & 2032
- Table 30: Singapore Application Delivery Controllers Market Revenue (Million) Forecast, by Application 2019 & 2032
- Table 31: Thailandc Application Delivery Controllers Market Revenue (Million) Forecast, by Application 2019 & 2032
- Table 32: Rest of Asia Pacific Application Delivery Controllers Market Revenue (Million) Forecast, by Application 2019 & 2032
- Table 33: Global Application Delivery Controllers Market Revenue Million Forecast, by Country 2019 & 2032
- Table 34: Brazil Application Delivery Controllers Market Revenue (Million) Forecast, by Application 2019 & 2032
- Table 35: Argentina Application Delivery Controllers Market Revenue (Million) Forecast, by Application 2019 & 2032
- Table 36: Peru Application Delivery Controllers Market Revenue (Million) Forecast, by Application 2019 & 2032
- Table 37: Chile Application Delivery Controllers Market Revenue (Million) Forecast, by Application 2019 & 2032
- Table 38: Colombia Application Delivery Controllers Market Revenue (Million) Forecast, by Application 2019 & 2032
- Table 39: Ecuador Application Delivery Controllers Market Revenue (Million) Forecast, by Application 2019 & 2032
- Table 40: Venezuela Application Delivery Controllers Market Revenue (Million) Forecast, by Application 2019 & 2032
- Table 41: Rest of South America Application Delivery Controllers Market Revenue (Million) Forecast, by Application 2019 & 2032
- Table 42: Global Application Delivery Controllers Market Revenue Million Forecast, by Country 2019 & 2032
- Table 43: United States Application Delivery Controllers Market Revenue (Million) Forecast, by Application 2019 & 2032
- Table 44: Canada Application Delivery Controllers Market Revenue (Million) Forecast, by Application 2019 & 2032
- Table 45: Mexico Application Delivery Controllers Market Revenue (Million) Forecast, by Application 2019 & 2032
- Table 46: Global Application Delivery Controllers Market Revenue Million Forecast, by Country 2019 & 2032
- Table 47: United Arab Emirates Application Delivery Controllers Market Revenue (Million) Forecast, by Application 2019 & 2032
- Table 48: Saudi Arabia Application Delivery Controllers Market Revenue (Million) Forecast, by Application 2019 & 2032
- Table 49: South Africa Application Delivery Controllers Market Revenue (Million) Forecast, by Application 2019 & 2032
- Table 50: Rest of Middle East and Africa Application Delivery Controllers Market Revenue (Million) Forecast, by Application 2019 & 2032
- Table 51: Global Application Delivery Controllers Market Revenue Million Forecast, by Deployment 2019 & 2032
- Table 52: Global Application Delivery Controllers Market Revenue Million Forecast, by Enterprise Size 2019 & 2032
- Table 53: Global Application Delivery Controllers Market Revenue Million Forecast, by End-user Vertical 2019 & 2032
- Table 54: Global Application Delivery Controllers Market Revenue Million Forecast, by Country 2019 & 2032
- Table 55: Global Application Delivery Controllers Market Revenue Million Forecast, by Deployment 2019 & 2032
- Table 56: Global Application Delivery Controllers Market Revenue Million Forecast, by Enterprise Size 2019 & 2032
- Table 57: Global Application Delivery Controllers Market Revenue Million Forecast, by End-user Vertical 2019 & 2032
- Table 58: Global Application Delivery Controllers Market Revenue Million Forecast, by Country 2019 & 2032
- Table 59: Global Application Delivery Controllers Market Revenue Million Forecast, by Deployment 2019 & 2032
- Table 60: Global Application Delivery Controllers Market Revenue Million Forecast, by Enterprise Size 2019 & 2032
- Table 61: Global Application Delivery Controllers Market Revenue Million Forecast, by End-user Vertical 2019 & 2032
- Table 62: Global Application Delivery Controllers Market Revenue Million Forecast, by Country 2019 & 2032
- Table 63: Global Application Delivery Controllers Market Revenue Million Forecast, by Deployment 2019 & 2032
- Table 64: Global Application Delivery Controllers Market Revenue Million Forecast, by Enterprise Size 2019 & 2032
- Table 65: Global Application Delivery Controllers Market Revenue Million Forecast, by End-user Vertical 2019 & 2032
- Table 66: Global Application Delivery Controllers Market Revenue Million Forecast, by Country 2019 & 2032
Frequently Asked Questions
1. What is the projected Compound Annual Growth Rate (CAGR) of the Application Delivery Controllers Market?
The projected CAGR is approximately 9.63%.
2. Which companies are prominent players in the Application Delivery Controllers Market?
Key companies in the market include Radware Corporation, Loadbalancer org Inc, Barracuda Networks Inc, Akamai Technologies Inc, Fortinet Inc, F5 Networks Inc, Piolink Inc, Juniper Networks Inc, Kemp Technologies Inc, A10 Networks Inc, Array Networks Inc, Sangfor Technologies Inc, Citrix Systems Inc, HAProxy Technologies LLC.
3. What are the main segments of the Application Delivery Controllers Market?
The market segments include Deployment, Enterprise Size, End-user Vertical.
4. Can you provide details about the market size?
The market size is estimated to be USD XX Million as of 2022.
5. What are some drivers contributing to market growth?
Rising Demand for Reliable Application Performance; Increasing Cyberattacks.
6. What are the notable trends driving market growth?
BFSI By End-user Vertical Segment is Expected to Hold Significant Market Share.
7. Are there any restraints impacting market growth?
Increasing Network Complexity; Management Challenges and Higher Costs of ADCs.
8. Can you provide examples of recent developments in the market?
June 2023: Fortinet, one of the global cybersecurity leaders driving the convergence of networking and security, announced that 11 new managed security service providers (MSSPs) have adopted Fortinet Secure SD-WAN to assist business outcomes and customer experiences. Kyndryl; 11:11 Systems; Claro Empresas; Globe Business; InfiniVAN, Inc.; KT Corporation; Neurosoft S.A.; Sify Technologies; SPTel; solutions by STC; and Tata Teleservices join a growing list of service providers across the globe utilizing Fortinet Secure SD-WAN as the foundation for new and differentiated connectivity services without compromising on security.
9. What pricing options are available for accessing the report?
Pricing options include single-user, multi-user, and enterprise licenses priced at USD 4750, USD 5250, and USD 8750 respectively.
10. Is the market size provided in terms of value or volume?
The market size is provided in terms of value, measured in Million.
11. Are there any specific market keywords associated with the report?
Yes, the market keyword associated with the report is "Application Delivery Controllers Market," which aids in identifying and referencing the specific market segment covered.
12. How do I determine which pricing option suits my needs best?
The pricing options vary based on user requirements and access needs. Individual users may opt for single-user licenses, while businesses requiring broader access may choose multi-user or enterprise licenses for cost-effective access to the report.
13. Are there any additional resources or data provided in the Application Delivery Controllers Market report?
While the report offers comprehensive insights, it's advisable to review the specific contents or supplementary materials provided to ascertain if additional resources or data are available.
14. How can I stay updated on further developments or reports in the Application Delivery Controllers Market?
To stay informed about further developments, trends, and reports in the Application Delivery Controllers Market, consider subscribing to industry newsletters, following relevant companies and organizations, or regularly checking reputable industry news sources and publications.
Methodology
Step 1 - Identification of Relevant Samples Size from Population Database


Step 2 - Approaches for Defining Global Market Size (Value, Volume* & Price*)

Note*: In applicable scenarios
Step 3 - Data Sources
Primary Research
- Web Analytics
- Survey Reports
- Research Institute
- Latest Research Reports
- Opinion Leaders
Secondary Research
- Annual Reports
- White Paper
- Latest Press Release
- Industry Association
- Paid Database
- Investor Presentations

Step 4 - Data Triangulation
Involves using different sources of information in order to increase the validity of a study
These sources are likely to be stakeholders in a program - participants, other researchers, program staff, other community members, and so on.
Then we put all data in single framework & apply various statistical tools to find out the dynamic on the market.
During the analysis stage, feedback from the stakeholder groups would be compared to determine areas of agreement as well as areas of divergence


