
Key Insights
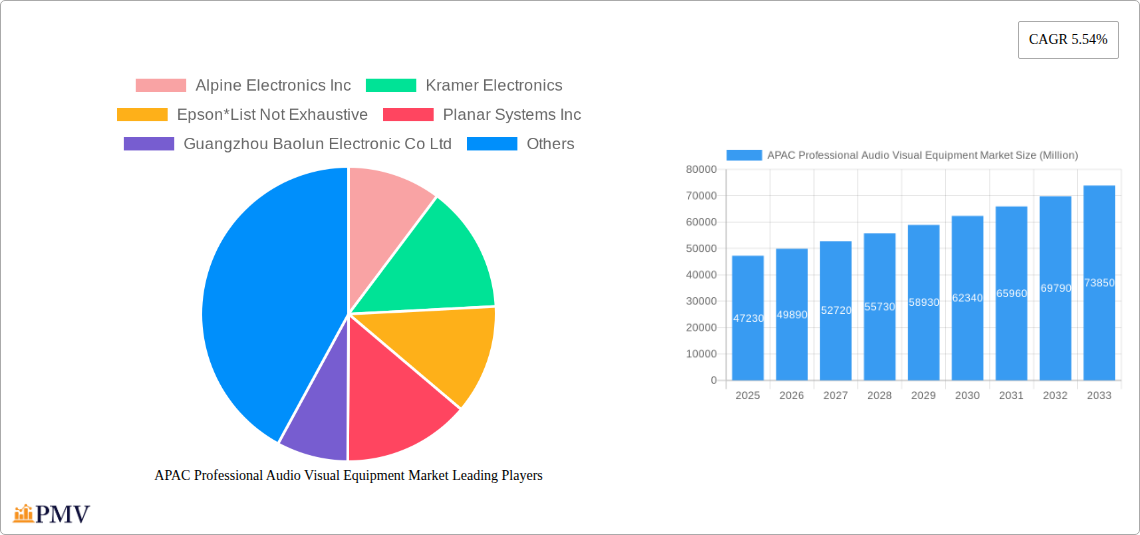
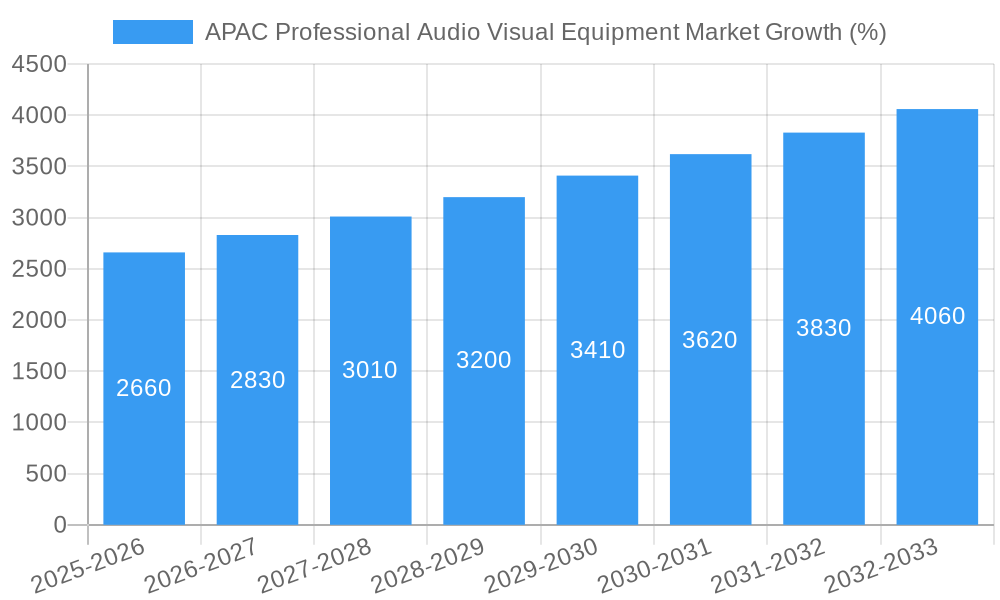
The Asia-Pacific (APAC) professional audio-visual (AV) equipment market, valued at $47.23 billion in 2025, is projected to experience robust growth, driven by increasing investments in corporate conferencing, educational institutions upgrading their facilities, and the burgeoning healthcare sector's adoption of advanced AV technologies. The market's Compound Annual Growth Rate (CAGR) of 5.54% from 2025 to 2033 indicates a substantial expansion, exceeding $75 billion by 2033. Key growth drivers include the rising demand for high-quality video conferencing solutions, the proliferation of smart classrooms and hybrid learning models, and the increasing adoption of digital signage and interactive displays in retail and hospitality venues. Significant market segments include capture and production equipment, video projection systems, streaming media solutions, and storage and distribution technologies, with China, Japan, India, and South Korea representing the largest national markets within the region. While the market faces challenges such as high initial investment costs for advanced technologies and potential supply chain disruptions, the overall trend points towards sustained growth fueled by technological advancements and increasing digitalization across various sectors.
The competitive landscape is characterized by a mix of established international players and regional manufacturers. Companies like Sony, Panasonic, and Epson compete alongside regional players, leading to innovation and competitive pricing. However, the market is expected to consolidate further as larger companies acquire smaller firms to expand their product portfolios and geographical reach. The continued focus on developing immersive and interactive AV experiences, driven by advancements in 4K and 8K resolution displays, virtual reality (VR), and augmented reality (AR) technologies, promises to further invigorate market expansion throughout the forecast period. The adoption of cloud-based AV solutions and the increasing integration of artificial intelligence (AI) are anticipated to be key factors in shaping the future of the APAC professional AV equipment market.
APAC Professional Audio Visual Equipment Market: A Comprehensive Report (2019-2033)
This detailed report provides a comprehensive analysis of the Asia-Pacific (APAC) professional audio-visual (Pro-AV) equipment market from 2019 to 2033. It covers market size, segmentation, competitive landscape, key trends, and future growth prospects. The report is essential for businesses, investors, and stakeholders seeking actionable insights into this dynamic market. The study period covers 2019-2033, with 2025 as the base and estimated year. The forecast period is 2025-2033, and the historical period is 2019-2024.
APAC Professional Audio Visual Equipment Market Market Structure & Competitive Dynamics
The APAC Pro-AV equipment market is characterized by a moderately concentrated structure with several multinational corporations and regional players competing intensely. Market share is dynamic, with established players like Sony Corporation and Panasonic Corporation facing competition from emerging Chinese companies like Guangzhou Baolun Electronic Co Ltd and Guangzhou DSPPA Audio Co Ltd. Innovation is driven by advancements in display technologies, 4K/8K resolution, and cloud-based AV solutions. Regulatory frameworks vary across countries, influencing product approvals and market access. Product substitution is a key factor, with digital signage gradually replacing traditional projection systems in certain sectors. End-user preferences are shifting towards integrated, user-friendly systems with seamless connectivity. M&A activity remains moderate, with deal values ranging from xx Million to xx Million in recent years.
- Market Concentration: Moderately concentrated, with top 5 players holding an estimated xx% market share in 2024.
- Innovation Ecosystems: Strong focus on 4K/8K, cloud-based solutions, and AI-powered features.
- Regulatory Frameworks: Vary significantly across countries, impacting market entry and product standards.
- Product Substitutes: Digital signage, software-defined AV systems posing challenges to traditional hardware.
- End-user Trends: Growing preference for integrated, user-friendly, and scalable systems.
- M&A Activity: Moderate activity observed, with deal values ranging from xx Million to xx Million.
APAC Professional Audio Visual Equipment Market Industry Trends & Insights
The APAC Pro-AV equipment market is experiencing robust growth driven by factors such as rising urbanization, increasing investments in infrastructure, particularly in education and corporate sectors, and the adoption of advanced technologies. The market witnessed a CAGR of xx% during 2019-2024 and is projected to grow at a CAGR of xx% during 2025-2033. Technological disruptions, such as the shift towards IP-based solutions and the integration of IoT, are reshaping the industry. Consumer preferences are trending towards high-resolution displays, immersive audio experiences, and user-friendly interfaces. The market penetration of cloud-based AV solutions is increasing rapidly, exceeding xx% in key markets like Japan and South Korea.
Dominant Markets & Segments in APAC Professional Audio Visual Equipment Market
China dominates the APAC Pro-AV equipment market, driven by robust economic growth, large-scale infrastructure projects, and a burgeoning entertainment industry. Japan and South Korea are other significant markets, characterized by high technological adoption rates and sophisticated consumer preferences. Among segments, the corporate sector is the largest end-user, followed by education and hospitality. Within product types, video projection and streaming media are the fastest-growing segments.
- Key Drivers for China: Rapid economic expansion, substantial infrastructure investments, growing entertainment industry.
- Key Drivers for Japan: High technological adoption, sophisticated consumer base, strong presence of technology giants.
- Key Drivers for South Korea: Advanced technological infrastructure, focus on innovation, dynamic corporate sector.
- Dominant Segment (End-user): Corporate sector due to rising demand for advanced collaboration tools and digital signage.
- Dominant Segment (Product Type): Video projection and streaming media.
APAC Professional Audio Visual Equipment Market Product Innovations
Recent product innovations include advancements in laser projection technology, offering increased brightness and longevity, along with the emergence of 8K resolution displays for enhanced visual clarity. The integration of AI-powered features, such as automated camera control and scene optimization, enhances user experience. Miniaturization and the development of compact, portable systems are gaining traction, particularly in the corporate and education sectors. These innovations align well with market demand for high-performance, user-friendly, and scalable AV solutions.
Report Segmentation & Scope
This report segments the APAC professional audio-visual equipment market by country (China, Japan, India, South Korea, Rest of Asia-Pacific), by type (Capture and Production Equipment, Video Projection, Streaming Media, Storage and Distribution, Others), and by end-user vertical (Corporate, Education, Healthcare, Hospitality, Venues and Events, Retail, Other End-user Verticals). Each segment's growth projections, market size, and competitive dynamics are analyzed comprehensively. Growth projections vary considerably across segments, with streaming media and digital signage witnessing the fastest growth. Competitive dynamics are influenced by factors such as brand reputation, technological capabilities, and pricing strategies.
Key Drivers of APAP Professional Audio Visual Equipment Market Growth
The market's growth is fueled by several factors:
- Technological advancements: Higher resolutions (8K), improved image quality, and smaller, more portable devices.
- Economic growth: Rising disposable incomes and increased investment in infrastructure across APAC.
- Government initiatives: Policies promoting digitalization and technological advancement in various sectors.
Challenges in the APAC Professional Audio Visual Equipment Market Sector
Several challenges hinder market growth:
- Supply chain disruptions: Global supply chain issues impacting component availability and costs.
- High initial investment costs: The initial cost of advanced AV systems can deter small businesses.
- Intense competition: The market is fragmented, with many players vying for market share. This leads to price wars and margin compression.
Leading Players in the APAC Professional Audio Visual Equipment Market Market
- Alpine Electronics Inc
- Kramer Electronics
- Epson
- Planar Systems Inc
- Guangzhou Baolun Electronic Co Ltd
- Elmo
- Guangzhou DSPPA Audio Co Ltd
- Vega Global
- Panasonic Corporation
- Sony Corporation
Key Developments in APAC Professional Audio Visual Equipment Market Sector
- June 2023: The Pro Integration Future Asia (PIFA) exhibition in Singapore fostered collaboration among industry associations across Southeast Asia, promoting market growth and education.
- October 2022: InfoComm Southeast Asia showcased innovative Pro-AV solutions, highlighting technological trends and influencing industry adoption.
Strategic APAC Professional Audio Visual Equipment Market Market Outlook
The APAC Pro-AV equipment market offers substantial growth potential, driven by continuous technological advancements, expanding infrastructure investments, and evolving consumer preferences. Strategic opportunities lie in focusing on niche segments, offering customized solutions, and leveraging the growth of cloud-based and IP-based technologies. Companies focusing on innovation, strategic partnerships, and efficient supply chains are well-positioned for success in this dynamic market.
APAC Professional Audio Visual Equipment Market Segmentation
-
1. Type (Qualitative Analysis)
- 1.1. Capture and Production Equipment
- 1.2. Video Projection
- 1.3. Streaming Media, Storage and Distribution
- 1.4. Others Types
-
2. End-User Vertical
- 2.1. Corporate
- 2.2. Education
- 2.3. Healthcare
- 2.4. Hospitality
- 2.5. Venues and Events
- 2.6. Retail
- 2.7. Other End-user Verticals
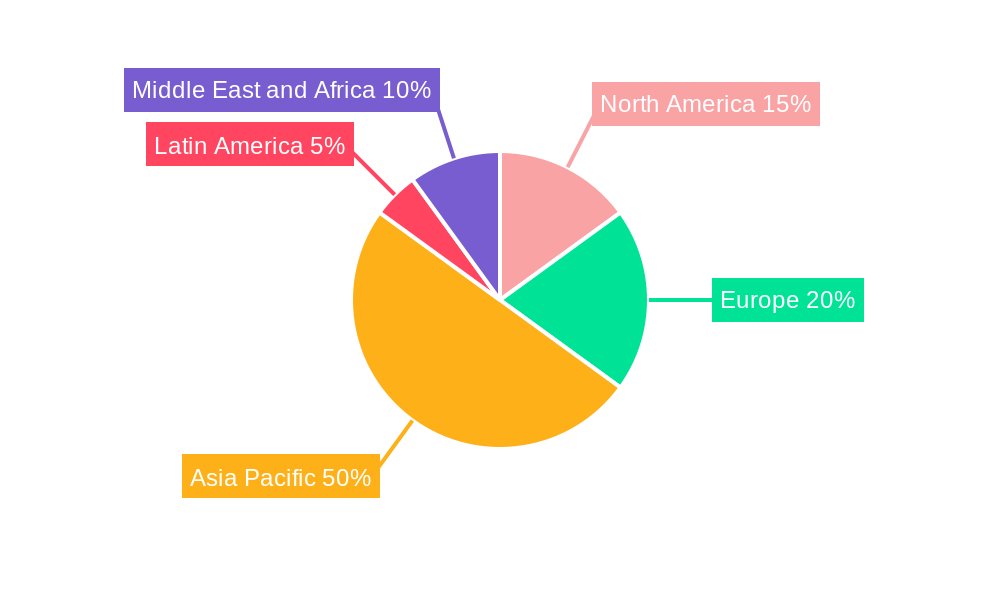
APAC Professional Audio Visual Equipment Market Segmentation By Geography
-
1. North America
- 1.1. United States
- 1.2. Canada
- 1.3. Mexico
-
2. South America
- 2.1. Brazil
- 2.2. Argentina
- 2.3. Rest of South America
-
3. Europe
- 3.1. United Kingdom
- 3.2. Germany
- 3.3. France
- 3.4. Italy
- 3.5. Spain
- 3.6. Russia
- 3.7. Benelux
- 3.8. Nordics
- 3.9. Rest of Europe
-
4. Middle East & Africa
- 4.1. Turkey
- 4.2. Israel
- 4.3. GCC
- 4.4. North Africa
- 4.5. South Africa
- 4.6. Rest of Middle East & Africa
-
5. Asia Pacific
- 5.1. China
- 5.2. India
- 5.3. Japan
- 5.4. South Korea
- 5.5. ASEAN
- 5.6. Oceania
- 5.7. Rest of Asia Pacific
APAC Professional Audio Visual Equipment Market REPORT HIGHLIGHTS
| Aspects | Details |
|---|---|
| Study Period | 2019-2033 |
| Base Year | 2024 |
| Estimated Year | 2025 |
| Forecast Period | 2025-2033 |
| Historical Period | 2019-2024 |
| Growth Rate | CAGR of 5.54% from 2019-2033 |
| Segmentation |
|
Table of Contents
- 1. Introduction
- 1.1. Research Scope
- 1.2. Market Segmentation
- 1.3. Research Methodology
- 1.4. Definitions and Assumptions
- 2. Executive Summary
- 2.1. Introduction
- 3. Market Dynamics
- 3.1. Introduction
- 3.2. Market Drivers
- 3.2.1. Rapid Adoption of Cloud Platforms
- 3.3. Market Restrains
- 3.3.1. High Operating and Legal Costs of Audio-Visual Systems
- 3.4. Market Trends
- 3.4.1. Retail is Analyzed to Witness Highest Growth Rate During the Forecast Period
- 4. Market Factor Analysis
- 4.1. Porters Five Forces
- 4.2. Supply/Value Chain
- 4.3. PESTEL analysis
- 4.4. Market Entropy
- 4.5. Patent/Trademark Analysis
- 5. Global APAC Professional Audio Visual Equipment Market Analysis, Insights and Forecast, 2019-2031
- 5.1. Market Analysis, Insights and Forecast - by Type (Qualitative Analysis)
- 5.1.1. Capture and Production Equipment
- 5.1.2. Video Projection
- 5.1.3. Streaming Media, Storage and Distribution
- 5.1.4. Others Types
- 5.2. Market Analysis, Insights and Forecast - by End-User Vertical
- 5.2.1. Corporate
- 5.2.2. Education
- 5.2.3. Healthcare
- 5.2.4. Hospitality
- 5.2.5. Venues and Events
- 5.2.6. Retail
- 5.2.7. Other End-user Verticals
- 5.3. Market Analysis, Insights and Forecast - by Region
- 5.3.1. North America
- 5.3.2. South America
- 5.3.3. Europe
- 5.3.4. Middle East & Africa
- 5.3.5. Asia Pacific
- 5.1. Market Analysis, Insights and Forecast - by Type (Qualitative Analysis)
- 6. North America APAC Professional Audio Visual Equipment Market Analysis, Insights and Forecast, 2019-2031
- 6.1. Market Analysis, Insights and Forecast - by Type (Qualitative Analysis)
- 6.1.1. Capture and Production Equipment
- 6.1.2. Video Projection
- 6.1.3. Streaming Media, Storage and Distribution
- 6.1.4. Others Types
- 6.2. Market Analysis, Insights and Forecast - by End-User Vertical
- 6.2.1. Corporate
- 6.2.2. Education
- 6.2.3. Healthcare
- 6.2.4. Hospitality
- 6.2.5. Venues and Events
- 6.2.6. Retail
- 6.2.7. Other End-user Verticals
- 6.1. Market Analysis, Insights and Forecast - by Type (Qualitative Analysis)
- 7. South America APAC Professional Audio Visual Equipment Market Analysis, Insights and Forecast, 2019-2031
- 7.1. Market Analysis, Insights and Forecast - by Type (Qualitative Analysis)
- 7.1.1. Capture and Production Equipment
- 7.1.2. Video Projection
- 7.1.3. Streaming Media, Storage and Distribution
- 7.1.4. Others Types
- 7.2. Market Analysis, Insights and Forecast - by End-User Vertical
- 7.2.1. Corporate
- 7.2.2. Education
- 7.2.3. Healthcare
- 7.2.4. Hospitality
- 7.2.5. Venues and Events
- 7.2.6. Retail
- 7.2.7. Other End-user Verticals
- 7.1. Market Analysis, Insights and Forecast - by Type (Qualitative Analysis)
- 8. Europe APAC Professional Audio Visual Equipment Market Analysis, Insights and Forecast, 2019-2031
- 8.1. Market Analysis, Insights and Forecast - by Type (Qualitative Analysis)
- 8.1.1. Capture and Production Equipment
- 8.1.2. Video Projection
- 8.1.3. Streaming Media, Storage and Distribution
- 8.1.4. Others Types
- 8.2. Market Analysis, Insights and Forecast - by End-User Vertical
- 8.2.1. Corporate
- 8.2.2. Education
- 8.2.3. Healthcare
- 8.2.4. Hospitality
- 8.2.5. Venues and Events
- 8.2.6. Retail
- 8.2.7. Other End-user Verticals
- 8.1. Market Analysis, Insights and Forecast - by Type (Qualitative Analysis)
- 9. Middle East & Africa APAC Professional Audio Visual Equipment Market Analysis, Insights and Forecast, 2019-2031
- 9.1. Market Analysis, Insights and Forecast - by Type (Qualitative Analysis)
- 9.1.1. Capture and Production Equipment
- 9.1.2. Video Projection
- 9.1.3. Streaming Media, Storage and Distribution
- 9.1.4. Others Types
- 9.2. Market Analysis, Insights and Forecast - by End-User Vertical
- 9.2.1. Corporate
- 9.2.2. Education
- 9.2.3. Healthcare
- 9.2.4. Hospitality
- 9.2.5. Venues and Events
- 9.2.6. Retail
- 9.2.7. Other End-user Verticals
- 9.1. Market Analysis, Insights and Forecast - by Type (Qualitative Analysis)
- 10. Asia Pacific APAC Professional Audio Visual Equipment Market Analysis, Insights and Forecast, 2019-2031
- 10.1. Market Analysis, Insights and Forecast - by Type (Qualitative Analysis)
- 10.1.1. Capture and Production Equipment
- 10.1.2. Video Projection
- 10.1.3. Streaming Media, Storage and Distribution
- 10.1.4. Others Types
- 10.2. Market Analysis, Insights and Forecast - by End-User Vertical
- 10.2.1. Corporate
- 10.2.2. Education
- 10.2.3. Healthcare
- 10.2.4. Hospitality
- 10.2.5. Venues and Events
- 10.2.6. Retail
- 10.2.7. Other End-user Verticals
- 10.1. Market Analysis, Insights and Forecast - by Type (Qualitative Analysis)
- 11. North America APAC Professional Audio Visual Equipment Market Analysis, Insights and Forecast, 2019-2031
- 11.1. Market Analysis, Insights and Forecast - By Country/Sub-region
- 11.1.1 United States
- 11.1.2 Canada
- 12. Europe APAC Professional Audio Visual Equipment Market Analysis, Insights and Forecast, 2019-2031
- 12.1. Market Analysis, Insights and Forecast - By Country/Sub-region
- 12.1.1 United Kingdom
- 12.1.2 Germany
- 12.1.3 France
- 12.1.4 Italy
- 12.1.5 Rest of Europe
- 13. Asia Pacific APAC Professional Audio Visual Equipment Market Analysis, Insights and Forecast, 2019-2031
- 13.1. Market Analysis, Insights and Forecast - By Country/Sub-region
- 13.1.1 China
- 13.1.2 Japan
- 13.1.3 India
- 13.1.4 South Korea
- 13.1.5 Rest of Asia Pacific
- 14. Latin America APAC Professional Audio Visual Equipment Market Analysis, Insights and Forecast, 2019-2031
- 14.1. Market Analysis, Insights and Forecast - By Country/Sub-region
- 14.1.1.
- 15. Middle East and Africa APAC Professional Audio Visual Equipment Market Analysis, Insights and Forecast, 2019-2031
- 15.1. Market Analysis, Insights and Forecast - By Country/Sub-region
- 15.1.1.
- 16. Competitive Analysis
- 16.1. Global Market Share Analysis 2024
- 16.2. Company Profiles
- 16.2.1 Alpine Electronics Inc
- 16.2.1.1. Overview
- 16.2.1.2. Products
- 16.2.1.3. SWOT Analysis
- 16.2.1.4. Recent Developments
- 16.2.1.5. Financials (Based on Availability)
- 16.2.2 Kramer Electronics
- 16.2.2.1. Overview
- 16.2.2.2. Products
- 16.2.2.3. SWOT Analysis
- 16.2.2.4. Recent Developments
- 16.2.2.5. Financials (Based on Availability)
- 16.2.3 Epson*List Not Exhaustive
- 16.2.3.1. Overview
- 16.2.3.2. Products
- 16.2.3.3. SWOT Analysis
- 16.2.3.4. Recent Developments
- 16.2.3.5. Financials (Based on Availability)
- 16.2.4 Planar Systems Inc
- 16.2.4.1. Overview
- 16.2.4.2. Products
- 16.2.4.3. SWOT Analysis
- 16.2.4.4. Recent Developments
- 16.2.4.5. Financials (Based on Availability)
- 16.2.5 Guangzhou Baolun Electronic Co Ltd
- 16.2.5.1. Overview
- 16.2.5.2. Products
- 16.2.5.3. SWOT Analysis
- 16.2.5.4. Recent Developments
- 16.2.5.5. Financials (Based on Availability)
- 16.2.6 Elmo
- 16.2.6.1. Overview
- 16.2.6.2. Products
- 16.2.6.3. SWOT Analysis
- 16.2.6.4. Recent Developments
- 16.2.6.5. Financials (Based on Availability)
- 16.2.7 Guangzhou DSPPA Audio Co Ltd
- 16.2.7.1. Overview
- 16.2.7.2. Products
- 16.2.7.3. SWOT Analysis
- 16.2.7.4. Recent Developments
- 16.2.7.5. Financials (Based on Availability)
- 16.2.8 Vega Global
- 16.2.8.1. Overview
- 16.2.8.2. Products
- 16.2.8.3. SWOT Analysis
- 16.2.8.4. Recent Developments
- 16.2.8.5. Financials (Based on Availability)
- 16.2.9 Panasonic Corporation
- 16.2.9.1. Overview
- 16.2.9.2. Products
- 16.2.9.3. SWOT Analysis
- 16.2.9.4. Recent Developments
- 16.2.9.5. Financials (Based on Availability)
- 16.2.10 Sony Corporation
- 16.2.10.1. Overview
- 16.2.10.2. Products
- 16.2.10.3. SWOT Analysis
- 16.2.10.4. Recent Developments
- 16.2.10.5. Financials (Based on Availability)
- 16.2.1 Alpine Electronics Inc
List of Figures
- Figure 1: Global APAC Professional Audio Visual Equipment Market Revenue Breakdown (Million, %) by Region 2024 & 2032
- Figure 2: North America APAC Professional Audio Visual Equipment Market Revenue (Million), by Country 2024 & 2032
- Figure 3: North America APAC Professional Audio Visual Equipment Market Revenue Share (%), by Country 2024 & 2032
- Figure 4: Europe APAC Professional Audio Visual Equipment Market Revenue (Million), by Country 2024 & 2032
- Figure 5: Europe APAC Professional Audio Visual Equipment Market Revenue Share (%), by Country 2024 & 2032
- Figure 6: Asia Pacific APAC Professional Audio Visual Equipment Market Revenue (Million), by Country 2024 & 2032
- Figure 7: Asia Pacific APAC Professional Audio Visual Equipment Market Revenue Share (%), by Country 2024 & 2032
- Figure 8: Latin America APAC Professional Audio Visual Equipment Market Revenue (Million), by Country 2024 & 2032
- Figure 9: Latin America APAC Professional Audio Visual Equipment Market Revenue Share (%), by Country 2024 & 2032
- Figure 10: Middle East and Africa APAC Professional Audio Visual Equipment Market Revenue (Million), by Country 2024 & 2032
- Figure 11: Middle East and Africa APAC Professional Audio Visual Equipment Market Revenue Share (%), by Country 2024 & 2032
- Figure 12: North America APAC Professional Audio Visual Equipment Market Revenue (Million), by Type (Qualitative Analysis) 2024 & 2032
- Figure 13: North America APAC Professional Audio Visual Equipment Market Revenue Share (%), by Type (Qualitative Analysis) 2024 & 2032
- Figure 14: North America APAC Professional Audio Visual Equipment Market Revenue (Million), by End-User Vertical 2024 & 2032
- Figure 15: North America APAC Professional Audio Visual Equipment Market Revenue Share (%), by End-User Vertical 2024 & 2032
- Figure 16: North America APAC Professional Audio Visual Equipment Market Revenue (Million), by Country 2024 & 2032
- Figure 17: North America APAC Professional Audio Visual Equipment Market Revenue Share (%), by Country 2024 & 2032
- Figure 18: South America APAC Professional Audio Visual Equipment Market Revenue (Million), by Type (Qualitative Analysis) 2024 & 2032
- Figure 19: South America APAC Professional Audio Visual Equipment Market Revenue Share (%), by Type (Qualitative Analysis) 2024 & 2032
- Figure 20: South America APAC Professional Audio Visual Equipment Market Revenue (Million), by End-User Vertical 2024 & 2032
- Figure 21: South America APAC Professional Audio Visual Equipment Market Revenue Share (%), by End-User Vertical 2024 & 2032
- Figure 22: South America APAC Professional Audio Visual Equipment Market Revenue (Million), by Country 2024 & 2032
- Figure 23: South America APAC Professional Audio Visual Equipment Market Revenue Share (%), by Country 2024 & 2032
- Figure 24: Europe APAC Professional Audio Visual Equipment Market Revenue (Million), by Type (Qualitative Analysis) 2024 & 2032
- Figure 25: Europe APAC Professional Audio Visual Equipment Market Revenue Share (%), by Type (Qualitative Analysis) 2024 & 2032
- Figure 26: Europe APAC Professional Audio Visual Equipment Market Revenue (Million), by End-User Vertical 2024 & 2032
- Figure 27: Europe APAC Professional Audio Visual Equipment Market Revenue Share (%), by End-User Vertical 2024 & 2032
- Figure 28: Europe APAC Professional Audio Visual Equipment Market Revenue (Million), by Country 2024 & 2032
- Figure 29: Europe APAC Professional Audio Visual Equipment Market Revenue Share (%), by Country 2024 & 2032
- Figure 30: Middle East & Africa APAC Professional Audio Visual Equipment Market Revenue (Million), by Type (Qualitative Analysis) 2024 & 2032
- Figure 31: Middle East & Africa APAC Professional Audio Visual Equipment Market Revenue Share (%), by Type (Qualitative Analysis) 2024 & 2032
- Figure 32: Middle East & Africa APAC Professional Audio Visual Equipment Market Revenue (Million), by End-User Vertical 2024 & 2032
- Figure 33: Middle East & Africa APAC Professional Audio Visual Equipment Market Revenue Share (%), by End-User Vertical 2024 & 2032
- Figure 34: Middle East & Africa APAC Professional Audio Visual Equipment Market Revenue (Million), by Country 2024 & 2032
- Figure 35: Middle East & Africa APAC Professional Audio Visual Equipment Market Revenue Share (%), by Country 2024 & 2032
- Figure 36: Asia Pacific APAC Professional Audio Visual Equipment Market Revenue (Million), by Type (Qualitative Analysis) 2024 & 2032
- Figure 37: Asia Pacific APAC Professional Audio Visual Equipment Market Revenue Share (%), by Type (Qualitative Analysis) 2024 & 2032
- Figure 38: Asia Pacific APAC Professional Audio Visual Equipment Market Revenue (Million), by End-User Vertical 2024 & 2032
- Figure 39: Asia Pacific APAC Professional Audio Visual Equipment Market Revenue Share (%), by End-User Vertical 2024 & 2032
- Figure 40: Asia Pacific APAC Professional Audio Visual Equipment Market Revenue (Million), by Country 2024 & 2032
- Figure 41: Asia Pacific APAC Professional Audio Visual Equipment Market Revenue Share (%), by Country 2024 & 2032
List of Tables
- Table 1: Global APAC Professional Audio Visual Equipment Market Revenue Million Forecast, by Region 2019 & 2032
- Table 2: Global APAC Professional Audio Visual Equipment Market Revenue Million Forecast, by Type (Qualitative Analysis) 2019 & 2032
- Table 3: Global APAC Professional Audio Visual Equipment Market Revenue Million Forecast, by End-User Vertical 2019 & 2032
- Table 4: Global APAC Professional Audio Visual Equipment Market Revenue Million Forecast, by Region 2019 & 2032
- Table 5: Global APAC Professional Audio Visual Equipment Market Revenue Million Forecast, by Country 2019 & 2032
- Table 6: United States APAC Professional Audio Visual Equipment Market Revenue (Million) Forecast, by Application 2019 & 2032
- Table 7: Canada APAC Professional Audio Visual Equipment Market Revenue (Million) Forecast, by Application 2019 & 2032
- Table 8: Global APAC Professional Audio Visual Equipment Market Revenue Million Forecast, by Country 2019 & 2032
- Table 9: United Kingdom APAC Professional Audio Visual Equipment Market Revenue (Million) Forecast, by Application 2019 & 2032
- Table 10: Germany APAC Professional Audio Visual Equipment Market Revenue (Million) Forecast, by Application 2019 & 2032
- Table 11: France APAC Professional Audio Visual Equipment Market Revenue (Million) Forecast, by Application 2019 & 2032
- Table 12: Italy APAC Professional Audio Visual Equipment Market Revenue (Million) Forecast, by Application 2019 & 2032
- Table 13: Rest of Europe APAC Professional Audio Visual Equipment Market Revenue (Million) Forecast, by Application 2019 & 2032
- Table 14: Global APAC Professional Audio Visual Equipment Market Revenue Million Forecast, by Country 2019 & 2032
- Table 15: China APAC Professional Audio Visual Equipment Market Revenue (Million) Forecast, by Application 2019 & 2032
- Table 16: Japan APAC Professional Audio Visual Equipment Market Revenue (Million) Forecast, by Application 2019 & 2032
- Table 17: India APAC Professional Audio Visual Equipment Market Revenue (Million) Forecast, by Application 2019 & 2032
- Table 18: South Korea APAC Professional Audio Visual Equipment Market Revenue (Million) Forecast, by Application 2019 & 2032
- Table 19: Rest of Asia Pacific APAC Professional Audio Visual Equipment Market Revenue (Million) Forecast, by Application 2019 & 2032
- Table 20: Global APAC Professional Audio Visual Equipment Market Revenue Million Forecast, by Country 2019 & 2032
- Table 21: APAC Professional Audio Visual Equipment Market Revenue (Million) Forecast, by Application 2019 & 2032
- Table 22: Global APAC Professional Audio Visual Equipment Market Revenue Million Forecast, by Country 2019 & 2032
- Table 23: APAC Professional Audio Visual Equipment Market Revenue (Million) Forecast, by Application 2019 & 2032
- Table 24: Global APAC Professional Audio Visual Equipment Market Revenue Million Forecast, by Type (Qualitative Analysis) 2019 & 2032
- Table 25: Global APAC Professional Audio Visual Equipment Market Revenue Million Forecast, by End-User Vertical 2019 & 2032
- Table 26: Global APAC Professional Audio Visual Equipment Market Revenue Million Forecast, by Country 2019 & 2032
- Table 27: United States APAC Professional Audio Visual Equipment Market Revenue (Million) Forecast, by Application 2019 & 2032
- Table 28: Canada APAC Professional Audio Visual Equipment Market Revenue (Million) Forecast, by Application 2019 & 2032
- Table 29: Mexico APAC Professional Audio Visual Equipment Market Revenue (Million) Forecast, by Application 2019 & 2032
- Table 30: Global APAC Professional Audio Visual Equipment Market Revenue Million Forecast, by Type (Qualitative Analysis) 2019 & 2032
- Table 31: Global APAC Professional Audio Visual Equipment Market Revenue Million Forecast, by End-User Vertical 2019 & 2032
- Table 32: Global APAC Professional Audio Visual Equipment Market Revenue Million Forecast, by Country 2019 & 2032
- Table 33: Brazil APAC Professional Audio Visual Equipment Market Revenue (Million) Forecast, by Application 2019 & 2032
- Table 34: Argentina APAC Professional Audio Visual Equipment Market Revenue (Million) Forecast, by Application 2019 & 2032
- Table 35: Rest of South America APAC Professional Audio Visual Equipment Market Revenue (Million) Forecast, by Application 2019 & 2032
- Table 36: Global APAC Professional Audio Visual Equipment Market Revenue Million Forecast, by Type (Qualitative Analysis) 2019 & 2032
- Table 37: Global APAC Professional Audio Visual Equipment Market Revenue Million Forecast, by End-User Vertical 2019 & 2032
- Table 38: Global APAC Professional Audio Visual Equipment Market Revenue Million Forecast, by Country 2019 & 2032
- Table 39: United Kingdom APAC Professional Audio Visual Equipment Market Revenue (Million) Forecast, by Application 2019 & 2032
- Table 40: Germany APAC Professional Audio Visual Equipment Market Revenue (Million) Forecast, by Application 2019 & 2032
- Table 41: France APAC Professional Audio Visual Equipment Market Revenue (Million) Forecast, by Application 2019 & 2032
- Table 42: Italy APAC Professional Audio Visual Equipment Market Revenue (Million) Forecast, by Application 2019 & 2032
- Table 43: Spain APAC Professional Audio Visual Equipment Market Revenue (Million) Forecast, by Application 2019 & 2032
- Table 44: Russia APAC Professional Audio Visual Equipment Market Revenue (Million) Forecast, by Application 2019 & 2032
- Table 45: Benelux APAC Professional Audio Visual Equipment Market Revenue (Million) Forecast, by Application 2019 & 2032
- Table 46: Nordics APAC Professional Audio Visual Equipment Market Revenue (Million) Forecast, by Application 2019 & 2032
- Table 47: Rest of Europe APAC Professional Audio Visual Equipment Market Revenue (Million) Forecast, by Application 2019 & 2032
- Table 48: Global APAC Professional Audio Visual Equipment Market Revenue Million Forecast, by Type (Qualitative Analysis) 2019 & 2032
- Table 49: Global APAC Professional Audio Visual Equipment Market Revenue Million Forecast, by End-User Vertical 2019 & 2032
- Table 50: Global APAC Professional Audio Visual Equipment Market Revenue Million Forecast, by Country 2019 & 2032
- Table 51: Turkey APAC Professional Audio Visual Equipment Market Revenue (Million) Forecast, by Application 2019 & 2032
- Table 52: Israel APAC Professional Audio Visual Equipment Market Revenue (Million) Forecast, by Application 2019 & 2032
- Table 53: GCC APAC Professional Audio Visual Equipment Market Revenue (Million) Forecast, by Application 2019 & 2032
- Table 54: North Africa APAC Professional Audio Visual Equipment Market Revenue (Million) Forecast, by Application 2019 & 2032
- Table 55: South Africa APAC Professional Audio Visual Equipment Market Revenue (Million) Forecast, by Application 2019 & 2032
- Table 56: Rest of Middle East & Africa APAC Professional Audio Visual Equipment Market Revenue (Million) Forecast, by Application 2019 & 2032
- Table 57: Global APAC Professional Audio Visual Equipment Market Revenue Million Forecast, by Type (Qualitative Analysis) 2019 & 2032
- Table 58: Global APAC Professional Audio Visual Equipment Market Revenue Million Forecast, by End-User Vertical 2019 & 2032
- Table 59: Global APAC Professional Audio Visual Equipment Market Revenue Million Forecast, by Country 2019 & 2032
- Table 60: China APAC Professional Audio Visual Equipment Market Revenue (Million) Forecast, by Application 2019 & 2032
- Table 61: India APAC Professional Audio Visual Equipment Market Revenue (Million) Forecast, by Application 2019 & 2032
- Table 62: Japan APAC Professional Audio Visual Equipment Market Revenue (Million) Forecast, by Application 2019 & 2032
- Table 63: South Korea APAC Professional Audio Visual Equipment Market Revenue (Million) Forecast, by Application 2019 & 2032
- Table 64: ASEAN APAC Professional Audio Visual Equipment Market Revenue (Million) Forecast, by Application 2019 & 2032
- Table 65: Oceania APAC Professional Audio Visual Equipment Market Revenue (Million) Forecast, by Application 2019 & 2032
- Table 66: Rest of Asia Pacific APAC Professional Audio Visual Equipment Market Revenue (Million) Forecast, by Application 2019 & 2032
Frequently Asked Questions
1. What is the projected Compound Annual Growth Rate (CAGR) of the APAC Professional Audio Visual Equipment Market?
The projected CAGR is approximately 5.54%.
2. Which companies are prominent players in the APAC Professional Audio Visual Equipment Market?
Key companies in the market include Alpine Electronics Inc, Kramer Electronics, Epson*List Not Exhaustive, Planar Systems Inc, Guangzhou Baolun Electronic Co Ltd, Elmo, Guangzhou DSPPA Audio Co Ltd, Vega Global, Panasonic Corporation, Sony Corporation.
3. What are the main segments of the APAC Professional Audio Visual Equipment Market?
The market segments include Type (Qualitative Analysis), End-User Vertical.
4. Can you provide details about the market size?
The market size is estimated to be USD 47.23 Million as of 2022.
5. What are some drivers contributing to market growth?
Rapid Adoption of Cloud Platforms.
6. What are the notable trends driving market growth?
Retail is Analyzed to Witness Highest Growth Rate During the Forecast Period.
7. Are there any restraints impacting market growth?
High Operating and Legal Costs of Audio-Visual Systems.
8. Can you provide examples of recent developments in the market?
June 2023: The Pro Integration Future Asia (PIFA), a professional audiovisual and lighting (AVL) technologies exhibition and conference for the region, started in Singapore in June 2023. A significant highlight of the event was a series of nine Memorandums of Understanding (MOU) signed between the Professional Audio Visual & Lighting Integration Association of Singapore (AVLIAS) and nine trade associations from Singapore, Malaysia, and Thailand to work together to promote educate and grow their business communities.
9. What pricing options are available for accessing the report?
Pricing options include single-user, multi-user, and enterprise licenses priced at USD 3800, USD 4500, and USD 5800 respectively.
10. Is the market size provided in terms of value or volume?
The market size is provided in terms of value, measured in Million.
11. Are there any specific market keywords associated with the report?
Yes, the market keyword associated with the report is "APAC Professional Audio Visual Equipment Market," which aids in identifying and referencing the specific market segment covered.
12. How do I determine which pricing option suits my needs best?
The pricing options vary based on user requirements and access needs. Individual users may opt for single-user licenses, while businesses requiring broader access may choose multi-user or enterprise licenses for cost-effective access to the report.
13. Are there any additional resources or data provided in the APAC Professional Audio Visual Equipment Market report?
While the report offers comprehensive insights, it's advisable to review the specific contents or supplementary materials provided to ascertain if additional resources or data are available.
14. How can I stay updated on further developments or reports in the APAC Professional Audio Visual Equipment Market?
To stay informed about further developments, trends, and reports in the APAC Professional Audio Visual Equipment Market, consider subscribing to industry newsletters, following relevant companies and organizations, or regularly checking reputable industry news sources and publications.
Methodology
Step 1 - Identification of Relevant Samples Size from Population Database


Step 2 - Approaches for Defining Global Market Size (Value, Volume* & Price*)

Note*: In applicable scenarios
Step 3 - Data Sources
Primary Research
- Web Analytics
- Survey Reports
- Research Institute
- Latest Research Reports
- Opinion Leaders
Secondary Research
- Annual Reports
- White Paper
- Latest Press Release
- Industry Association
- Paid Database
- Investor Presentations

Step 4 - Data Triangulation
Involves using different sources of information in order to increase the validity of a study
These sources are likely to be stakeholders in a program - participants, other researchers, program staff, other community members, and so on.
Then we put all data in single framework & apply various statistical tools to find out the dynamic on the market.
During the analysis stage, feedback from the stakeholder groups would be compared to determine areas of agreement as well as areas of divergence


