
Key Insights
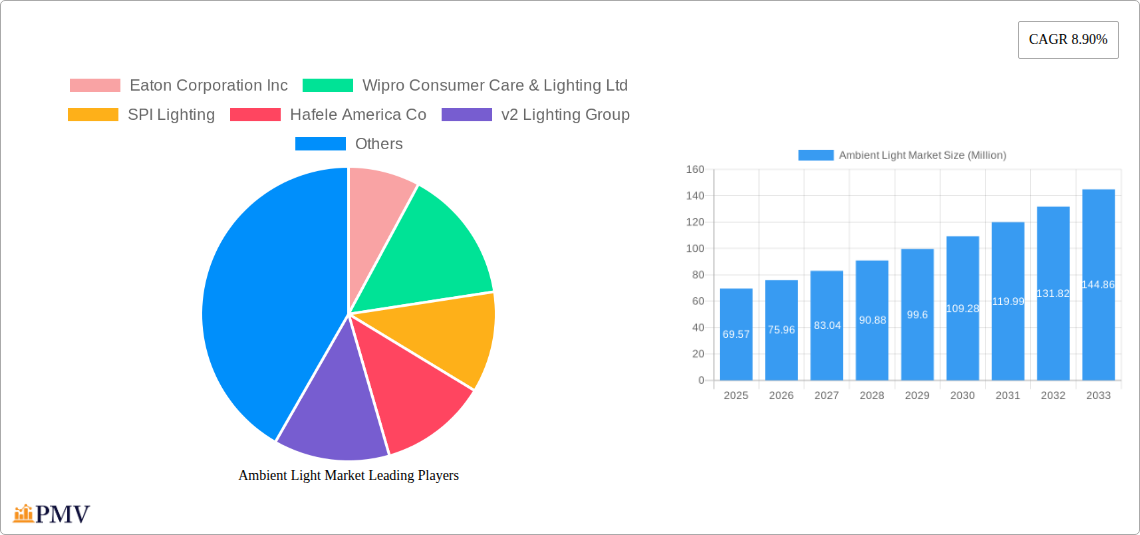
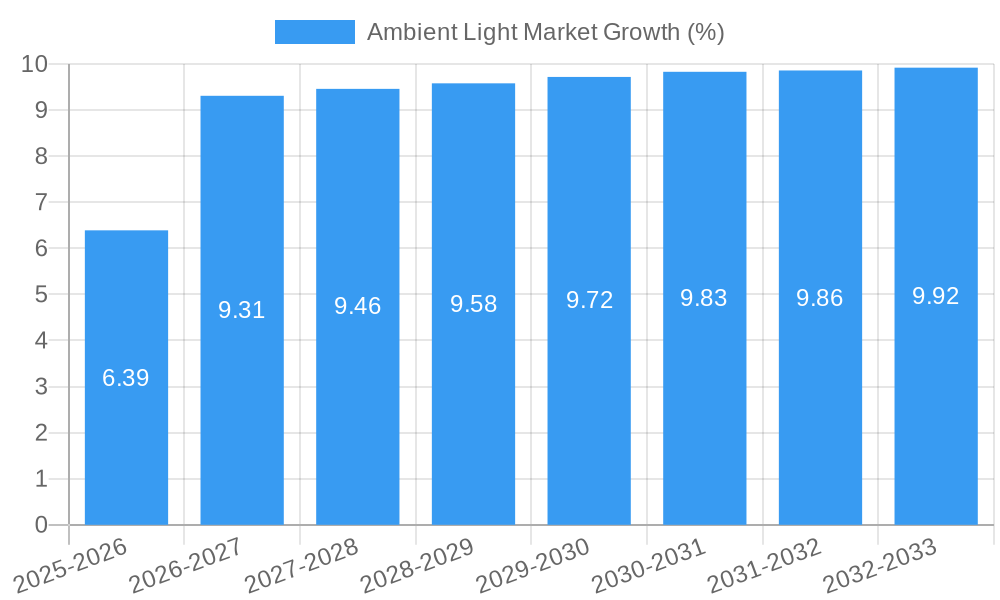
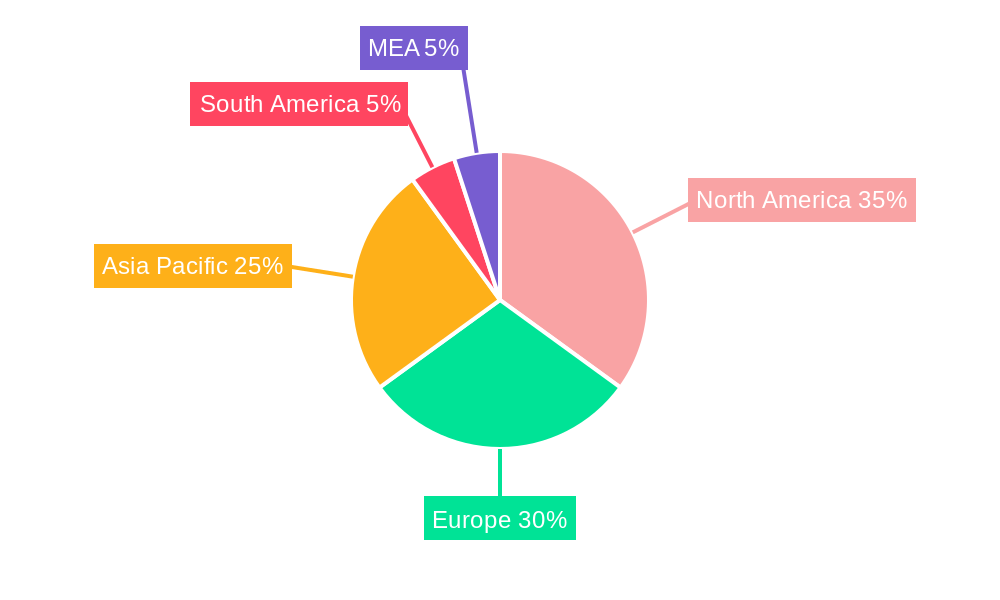
The global ambient lighting market, valued at $69.57 million in 2025, is projected to experience robust growth, exhibiting a compound annual growth rate (CAGR) of 8.90% from 2025 to 2033. This expansion is fueled by several key drivers. The increasing adoption of energy-efficient LED lighting technologies across residential, commercial, and automotive sectors is a significant contributor. Furthermore, the rising demand for smart homes and buildings, incorporating automated lighting control systems for enhanced convenience and energy management, significantly boosts market growth. Growing awareness of the positive impact of ambient lighting on mood, productivity, and overall well-being further fuels consumer demand. Design trends favoring aesthetically pleasing and customizable lighting solutions also play a crucial role. Market segmentation reveals that LED lighting holds a dominant share within the offering segment, driven by its superior energy efficiency and longer lifespan compared to traditional lighting options. The residential sector currently dominates end-user applications, but the hospitality and retail sectors are experiencing significant growth, fueled by the desire to create immersive and appealing environments. Geographic analysis indicates North America and Europe are currently leading market segments, but the Asia-Pacific region is expected to experience the most significant growth in the coming years driven by rapid urbanization and infrastructure development. While challenges exist, such as fluctuating raw material prices and intense competition, the overall market outlook remains highly positive.
The market's competitive landscape is characterized by a mix of established multinational corporations and smaller, specialized players. Major players such as Eaton, Wipro, and Philips leverage their strong brand reputation, extensive distribution networks, and innovative product portfolios to maintain their market share. However, emerging companies are gaining traction through focused niche offerings and disruptive technologies. Future growth will likely be shaped by technological advancements, including the integration of artificial intelligence (AI) and Internet of Things (IoT) technologies in lighting systems to create personalized and responsive ambient lighting experiences. Sustainable manufacturing practices and the development of more energy-efficient solutions will also be pivotal factors influencing market dynamics in the coming years. The continued focus on smart home automation, enhanced user experiences, and health and wellness benefits will further drive market growth and innovation.
Ambient Light Market: A Comprehensive Market Report (2019-2033)
This detailed report provides a comprehensive analysis of the global Ambient Light Market, offering invaluable insights for industry stakeholders, investors, and strategic decision-makers. The study covers the period from 2019 to 2033, with a base year of 2025 and a forecast period extending to 2033. The report meticulously examines market segmentation, competitive dynamics, growth drivers, and emerging trends, providing a clear roadmap for navigating this dynamic market. The market size is projected at xx Million in 2025 and is expected to reach xx Million by 2033, exhibiting a CAGR of xx%.
Ambient Light Market Market Structure & Competitive Dynamics
The global ambient light market is characterized by a moderately consolidated structure, with several key players holding significant market share. Competition is intense, driven by ongoing product innovation, technological advancements, and strategic mergers and acquisitions (M&A). Key players such as Eaton Corporation Inc, Wipro Consumer Care & Lighting Ltd, and Koninklijke Philips NV are constantly striving to enhance their product offerings and expand their market presence. Regulatory frameworks, particularly those focusing on energy efficiency and sustainability, significantly impact market dynamics. The increasing demand for energy-efficient lighting solutions is driving the adoption of LED-based ambient lighting systems. The market also witnesses consistent M&A activities, with deal values ranging from xx Million to xx Million in recent years, primarily focused on expanding product portfolios and geographical reach. Substitutes like traditional incandescent and fluorescent lighting are gradually losing market share due to advancements in LED technology and stringent environmental regulations. End-user trends reveal a growing preference for smart lighting systems offering enhanced control, energy efficiency, and aesthetic appeal, especially within residential and commercial segments.
- Market Concentration: Moderately consolidated, with top 5 players holding approximately xx% market share in 2024.
- Innovation Ecosystems: Active collaboration between lighting manufacturers, technology providers, and research institutions.
- Regulatory Frameworks: Stringent energy efficiency standards and environmental regulations driving market shifts towards LED technology.
- Product Substitutes: Traditional lighting technologies facing declining market share due to LED advancements.
- End-User Trends: Increasing preference for smart, energy-efficient, and aesthetically pleasing ambient lighting solutions.
- M&A Activities: Significant M&A activity observed in recent years, with deal values averaging xx Million.
Ambient Light Market Industry Trends & Insights
The ambient light market is experiencing robust growth, fueled by several key factors. Technological advancements, particularly in LED technology and smart lighting systems, are driving innovation and expanding market applications. Consumer preferences are shifting towards energy-efficient, aesthetically pleasing, and customizable lighting solutions, leading to increased demand for smart and connected ambient lighting. The rising adoption of LED lighting is a major growth driver, with LED market penetration exceeding xx% in 2024. Moreover, government initiatives promoting energy efficiency are further propelling market expansion. However, challenges like fluctuating raw material prices and supply chain disruptions pose potential threats to market growth. The competitive landscape remains dynamic, with both established players and new entrants vying for market share through product innovation and strategic partnerships. The market is expected to witness a CAGR of xx% during the forecast period (2025-2033).
Dominant Markets & Segments in Ambient Light Market
The residential segment dominates the ambient light market, driven by the growing preference for aesthetically pleasing and energy-efficient lighting solutions in homes. Within the type segment, LED-based recessed lights hold a significant market share due to their energy efficiency and design flexibility. Geographically, North America and Europe are currently the leading markets due to high consumer spending, stringent environmental regulations, and increased adoption of smart home technology.
By Type:
- Recessed Lights: High demand due to energy efficiency and design flexibility.
- LED Strip Lights: Growing popularity for decorative and accent lighting.
- Surface-mounted lights: High demand in residential and commercial applications.
By End User:
- Residential: Largest market segment due to growing preference for smart lighting and home automation.
- Commercial: Significant growth potential due to rising adoption of energy-efficient lighting solutions.
- Automotive: Steady growth driven by increasing demand for advanced lighting technologies.
By Offering:
- LED Lamps and Luminaires: Dominating market share due to superior energy efficiency and longer lifespan.
- Lighting Controls: Growing demand for smart lighting systems offering remote control and automation capabilities.
Key Drivers:
- Technological advancements in LED technology and smart lighting systems.
- Growing consumer preference for energy-efficient and aesthetically pleasing lighting solutions.
- Government initiatives promoting energy efficiency and sustainable development.
- Expanding applications in residential, commercial, and automotive sectors.
Ambient Light Market Product Innovations
Recent advancements focus on smart lighting systems integrating IoT capabilities, offering remote control, automation, and energy-saving features. Manufacturers are increasingly emphasizing energy efficiency, design flexibility, and improved lifespan to cater to the evolving consumer preferences. Integration of AI and machine learning in lighting controls allows for personalized lighting experiences and optimized energy management. This creates a competitive advantage by offering superior user experience and cost savings.
Report Segmentation & Scope
This report segments the ambient light market by Type (Surface-mounted Light, Track Light, Strip Light, Suspended Light, Recessed Light, Other Types), End User (Residential, Automotive, Hospitality and Retail, Healthcare, Other End Users (Industrial)), and Offering (Lamps and Luminaires, Light Emitting Diode (LED): Lighting Controls). Each segment is analyzed in detail, including growth projections, market sizes, and competitive dynamics. The report considers various geographical regions, offering granular analysis of market trends and growth prospects in specific countries and regions.
Key Drivers of Ambient Light Market Growth
Technological advancements in LED technology, such as improved efficacy and color rendering, are key growth drivers. Government regulations promoting energy efficiency, like stricter building codes, and increasing consumer awareness of sustainability are also propelling the market. Furthermore, the rising adoption of smart home technologies and integration of lighting into IoT ecosystems are expanding market opportunities.
Challenges in the Ambient Light Market Sector
The ambient light market faces challenges such as fluctuating raw material prices, particularly for LEDs and other components, impacting production costs. Supply chain disruptions and geopolitical uncertainties can lead to delays and increased expenses. Intense competition among manufacturers requires continuous innovation and investment in R&D to maintain market share.
Leading Players in the Ambient Light Market Market
- Eaton Corporation Inc
- Wipro Consumer Care & Lighting Ltd
- SPI Lighting
- Hafele America Co
- v2 Lighting Group
- Samsung Electronics Co Ltd
- Cree Inc
- Hubbell Incorporated
- GE Lighting
- Amerlux
- Bridgelux Inc
- Nulite Lighting
- Louis Poulsen
- Koninklijke Philips NV
- Acuity Brands Inc
- OSRAM Licht AG
- The Zumtobel Group
- Decon Lighting Pvt Ltd
Key Developments in Ambient Light Market Sector
- March 2022: Koninklijke Philips NV launched an ambient experience and flexvision display with the Azurion system, improving patient care and workflow efficiency in healthcare settings.
- February 2022: Samsung Electronics Co., Ltd. unveiled its newest micro LED display technology, offering superior picture quality and immersive viewing experience.
Strategic Ambient Light Market Market Outlook
The ambient light market holds significant growth potential, driven by ongoing technological advancements, increasing consumer demand for smart lighting solutions, and supportive government policies. Strategic opportunities lie in developing energy-efficient, customizable, and aesthetically appealing lighting systems that integrate seamlessly with smart home ecosystems. Expanding into emerging markets and forging strategic partnerships with technology providers will be crucial for long-term success.
Ambient Light Market Segmentation
-
1. Offering
- 1.1. Lamps and Luminaires
- 1.2. Lighting Controls
-
2. Type
- 2.1. Surface-mounted Light
- 2.2. Track Light
- 2.3. Strip Light
- 2.4. Suspended Light
- 2.5. Recessed Light
- 2.6. Other Types
-
3. End User
- 3.1. Residential
- 3.2. Automotive
- 3.3. Hospitality and Retail
- 3.4. Healthcare
- 3.5. Other End Users (Industrial)
Ambient Light Market Segmentation By Geography
-
1. North America
- 1.1. United States
- 1.2. Canada
-
2. Europe
- 2.1. United Kingdom
- 2.2. Germany
- 2.3. France
- 2.4. Rest of Europe
-
3. Asia Pacific
- 3.1. China
- 3.2. Japan
- 3.3. India
- 3.4. Rest of Asia Pacific
-
4. Rest of the World
- 4.1. Latin America
- 4.2. Middle East and Africa
Ambient Light Market REPORT HIGHLIGHTS
| Aspects | Details |
|---|---|
| Study Period | 2019-2033 |
| Base Year | 2024 |
| Estimated Year | 2025 |
| Forecast Period | 2025-2033 |
| Historical Period | 2019-2024 |
| Growth Rate | CAGR of 8.90% from 2019-2033 |
| Segmentation |
|
Table of Contents
- 1. Introduction
- 1.1. Research Scope
- 1.2. Market Segmentation
- 1.3. Research Methodology
- 1.4. Definitions and Assumptions
- 2. Executive Summary
- 2.1. Introduction
- 3. Market Dynamics
- 3.1. Introduction
- 3.2. Market Drivers
- 3.2.1. Increasing Need for Energy-efficient Lighting Solutions; Increasing Adoption of Smart Lighting; Modernization of Infrastructure
- 3.3. Market Restrains
- 3.3.1. Challenges Associated With LED Driver Failure and High Cost Associated With Installation
- 3.4. Market Trends
- 3.4.1. LEDs to Hold Significant Market Share
- 4. Market Factor Analysis
- 4.1. Porters Five Forces
- 4.2. Supply/Value Chain
- 4.3. PESTEL analysis
- 4.4. Market Entropy
- 4.5. Patent/Trademark Analysis
- 5. Global Ambient Light Market Analysis, Insights and Forecast, 2019-2031
- 5.1. Market Analysis, Insights and Forecast - by Offering
- 5.1.1. Lamps and Luminaires
- 5.1.2. Lighting Controls
- 5.2. Market Analysis, Insights and Forecast - by Type
- 5.2.1. Surface-mounted Light
- 5.2.2. Track Light
- 5.2.3. Strip Light
- 5.2.4. Suspended Light
- 5.2.5. Recessed Light
- 5.2.6. Other Types
- 5.3. Market Analysis, Insights and Forecast - by End User
- 5.3.1. Residential
- 5.3.2. Automotive
- 5.3.3. Hospitality and Retail
- 5.3.4. Healthcare
- 5.3.5. Other End Users (Industrial)
- 5.4. Market Analysis, Insights and Forecast - by Region
- 5.4.1. North America
- 5.4.2. Europe
- 5.4.3. Asia Pacific
- 5.4.4. Rest of the World
- 5.1. Market Analysis, Insights and Forecast - by Offering
- 6. North America Ambient Light Market Analysis, Insights and Forecast, 2019-2031
- 6.1. Market Analysis, Insights and Forecast - by Offering
- 6.1.1. Lamps and Luminaires
- 6.1.2. Lighting Controls
- 6.2. Market Analysis, Insights and Forecast - by Type
- 6.2.1. Surface-mounted Light
- 6.2.2. Track Light
- 6.2.3. Strip Light
- 6.2.4. Suspended Light
- 6.2.5. Recessed Light
- 6.2.6. Other Types
- 6.3. Market Analysis, Insights and Forecast - by End User
- 6.3.1. Residential
- 6.3.2. Automotive
- 6.3.3. Hospitality and Retail
- 6.3.4. Healthcare
- 6.3.5. Other End Users (Industrial)
- 6.1. Market Analysis, Insights and Forecast - by Offering
- 7. Europe Ambient Light Market Analysis, Insights and Forecast, 2019-2031
- 7.1. Market Analysis, Insights and Forecast - by Offering
- 7.1.1. Lamps and Luminaires
- 7.1.2. Lighting Controls
- 7.2. Market Analysis, Insights and Forecast - by Type
- 7.2.1. Surface-mounted Light
- 7.2.2. Track Light
- 7.2.3. Strip Light
- 7.2.4. Suspended Light
- 7.2.5. Recessed Light
- 7.2.6. Other Types
- 7.3. Market Analysis, Insights and Forecast - by End User
- 7.3.1. Residential
- 7.3.2. Automotive
- 7.3.3. Hospitality and Retail
- 7.3.4. Healthcare
- 7.3.5. Other End Users (Industrial)
- 7.1. Market Analysis, Insights and Forecast - by Offering
- 8. Asia Pacific Ambient Light Market Analysis, Insights and Forecast, 2019-2031
- 8.1. Market Analysis, Insights and Forecast - by Offering
- 8.1.1. Lamps and Luminaires
- 8.1.2. Lighting Controls
- 8.2. Market Analysis, Insights and Forecast - by Type
- 8.2.1. Surface-mounted Light
- 8.2.2. Track Light
- 8.2.3. Strip Light
- 8.2.4. Suspended Light
- 8.2.5. Recessed Light
- 8.2.6. Other Types
- 8.3. Market Analysis, Insights and Forecast - by End User
- 8.3.1. Residential
- 8.3.2. Automotive
- 8.3.3. Hospitality and Retail
- 8.3.4. Healthcare
- 8.3.5. Other End Users (Industrial)
- 8.1. Market Analysis, Insights and Forecast - by Offering
- 9. Rest of the World Ambient Light Market Analysis, Insights and Forecast, 2019-2031
- 9.1. Market Analysis, Insights and Forecast - by Offering
- 9.1.1. Lamps and Luminaires
- 9.1.2. Lighting Controls
- 9.2. Market Analysis, Insights and Forecast - by Type
- 9.2.1. Surface-mounted Light
- 9.2.2. Track Light
- 9.2.3. Strip Light
- 9.2.4. Suspended Light
- 9.2.5. Recessed Light
- 9.2.6. Other Types
- 9.3. Market Analysis, Insights and Forecast - by End User
- 9.3.1. Residential
- 9.3.2. Automotive
- 9.3.3. Hospitality and Retail
- 9.3.4. Healthcare
- 9.3.5. Other End Users (Industrial)
- 9.1. Market Analysis, Insights and Forecast - by Offering
- 10. North America Ambient Light Market Analysis, Insights and Forecast, 2019-2031
- 10.1. Market Analysis, Insights and Forecast - By Country/Sub-region
- 10.1.1 United States
- 10.1.2 Canada
- 10.1.3 Mexico
- 11. Europe Ambient Light Market Analysis, Insights and Forecast, 2019-2031
- 11.1. Market Analysis, Insights and Forecast - By Country/Sub-region
- 11.1.1 Germany
- 11.1.2 United Kingdom
- 11.1.3 France
- 11.1.4 Spain
- 11.1.5 Italy
- 11.1.6 Spain
- 11.1.7 Belgium
- 11.1.8 Netherland
- 11.1.9 Nordics
- 11.1.10 Rest of Europe
- 12. Asia Pacific Ambient Light Market Analysis, Insights and Forecast, 2019-2031
- 12.1. Market Analysis, Insights and Forecast - By Country/Sub-region
- 12.1.1 China
- 12.1.2 Japan
- 12.1.3 India
- 12.1.4 South Korea
- 12.1.5 Southeast Asia
- 12.1.6 Australia
- 12.1.7 Indonesia
- 12.1.8 Phillipes
- 12.1.9 Singapore
- 12.1.10 Thailandc
- 12.1.11 Rest of Asia Pacific
- 13. South America Ambient Light Market Analysis, Insights and Forecast, 2019-2031
- 13.1. Market Analysis, Insights and Forecast - By Country/Sub-region
- 13.1.1 Brazil
- 13.1.2 Argentina
- 13.1.3 Peru
- 13.1.4 Chile
- 13.1.5 Colombia
- 13.1.6 Ecuador
- 13.1.7 Venezuela
- 13.1.8 Rest of South America
- 14. North America Ambient Light Market Analysis, Insights and Forecast, 2019-2031
- 14.1. Market Analysis, Insights and Forecast - By Country/Sub-region
- 14.1.1 United States
- 14.1.2 Canada
- 14.1.3 Mexico
- 15. MEA Ambient Light Market Analysis, Insights and Forecast, 2019-2031
- 15.1. Market Analysis, Insights and Forecast - By Country/Sub-region
- 15.1.1 United Arab Emirates
- 15.1.2 Saudi Arabia
- 15.1.3 South Africa
- 15.1.4 Rest of Middle East and Africa
- 16. Competitive Analysis
- 16.1. Global Market Share Analysis 2024
- 16.2. Company Profiles
- 16.2.1 Eaton Corporation Inc
- 16.2.1.1. Overview
- 16.2.1.2. Products
- 16.2.1.3. SWOT Analysis
- 16.2.1.4. Recent Developments
- 16.2.1.5. Financials (Based on Availability)
- 16.2.2 Wipro Consumer Care & Lighting Ltd
- 16.2.2.1. Overview
- 16.2.2.2. Products
- 16.2.2.3. SWOT Analysis
- 16.2.2.4. Recent Developments
- 16.2.2.5. Financials (Based on Availability)
- 16.2.3 SPI Lighting
- 16.2.3.1. Overview
- 16.2.3.2. Products
- 16.2.3.3. SWOT Analysis
- 16.2.3.4. Recent Developments
- 16.2.3.5. Financials (Based on Availability)
- 16.2.4 Hafele America Co
- 16.2.4.1. Overview
- 16.2.4.2. Products
- 16.2.4.3. SWOT Analysis
- 16.2.4.4. Recent Developments
- 16.2.4.5. Financials (Based on Availability)
- 16.2.5 v2 Lighting Group
- 16.2.5.1. Overview
- 16.2.5.2. Products
- 16.2.5.3. SWOT Analysis
- 16.2.5.4. Recent Developments
- 16.2.5.5. Financials (Based on Availability)
- 16.2.6 Samsung Electronics Co Ltd
- 16.2.6.1. Overview
- 16.2.6.2. Products
- 16.2.6.3. SWOT Analysis
- 16.2.6.4. Recent Developments
- 16.2.6.5. Financials (Based on Availability)
- 16.2.7 Cree Inc
- 16.2.7.1. Overview
- 16.2.7.2. Products
- 16.2.7.3. SWOT Analysis
- 16.2.7.4. Recent Developments
- 16.2.7.5. Financials (Based on Availability)
- 16.2.8 Hubbell Incorporated
- 16.2.8.1. Overview
- 16.2.8.2. Products
- 16.2.8.3. SWOT Analysis
- 16.2.8.4. Recent Developments
- 16.2.8.5. Financials (Based on Availability)
- 16.2.9 GE Lighting
- 16.2.9.1. Overview
- 16.2.9.2. Products
- 16.2.9.3. SWOT Analysis
- 16.2.9.4. Recent Developments
- 16.2.9.5. Financials (Based on Availability)
- 16.2.10 Amerlux
- 16.2.10.1. Overview
- 16.2.10.2. Products
- 16.2.10.3. SWOT Analysis
- 16.2.10.4. Recent Developments
- 16.2.10.5. Financials (Based on Availability)
- 16.2.11 Bridgelux Inc
- 16.2.11.1. Overview
- 16.2.11.2. Products
- 16.2.11.3. SWOT Analysis
- 16.2.11.4. Recent Developments
- 16.2.11.5. Financials (Based on Availability)
- 16.2.12 Nulite Lighting
- 16.2.12.1. Overview
- 16.2.12.2. Products
- 16.2.12.3. SWOT Analysis
- 16.2.12.4. Recent Developments
- 16.2.12.5. Financials (Based on Availability)
- 16.2.13 Louis Poulsen
- 16.2.13.1. Overview
- 16.2.13.2. Products
- 16.2.13.3. SWOT Analysis
- 16.2.13.4. Recent Developments
- 16.2.13.5. Financials (Based on Availability)
- 16.2.14 Koninklijke Philips NV
- 16.2.14.1. Overview
- 16.2.14.2. Products
- 16.2.14.3. SWOT Analysis
- 16.2.14.4. Recent Developments
- 16.2.14.5. Financials (Based on Availability)
- 16.2.15 Acuity Brands Inc
- 16.2.15.1. Overview
- 16.2.15.2. Products
- 16.2.15.3. SWOT Analysis
- 16.2.15.4. Recent Developments
- 16.2.15.5. Financials (Based on Availability)
- 16.2.16 OSRAM Licht AG
- 16.2.16.1. Overview
- 16.2.16.2. Products
- 16.2.16.3. SWOT Analysis
- 16.2.16.4. Recent Developments
- 16.2.16.5. Financials (Based on Availability)
- 16.2.17 The Zumtobel Group
- 16.2.17.1. Overview
- 16.2.17.2. Products
- 16.2.17.3. SWOT Analysis
- 16.2.17.4. Recent Developments
- 16.2.17.5. Financials (Based on Availability)
- 16.2.18 Decon Lighting Pvt Ltd
- 16.2.18.1. Overview
- 16.2.18.2. Products
- 16.2.18.3. SWOT Analysis
- 16.2.18.4. Recent Developments
- 16.2.18.5. Financials (Based on Availability)
- 16.2.1 Eaton Corporation Inc
List of Figures
- Figure 1: Global Ambient Light Market Revenue Breakdown (Million, %) by Region 2024 & 2032
- Figure 2: Global Ambient Light Market Volume Breakdown (K Unit, %) by Region 2024 & 2032
- Figure 3: North America Ambient Light Market Revenue (Million), by Country 2024 & 2032
- Figure 4: North America Ambient Light Market Volume (K Unit), by Country 2024 & 2032
- Figure 5: North America Ambient Light Market Revenue Share (%), by Country 2024 & 2032
- Figure 6: North America Ambient Light Market Volume Share (%), by Country 2024 & 2032
- Figure 7: Europe Ambient Light Market Revenue (Million), by Country 2024 & 2032
- Figure 8: Europe Ambient Light Market Volume (K Unit), by Country 2024 & 2032
- Figure 9: Europe Ambient Light Market Revenue Share (%), by Country 2024 & 2032
- Figure 10: Europe Ambient Light Market Volume Share (%), by Country 2024 & 2032
- Figure 11: Asia Pacific Ambient Light Market Revenue (Million), by Country 2024 & 2032
- Figure 12: Asia Pacific Ambient Light Market Volume (K Unit), by Country 2024 & 2032
- Figure 13: Asia Pacific Ambient Light Market Revenue Share (%), by Country 2024 & 2032
- Figure 14: Asia Pacific Ambient Light Market Volume Share (%), by Country 2024 & 2032
- Figure 15: South America Ambient Light Market Revenue (Million), by Country 2024 & 2032
- Figure 16: South America Ambient Light Market Volume (K Unit), by Country 2024 & 2032
- Figure 17: South America Ambient Light Market Revenue Share (%), by Country 2024 & 2032
- Figure 18: South America Ambient Light Market Volume Share (%), by Country 2024 & 2032
- Figure 19: North America Ambient Light Market Revenue (Million), by Country 2024 & 2032
- Figure 20: North America Ambient Light Market Volume (K Unit), by Country 2024 & 2032
- Figure 21: North America Ambient Light Market Revenue Share (%), by Country 2024 & 2032
- Figure 22: North America Ambient Light Market Volume Share (%), by Country 2024 & 2032
- Figure 23: MEA Ambient Light Market Revenue (Million), by Country 2024 & 2032
- Figure 24: MEA Ambient Light Market Volume (K Unit), by Country 2024 & 2032
- Figure 25: MEA Ambient Light Market Revenue Share (%), by Country 2024 & 2032
- Figure 26: MEA Ambient Light Market Volume Share (%), by Country 2024 & 2032
- Figure 27: North America Ambient Light Market Revenue (Million), by Offering 2024 & 2032
- Figure 28: North America Ambient Light Market Volume (K Unit), by Offering 2024 & 2032
- Figure 29: North America Ambient Light Market Revenue Share (%), by Offering 2024 & 2032
- Figure 30: North America Ambient Light Market Volume Share (%), by Offering 2024 & 2032
- Figure 31: North America Ambient Light Market Revenue (Million), by Type 2024 & 2032
- Figure 32: North America Ambient Light Market Volume (K Unit), by Type 2024 & 2032
- Figure 33: North America Ambient Light Market Revenue Share (%), by Type 2024 & 2032
- Figure 34: North America Ambient Light Market Volume Share (%), by Type 2024 & 2032
- Figure 35: North America Ambient Light Market Revenue (Million), by End User 2024 & 2032
- Figure 36: North America Ambient Light Market Volume (K Unit), by End User 2024 & 2032
- Figure 37: North America Ambient Light Market Revenue Share (%), by End User 2024 & 2032
- Figure 38: North America Ambient Light Market Volume Share (%), by End User 2024 & 2032
- Figure 39: North America Ambient Light Market Revenue (Million), by Country 2024 & 2032
- Figure 40: North America Ambient Light Market Volume (K Unit), by Country 2024 & 2032
- Figure 41: North America Ambient Light Market Revenue Share (%), by Country 2024 & 2032
- Figure 42: North America Ambient Light Market Volume Share (%), by Country 2024 & 2032
- Figure 43: Europe Ambient Light Market Revenue (Million), by Offering 2024 & 2032
- Figure 44: Europe Ambient Light Market Volume (K Unit), by Offering 2024 & 2032
- Figure 45: Europe Ambient Light Market Revenue Share (%), by Offering 2024 & 2032
- Figure 46: Europe Ambient Light Market Volume Share (%), by Offering 2024 & 2032
- Figure 47: Europe Ambient Light Market Revenue (Million), by Type 2024 & 2032
- Figure 48: Europe Ambient Light Market Volume (K Unit), by Type 2024 & 2032
- Figure 49: Europe Ambient Light Market Revenue Share (%), by Type 2024 & 2032
- Figure 50: Europe Ambient Light Market Volume Share (%), by Type 2024 & 2032
- Figure 51: Europe Ambient Light Market Revenue (Million), by End User 2024 & 2032
- Figure 52: Europe Ambient Light Market Volume (K Unit), by End User 2024 & 2032
- Figure 53: Europe Ambient Light Market Revenue Share (%), by End User 2024 & 2032
- Figure 54: Europe Ambient Light Market Volume Share (%), by End User 2024 & 2032
- Figure 55: Europe Ambient Light Market Revenue (Million), by Country 2024 & 2032
- Figure 56: Europe Ambient Light Market Volume (K Unit), by Country 2024 & 2032
- Figure 57: Europe Ambient Light Market Revenue Share (%), by Country 2024 & 2032
- Figure 58: Europe Ambient Light Market Volume Share (%), by Country 2024 & 2032
- Figure 59: Asia Pacific Ambient Light Market Revenue (Million), by Offering 2024 & 2032
- Figure 60: Asia Pacific Ambient Light Market Volume (K Unit), by Offering 2024 & 2032
- Figure 61: Asia Pacific Ambient Light Market Revenue Share (%), by Offering 2024 & 2032
- Figure 62: Asia Pacific Ambient Light Market Volume Share (%), by Offering 2024 & 2032
- Figure 63: Asia Pacific Ambient Light Market Revenue (Million), by Type 2024 & 2032
- Figure 64: Asia Pacific Ambient Light Market Volume (K Unit), by Type 2024 & 2032
- Figure 65: Asia Pacific Ambient Light Market Revenue Share (%), by Type 2024 & 2032
- Figure 66: Asia Pacific Ambient Light Market Volume Share (%), by Type 2024 & 2032
- Figure 67: Asia Pacific Ambient Light Market Revenue (Million), by End User 2024 & 2032
- Figure 68: Asia Pacific Ambient Light Market Volume (K Unit), by End User 2024 & 2032
- Figure 69: Asia Pacific Ambient Light Market Revenue Share (%), by End User 2024 & 2032
- Figure 70: Asia Pacific Ambient Light Market Volume Share (%), by End User 2024 & 2032
- Figure 71: Asia Pacific Ambient Light Market Revenue (Million), by Country 2024 & 2032
- Figure 72: Asia Pacific Ambient Light Market Volume (K Unit), by Country 2024 & 2032
- Figure 73: Asia Pacific Ambient Light Market Revenue Share (%), by Country 2024 & 2032
- Figure 74: Asia Pacific Ambient Light Market Volume Share (%), by Country 2024 & 2032
- Figure 75: Rest of the World Ambient Light Market Revenue (Million), by Offering 2024 & 2032
- Figure 76: Rest of the World Ambient Light Market Volume (K Unit), by Offering 2024 & 2032
- Figure 77: Rest of the World Ambient Light Market Revenue Share (%), by Offering 2024 & 2032
- Figure 78: Rest of the World Ambient Light Market Volume Share (%), by Offering 2024 & 2032
- Figure 79: Rest of the World Ambient Light Market Revenue (Million), by Type 2024 & 2032
- Figure 80: Rest of the World Ambient Light Market Volume (K Unit), by Type 2024 & 2032
- Figure 81: Rest of the World Ambient Light Market Revenue Share (%), by Type 2024 & 2032
- Figure 82: Rest of the World Ambient Light Market Volume Share (%), by Type 2024 & 2032
- Figure 83: Rest of the World Ambient Light Market Revenue (Million), by End User 2024 & 2032
- Figure 84: Rest of the World Ambient Light Market Volume (K Unit), by End User 2024 & 2032
- Figure 85: Rest of the World Ambient Light Market Revenue Share (%), by End User 2024 & 2032
- Figure 86: Rest of the World Ambient Light Market Volume Share (%), by End User 2024 & 2032
- Figure 87: Rest of the World Ambient Light Market Revenue (Million), by Country 2024 & 2032
- Figure 88: Rest of the World Ambient Light Market Volume (K Unit), by Country 2024 & 2032
- Figure 89: Rest of the World Ambient Light Market Revenue Share (%), by Country 2024 & 2032
- Figure 90: Rest of the World Ambient Light Market Volume Share (%), by Country 2024 & 2032
List of Tables
- Table 1: Global Ambient Light Market Revenue Million Forecast, by Region 2019 & 2032
- Table 2: Global Ambient Light Market Volume K Unit Forecast, by Region 2019 & 2032
- Table 3: Global Ambient Light Market Revenue Million Forecast, by Offering 2019 & 2032
- Table 4: Global Ambient Light Market Volume K Unit Forecast, by Offering 2019 & 2032
- Table 5: Global Ambient Light Market Revenue Million Forecast, by Type 2019 & 2032
- Table 6: Global Ambient Light Market Volume K Unit Forecast, by Type 2019 & 2032
- Table 7: Global Ambient Light Market Revenue Million Forecast, by End User 2019 & 2032
- Table 8: Global Ambient Light Market Volume K Unit Forecast, by End User 2019 & 2032
- Table 9: Global Ambient Light Market Revenue Million Forecast, by Region 2019 & 2032
- Table 10: Global Ambient Light Market Volume K Unit Forecast, by Region 2019 & 2032
- Table 11: Global Ambient Light Market Revenue Million Forecast, by Country 2019 & 2032
- Table 12: Global Ambient Light Market Volume K Unit Forecast, by Country 2019 & 2032
- Table 13: United States Ambient Light Market Revenue (Million) Forecast, by Application 2019 & 2032
- Table 14: United States Ambient Light Market Volume (K Unit) Forecast, by Application 2019 & 2032
- Table 15: Canada Ambient Light Market Revenue (Million) Forecast, by Application 2019 & 2032
- Table 16: Canada Ambient Light Market Volume (K Unit) Forecast, by Application 2019 & 2032
- Table 17: Mexico Ambient Light Market Revenue (Million) Forecast, by Application 2019 & 2032
- Table 18: Mexico Ambient Light Market Volume (K Unit) Forecast, by Application 2019 & 2032
- Table 19: Global Ambient Light Market Revenue Million Forecast, by Country 2019 & 2032
- Table 20: Global Ambient Light Market Volume K Unit Forecast, by Country 2019 & 2032
- Table 21: Germany Ambient Light Market Revenue (Million) Forecast, by Application 2019 & 2032
- Table 22: Germany Ambient Light Market Volume (K Unit) Forecast, by Application 2019 & 2032
- Table 23: United Kingdom Ambient Light Market Revenue (Million) Forecast, by Application 2019 & 2032
- Table 24: United Kingdom Ambient Light Market Volume (K Unit) Forecast, by Application 2019 & 2032
- Table 25: France Ambient Light Market Revenue (Million) Forecast, by Application 2019 & 2032
- Table 26: France Ambient Light Market Volume (K Unit) Forecast, by Application 2019 & 2032
- Table 27: Spain Ambient Light Market Revenue (Million) Forecast, by Application 2019 & 2032
- Table 28: Spain Ambient Light Market Volume (K Unit) Forecast, by Application 2019 & 2032
- Table 29: Italy Ambient Light Market Revenue (Million) Forecast, by Application 2019 & 2032
- Table 30: Italy Ambient Light Market Volume (K Unit) Forecast, by Application 2019 & 2032
- Table 31: Spain Ambient Light Market Revenue (Million) Forecast, by Application 2019 & 2032
- Table 32: Spain Ambient Light Market Volume (K Unit) Forecast, by Application 2019 & 2032
- Table 33: Belgium Ambient Light Market Revenue (Million) Forecast, by Application 2019 & 2032
- Table 34: Belgium Ambient Light Market Volume (K Unit) Forecast, by Application 2019 & 2032
- Table 35: Netherland Ambient Light Market Revenue (Million) Forecast, by Application 2019 & 2032
- Table 36: Netherland Ambient Light Market Volume (K Unit) Forecast, by Application 2019 & 2032
- Table 37: Nordics Ambient Light Market Revenue (Million) Forecast, by Application 2019 & 2032
- Table 38: Nordics Ambient Light Market Volume (K Unit) Forecast, by Application 2019 & 2032
- Table 39: Rest of Europe Ambient Light Market Revenue (Million) Forecast, by Application 2019 & 2032
- Table 40: Rest of Europe Ambient Light Market Volume (K Unit) Forecast, by Application 2019 & 2032
- Table 41: Global Ambient Light Market Revenue Million Forecast, by Country 2019 & 2032
- Table 42: Global Ambient Light Market Volume K Unit Forecast, by Country 2019 & 2032
- Table 43: China Ambient Light Market Revenue (Million) Forecast, by Application 2019 & 2032
- Table 44: China Ambient Light Market Volume (K Unit) Forecast, by Application 2019 & 2032
- Table 45: Japan Ambient Light Market Revenue (Million) Forecast, by Application 2019 & 2032
- Table 46: Japan Ambient Light Market Volume (K Unit) Forecast, by Application 2019 & 2032
- Table 47: India Ambient Light Market Revenue (Million) Forecast, by Application 2019 & 2032
- Table 48: India Ambient Light Market Volume (K Unit) Forecast, by Application 2019 & 2032
- Table 49: South Korea Ambient Light Market Revenue (Million) Forecast, by Application 2019 & 2032
- Table 50: South Korea Ambient Light Market Volume (K Unit) Forecast, by Application 2019 & 2032
- Table 51: Southeast Asia Ambient Light Market Revenue (Million) Forecast, by Application 2019 & 2032
- Table 52: Southeast Asia Ambient Light Market Volume (K Unit) Forecast, by Application 2019 & 2032
- Table 53: Australia Ambient Light Market Revenue (Million) Forecast, by Application 2019 & 2032
- Table 54: Australia Ambient Light Market Volume (K Unit) Forecast, by Application 2019 & 2032
- Table 55: Indonesia Ambient Light Market Revenue (Million) Forecast, by Application 2019 & 2032
- Table 56: Indonesia Ambient Light Market Volume (K Unit) Forecast, by Application 2019 & 2032
- Table 57: Phillipes Ambient Light Market Revenue (Million) Forecast, by Application 2019 & 2032
- Table 58: Phillipes Ambient Light Market Volume (K Unit) Forecast, by Application 2019 & 2032
- Table 59: Singapore Ambient Light Market Revenue (Million) Forecast, by Application 2019 & 2032
- Table 60: Singapore Ambient Light Market Volume (K Unit) Forecast, by Application 2019 & 2032
- Table 61: Thailandc Ambient Light Market Revenue (Million) Forecast, by Application 2019 & 2032
- Table 62: Thailandc Ambient Light Market Volume (K Unit) Forecast, by Application 2019 & 2032
- Table 63: Rest of Asia Pacific Ambient Light Market Revenue (Million) Forecast, by Application 2019 & 2032
- Table 64: Rest of Asia Pacific Ambient Light Market Volume (K Unit) Forecast, by Application 2019 & 2032
- Table 65: Global Ambient Light Market Revenue Million Forecast, by Country 2019 & 2032
- Table 66: Global Ambient Light Market Volume K Unit Forecast, by Country 2019 & 2032
- Table 67: Brazil Ambient Light Market Revenue (Million) Forecast, by Application 2019 & 2032
- Table 68: Brazil Ambient Light Market Volume (K Unit) Forecast, by Application 2019 & 2032
- Table 69: Argentina Ambient Light Market Revenue (Million) Forecast, by Application 2019 & 2032
- Table 70: Argentina Ambient Light Market Volume (K Unit) Forecast, by Application 2019 & 2032
- Table 71: Peru Ambient Light Market Revenue (Million) Forecast, by Application 2019 & 2032
- Table 72: Peru Ambient Light Market Volume (K Unit) Forecast, by Application 2019 & 2032
- Table 73: Chile Ambient Light Market Revenue (Million) Forecast, by Application 2019 & 2032
- Table 74: Chile Ambient Light Market Volume (K Unit) Forecast, by Application 2019 & 2032
- Table 75: Colombia Ambient Light Market Revenue (Million) Forecast, by Application 2019 & 2032
- Table 76: Colombia Ambient Light Market Volume (K Unit) Forecast, by Application 2019 & 2032
- Table 77: Ecuador Ambient Light Market Revenue (Million) Forecast, by Application 2019 & 2032
- Table 78: Ecuador Ambient Light Market Volume (K Unit) Forecast, by Application 2019 & 2032
- Table 79: Venezuela Ambient Light Market Revenue (Million) Forecast, by Application 2019 & 2032
- Table 80: Venezuela Ambient Light Market Volume (K Unit) Forecast, by Application 2019 & 2032
- Table 81: Rest of South America Ambient Light Market Revenue (Million) Forecast, by Application 2019 & 2032
- Table 82: Rest of South America Ambient Light Market Volume (K Unit) Forecast, by Application 2019 & 2032
- Table 83: Global Ambient Light Market Revenue Million Forecast, by Country 2019 & 2032
- Table 84: Global Ambient Light Market Volume K Unit Forecast, by Country 2019 & 2032
- Table 85: United States Ambient Light Market Revenue (Million) Forecast, by Application 2019 & 2032
- Table 86: United States Ambient Light Market Volume (K Unit) Forecast, by Application 2019 & 2032
- Table 87: Canada Ambient Light Market Revenue (Million) Forecast, by Application 2019 & 2032
- Table 88: Canada Ambient Light Market Volume (K Unit) Forecast, by Application 2019 & 2032
- Table 89: Mexico Ambient Light Market Revenue (Million) Forecast, by Application 2019 & 2032
- Table 90: Mexico Ambient Light Market Volume (K Unit) Forecast, by Application 2019 & 2032
- Table 91: Global Ambient Light Market Revenue Million Forecast, by Country 2019 & 2032
- Table 92: Global Ambient Light Market Volume K Unit Forecast, by Country 2019 & 2032
- Table 93: United Arab Emirates Ambient Light Market Revenue (Million) Forecast, by Application 2019 & 2032
- Table 94: United Arab Emirates Ambient Light Market Volume (K Unit) Forecast, by Application 2019 & 2032
- Table 95: Saudi Arabia Ambient Light Market Revenue (Million) Forecast, by Application 2019 & 2032
- Table 96: Saudi Arabia Ambient Light Market Volume (K Unit) Forecast, by Application 2019 & 2032
- Table 97: South Africa Ambient Light Market Revenue (Million) Forecast, by Application 2019 & 2032
- Table 98: South Africa Ambient Light Market Volume (K Unit) Forecast, by Application 2019 & 2032
- Table 99: Rest of Middle East and Africa Ambient Light Market Revenue (Million) Forecast, by Application 2019 & 2032
- Table 100: Rest of Middle East and Africa Ambient Light Market Volume (K Unit) Forecast, by Application 2019 & 2032
- Table 101: Global Ambient Light Market Revenue Million Forecast, by Offering 2019 & 2032
- Table 102: Global Ambient Light Market Volume K Unit Forecast, by Offering 2019 & 2032
- Table 103: Global Ambient Light Market Revenue Million Forecast, by Type 2019 & 2032
- Table 104: Global Ambient Light Market Volume K Unit Forecast, by Type 2019 & 2032
- Table 105: Global Ambient Light Market Revenue Million Forecast, by End User 2019 & 2032
- Table 106: Global Ambient Light Market Volume K Unit Forecast, by End User 2019 & 2032
- Table 107: Global Ambient Light Market Revenue Million Forecast, by Country 2019 & 2032
- Table 108: Global Ambient Light Market Volume K Unit Forecast, by Country 2019 & 2032
- Table 109: United States Ambient Light Market Revenue (Million) Forecast, by Application 2019 & 2032
- Table 110: United States Ambient Light Market Volume (K Unit) Forecast, by Application 2019 & 2032
- Table 111: Canada Ambient Light Market Revenue (Million) Forecast, by Application 2019 & 2032
- Table 112: Canada Ambient Light Market Volume (K Unit) Forecast, by Application 2019 & 2032
- Table 113: Global Ambient Light Market Revenue Million Forecast, by Offering 2019 & 2032
- Table 114: Global Ambient Light Market Volume K Unit Forecast, by Offering 2019 & 2032
- Table 115: Global Ambient Light Market Revenue Million Forecast, by Type 2019 & 2032
- Table 116: Global Ambient Light Market Volume K Unit Forecast, by Type 2019 & 2032
- Table 117: Global Ambient Light Market Revenue Million Forecast, by End User 2019 & 2032
- Table 118: Global Ambient Light Market Volume K Unit Forecast, by End User 2019 & 2032
- Table 119: Global Ambient Light Market Revenue Million Forecast, by Country 2019 & 2032
- Table 120: Global Ambient Light Market Volume K Unit Forecast, by Country 2019 & 2032
- Table 121: United Kingdom Ambient Light Market Revenue (Million) Forecast, by Application 2019 & 2032
- Table 122: United Kingdom Ambient Light Market Volume (K Unit) Forecast, by Application 2019 & 2032
- Table 123: Germany Ambient Light Market Revenue (Million) Forecast, by Application 2019 & 2032
- Table 124: Germany Ambient Light Market Volume (K Unit) Forecast, by Application 2019 & 2032
- Table 125: France Ambient Light Market Revenue (Million) Forecast, by Application 2019 & 2032
- Table 126: France Ambient Light Market Volume (K Unit) Forecast, by Application 2019 & 2032
- Table 127: Rest of Europe Ambient Light Market Revenue (Million) Forecast, by Application 2019 & 2032
- Table 128: Rest of Europe Ambient Light Market Volume (K Unit) Forecast, by Application 2019 & 2032
- Table 129: Global Ambient Light Market Revenue Million Forecast, by Offering 2019 & 2032
- Table 130: Global Ambient Light Market Volume K Unit Forecast, by Offering 2019 & 2032
- Table 131: Global Ambient Light Market Revenue Million Forecast, by Type 2019 & 2032
- Table 132: Global Ambient Light Market Volume K Unit Forecast, by Type 2019 & 2032
- Table 133: Global Ambient Light Market Revenue Million Forecast, by End User 2019 & 2032
- Table 134: Global Ambient Light Market Volume K Unit Forecast, by End User 2019 & 2032
- Table 135: Global Ambient Light Market Revenue Million Forecast, by Country 2019 & 2032
- Table 136: Global Ambient Light Market Volume K Unit Forecast, by Country 2019 & 2032
- Table 137: China Ambient Light Market Revenue (Million) Forecast, by Application 2019 & 2032
- Table 138: China Ambient Light Market Volume (K Unit) Forecast, by Application 2019 & 2032
- Table 139: Japan Ambient Light Market Revenue (Million) Forecast, by Application 2019 & 2032
- Table 140: Japan Ambient Light Market Volume (K Unit) Forecast, by Application 2019 & 2032
- Table 141: India Ambient Light Market Revenue (Million) Forecast, by Application 2019 & 2032
- Table 142: India Ambient Light Market Volume (K Unit) Forecast, by Application 2019 & 2032
- Table 143: Rest of Asia Pacific Ambient Light Market Revenue (Million) Forecast, by Application 2019 & 2032
- Table 144: Rest of Asia Pacific Ambient Light Market Volume (K Unit) Forecast, by Application 2019 & 2032
- Table 145: Global Ambient Light Market Revenue Million Forecast, by Offering 2019 & 2032
- Table 146: Global Ambient Light Market Volume K Unit Forecast, by Offering 2019 & 2032
- Table 147: Global Ambient Light Market Revenue Million Forecast, by Type 2019 & 2032
- Table 148: Global Ambient Light Market Volume K Unit Forecast, by Type 2019 & 2032
- Table 149: Global Ambient Light Market Revenue Million Forecast, by End User 2019 & 2032
- Table 150: Global Ambient Light Market Volume K Unit Forecast, by End User 2019 & 2032
- Table 151: Global Ambient Light Market Revenue Million Forecast, by Country 2019 & 2032
- Table 152: Global Ambient Light Market Volume K Unit Forecast, by Country 2019 & 2032
- Table 153: Latin America Ambient Light Market Revenue (Million) Forecast, by Application 2019 & 2032
- Table 154: Latin America Ambient Light Market Volume (K Unit) Forecast, by Application 2019 & 2032
- Table 155: Middle East and Africa Ambient Light Market Revenue (Million) Forecast, by Application 2019 & 2032
- Table 156: Middle East and Africa Ambient Light Market Volume (K Unit) Forecast, by Application 2019 & 2032
Frequently Asked Questions
1. What is the projected Compound Annual Growth Rate (CAGR) of the Ambient Light Market?
The projected CAGR is approximately 8.90%.
2. Which companies are prominent players in the Ambient Light Market?
Key companies in the market include Eaton Corporation Inc, Wipro Consumer Care & Lighting Ltd, SPI Lighting, Hafele America Co, v2 Lighting Group, Samsung Electronics Co Ltd, Cree Inc, Hubbell Incorporated, GE Lighting, Amerlux, Bridgelux Inc, Nulite Lighting, Louis Poulsen, Koninklijke Philips NV, Acuity Brands Inc, OSRAM Licht AG, The Zumtobel Group, Decon Lighting Pvt Ltd.
3. What are the main segments of the Ambient Light Market?
The market segments include Offering, Type, End User.
4. Can you provide details about the market size?
The market size is estimated to be USD 69.57 Million as of 2022.
5. What are some drivers contributing to market growth?
Increasing Need for Energy-efficient Lighting Solutions; Increasing Adoption of Smart Lighting; Modernization of Infrastructure.
6. What are the notable trends driving market growth?
LEDs to Hold Significant Market Share.
7. Are there any restraints impacting market growth?
Challenges Associated With LED Driver Failure and High Cost Associated With Installation.
8. Can you provide examples of recent developments in the market?
March 2022: Koninklijke Philips NV rolled out an ambient experience and flexvision display with the Azurion system. The ambient experience with the flexvision display can reduce patient anxiety during interventional treatments, improve patient-staff expertise, and enhance workflows and productivity. According to the Samsung company, the new system enables staff members to adjust the ambient lighting and sound in the room during the patient arrival and preparation phases to maintain an overall calm sensation. The solution aims to distract, inform, educate, and empower patients to minimize their anxiety, particularly before therapy.
9. What pricing options are available for accessing the report?
Pricing options include single-user, multi-user, and enterprise licenses priced at USD 4750, USD 5250, and USD 8750 respectively.
10. Is the market size provided in terms of value or volume?
The market size is provided in terms of value, measured in Million and volume, measured in K Unit.
11. Are there any specific market keywords associated with the report?
Yes, the market keyword associated with the report is "Ambient Light Market," which aids in identifying and referencing the specific market segment covered.
12. How do I determine which pricing option suits my needs best?
The pricing options vary based on user requirements and access needs. Individual users may opt for single-user licenses, while businesses requiring broader access may choose multi-user or enterprise licenses for cost-effective access to the report.
13. Are there any additional resources or data provided in the Ambient Light Market report?
While the report offers comprehensive insights, it's advisable to review the specific contents or supplementary materials provided to ascertain if additional resources or data are available.
14. How can I stay updated on further developments or reports in the Ambient Light Market?
To stay informed about further developments, trends, and reports in the Ambient Light Market, consider subscribing to industry newsletters, following relevant companies and organizations, or regularly checking reputable industry news sources and publications.
Methodology
Step 1 - Identification of Relevant Samples Size from Population Database


Step 2 - Approaches for Defining Global Market Size (Value, Volume* & Price*)

Note*: In applicable scenarios
Step 3 - Data Sources
Primary Research
- Web Analytics
- Survey Reports
- Research Institute
- Latest Research Reports
- Opinion Leaders
Secondary Research
- Annual Reports
- White Paper
- Latest Press Release
- Industry Association
- Paid Database
- Investor Presentations

Step 4 - Data Triangulation
Involves using different sources of information in order to increase the validity of a study
These sources are likely to be stakeholders in a program - participants, other researchers, program staff, other community members, and so on.
Then we put all data in single framework & apply various statistical tools to find out the dynamic on the market.
During the analysis stage, feedback from the stakeholder groups would be compared to determine areas of agreement as well as areas of divergence


