
Key Insights
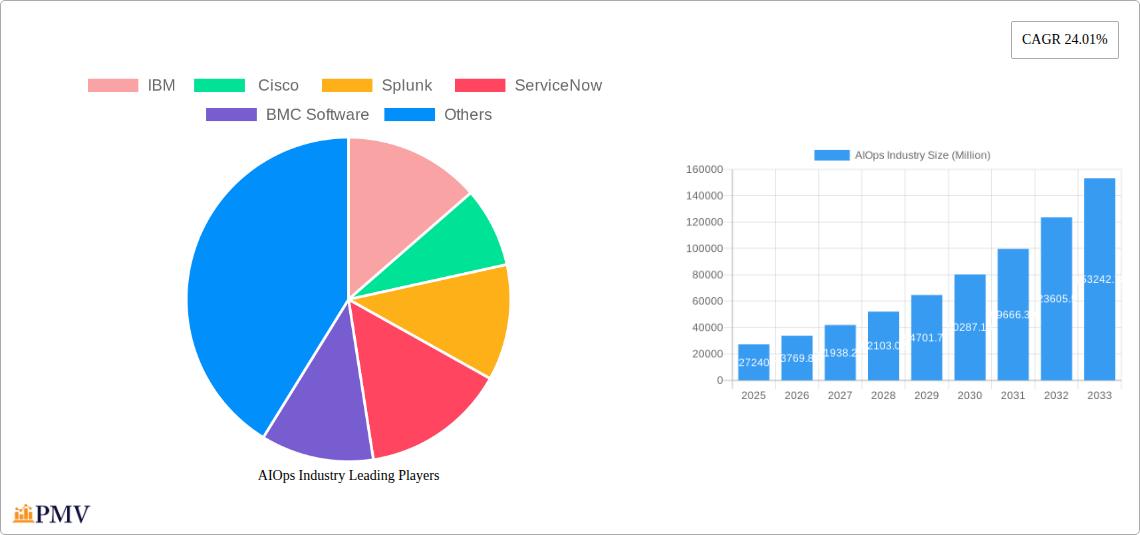
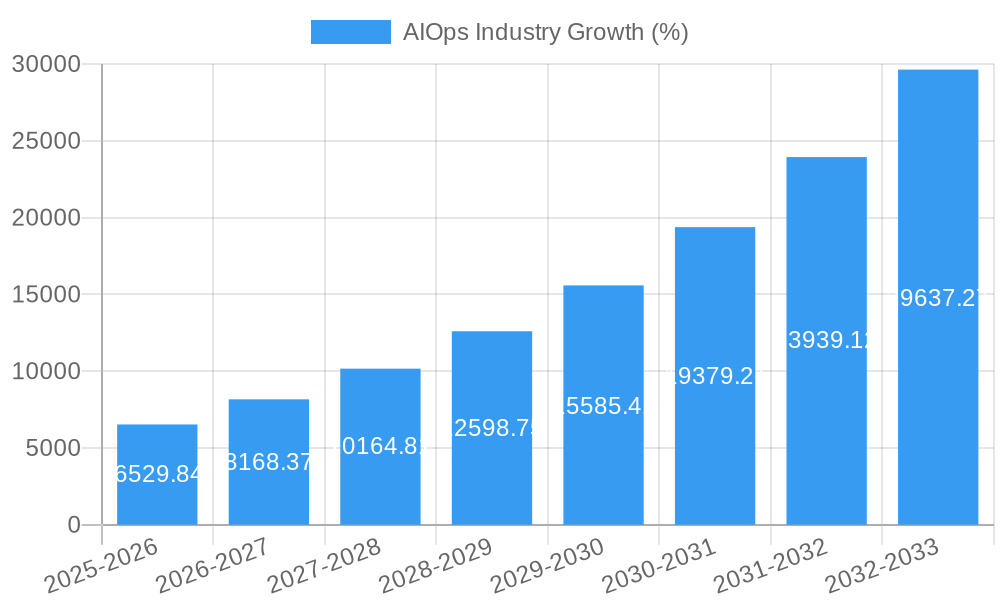
The AIOps market is experiencing robust growth, projected to reach $27.24 billion in 2025 and exhibiting a Compound Annual Growth Rate (CAGR) of 24.01%. This expansion is fueled by several key drivers. The increasing complexity of IT infrastructures, coupled with the surge in digital transformation initiatives across various industries, necessitates advanced solutions for proactive monitoring and automated remediation. Businesses are increasingly adopting cloud-based architectures and embracing DevOps methodologies, creating a significant demand for AIOps platforms to manage and optimize these dynamic environments. Furthermore, the growing need for enhanced security and improved operational efficiency is bolstering adoption rates. Major segments driving this growth include the cloud/SaaS deployment model, reflecting the preference for scalable and readily accessible solutions. The Media and Entertainment, IT and Telecom, and BFSI (Banking, Financial Services, and Insurance) sectors are leading adopters, leveraging AIOps to improve service delivery, enhance customer experience, and minimize downtime. While data scarcity limits a precise breakdown of segmental market share, it's reasonable to anticipate that cloud/SaaS and large enterprises will hold substantial proportions given the overall market trends. Competitive players like IBM, Cisco, Splunk, ServiceNow, and BMC Software are actively innovating and expanding their offerings to cater to this burgeoning market.
Looking ahead to 2033, the AIOps market is poised for continued, albeit potentially moderating, growth. While the initial CAGR of 24.01% is exceptionally high and likely to slow as the market matures, a sustained double-digit growth rate is anticipated, driven by continued technological advancements, widening adoption across various industries, and the increasing focus on digital resilience and automation. Geographical expansion, particularly in rapidly developing economies within the Asia-Pacific region, will further contribute to market expansion. However, potential restraints include the initial investment costs associated with implementation and the need for skilled professionals to effectively manage and utilize AIOps solutions. Despite these challenges, the long-term prospects for the AIOps market remain positive, presenting significant opportunities for technology providers and businesses seeking to enhance their IT operations.
AIOps Industry Market Report: 2019-2033
This comprehensive report provides a detailed analysis of the AIOps (Artificial Intelligence for IT Operations) industry, offering invaluable insights for businesses seeking to navigate this rapidly evolving market. With a study period spanning 2019-2033, a base year of 2025, and a forecast period of 2025-2033, this report delivers a robust understanding of historical trends, current market dynamics, and future growth projections. The report covers a market valued at $xx Million in 2025 and projects growth to $xx Million by 2033, representing a significant CAGR.
AIOps Industry Market Structure & Competitive Dynamics
The AIOps market is characterized by a moderately concentrated structure with several key players vying for market share. Major players like IBM, Cisco, Splunk, ServiceNow, and BMC Software dominate the landscape, accounting for an estimated xx% of the total market revenue in 2025. However, the market also features several smaller, specialized vendors contributing to innovation and market diversification. The competitive dynamics are intense, driven by continuous product innovation, strategic partnerships, and acquisitions. M&A activity in the AIOps space has been relatively active in recent years, with deal values exceeding $xx Million in the past five years, predominantly focused on expanding capabilities and market reach. The industry is subject to evolving regulatory frameworks concerning data privacy and security, which impact product development and deployment strategies. Market growth is propelled by increasing adoption across various end-user industries and the shift towards cloud-based AIOps solutions. Substitution by alternative IT management tools remains a challenge, although the unique capabilities of AIOps in automating and optimizing IT operations are creating a strong demand.
- Market Concentration: Moderately concentrated, with top 5 players holding xx% market share in 2025.
- Innovation Ecosystems: Active, with both established players and startups driving innovation.
- Regulatory Frameworks: Evolving, impacting data privacy and security aspects.
- Product Substitutes: Limited, with AIOps offering unique capabilities.
- M&A Activity: Significant, with deal values exceeding $xx Million in recent years.
- End-User Trends: Increasing adoption across diverse industries.
AIOps Industry Industry Trends & Insights
The AIOps market is experiencing robust growth, driven by several key factors. The increasing complexity of IT infrastructure, the rise of cloud computing, and the need for enhanced IT operational efficiency are primary drivers. The market is witnessing a rapid adoption of AI and machine learning technologies to automate IT processes, optimize resource allocation, and improve incident management. This trend is further amplified by the growing demand for proactive and predictive analytics capabilities to mitigate IT risks and improve service delivery. Consumer preferences are shifting towards cloud-based solutions due to scalability, cost-effectiveness, and ease of deployment. The competitive landscape remains highly dynamic, with established players continuously innovating and new entrants emerging. The market penetration of AIOps solutions is still relatively low, offering substantial growth potential across various industries and geographical regions. This trend indicates a significant projected CAGR of xx% over the forecast period.
Dominant Markets & Segments in AIOps Industry
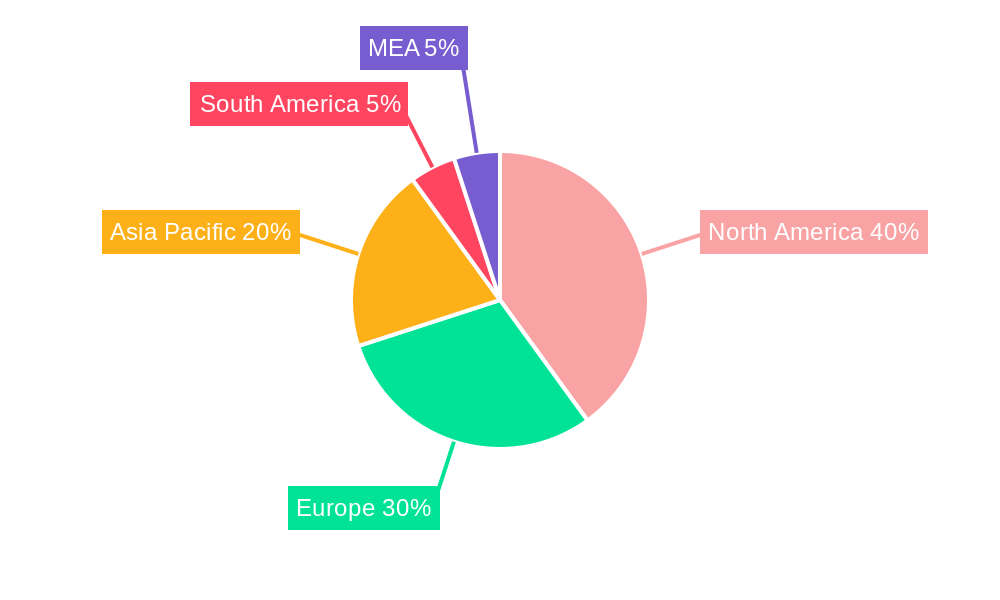
The North American region currently holds the largest market share in the AIOps industry, driven by high IT spending, early adoption of new technologies, and a well-developed IT infrastructure. However, the Asia-Pacific region is poised for significant growth due to increasing digitization and the expanding IT sector.
- Leading Region: North America.
- Key Drivers (North America): High IT spending, early technology adoption, advanced infrastructure.
- Leading Segment (Deployment): Cloud/SaaS – driven by scalability and cost-effectiveness.
- Key Drivers (Cloud/SaaS): Scalability, cost-effectiveness, ease of deployment.
- Leading Segment (End-User Industry): BFSI – high dependence on reliable IT infrastructure.
- Key Drivers (BFSI): Stringent regulatory compliance, high-value data security needs.
- Leading Segment (Organization Type): Large Enterprises – possess greater resources for adoption.
- Key Drivers (Large Enterprises): Resources for investment, complex IT infrastructure.
Within end-user industries, BFSI (Banking, Financial Services, and Insurance) showcases the highest adoption rate due to the criticality of their IT systems and the need for robust security and compliance. Large enterprises lead in AIOps adoption due to their resources and complex IT infrastructure needs. The cloud/SaaS deployment model enjoys the highest growth due to its flexibility and cost-effectiveness.
AIOps Industry Product Innovations
Recent AIOps product innovations emphasize enhanced AI/ML capabilities, improved user interfaces, and better integration with existing IT management tools. These advancements provide more comprehensive insights, automated incident resolution, and streamlined workflows, leading to increased efficiency and reduced operational costs. New applications are emerging in areas like security operations, network management, and application performance monitoring. This aligns perfectly with market demands for enhanced security and seamless IT operation across different applications and environments.
Report Segmentation & Scope
This report segments the AIOps market based on deployment (on-premise, cloud/SaaS), end-user industry (Media and Entertainment, IT and Telecom, Retail, Healthcare, BFSI, Other), and organization type (Small and Medium Enterprises, Large Enterprise). Each segment’s growth projections, market size, and competitive landscape are analyzed. The cloud/SaaS segment is projected to witness the fastest growth owing to its scalability and cost-effectiveness. The BFSI industry dominates end-user segment adoption due to stringent regulatory demands and critical reliance on IT systems. Large enterprises lead due to their substantial investment capabilities.
Key Drivers of AIOps Industry Growth
The AIOps industry is driven by the rising complexity of IT infrastructures, the increasing adoption of cloud computing, the need for improved IT operational efficiency, and the growing demand for proactive and predictive analytics. Technological advancements in AI and machine learning are significantly contributing to AIOps capabilities. Furthermore, regulatory requirements for enhanced IT security and compliance are further fueling market growth.
Challenges in the AIOps Industry Sector
Challenges include the high cost of implementation, the need for skilled professionals, data integration complexities, and the need for robust cybersecurity measures. The lack of standardization across different AIOps solutions and concerns around data privacy and security are also significant hurdles. These factors can collectively impede wider adoption and limit the market's overall growth rate. The competitive landscape and rapid technological evolution further present challenges to sustained market growth.
Leading Players in the AIOps Industry Market
Key Developments in AIOps Industry Sector
- October 2022: IBM announced version 3.5 of IBM Cloud Pak for Watson AIOps, enhancing business context data visualization and prioritization capabilities.
- September 2022: Fortinet introduced AI-based network services management for 5G/LTE gateways.
- March 2022: Deloitte launched AIOPS.D, a modular AI-powered platform for autonomous business process management.
Strategic AIOps Industry Market Outlook
The AIOps market presents significant growth opportunities. Continued technological advancements, expanding adoption across diverse industries, and increasing demand for enhanced IT efficiency will drive market expansion. Strategic partnerships, focused product innovation, and addressing the challenges related to implementation costs and skilled professionals will be crucial for success in this dynamic market. The focus on integrating AIOps solutions seamlessly with existing IT infrastructure will be key to accelerating market adoption.
AIOps Industry Segmentation
-
1. Organization Type
- 1.1. Small and Medium Enterprises
- 1.2. Large Enterprise
-
2. Deployment
- 2.1. On-Premise
- 2.2. Cloud/SaaS
-
3. End-User Industry
- 3.1. Media and Entertainment
- 3.2. IT and Telecom
- 3.3. Retail
- 3.4. Healthcare
- 3.5. BFSI
- 3.6. Other End-User Industries
AIOps Industry Segmentation By Geography
- 1. North America
- 2. Europe
- 3. Asia Pacific
- 4. Latin America
- 5. Middle East and Africa
AIOps Industry REPORT HIGHLIGHTS
| Aspects | Details |
|---|---|
| Study Period | 2019-2033 |
| Base Year | 2024 |
| Estimated Year | 2025 |
| Forecast Period | 2025-2033 |
| Historical Period | 2019-2024 |
| Growth Rate | CAGR of 24.01% from 2019-2033 |
| Segmentation |
|
Table of Contents
- 1. Introduction
- 1.1. Research Scope
- 1.2. Market Segmentation
- 1.3. Research Methodology
- 1.4. Definitions and Assumptions
- 2. Executive Summary
- 2.1. Introduction
- 3. Market Dynamics
- 3.1. Introduction
- 3.2. Market Drivers
- 3.2.1. Growing demand for AI-based services in IT operations; Increasing end-to-end business application assurance and uptime
- 3.3. Market Restrains
- 3.3.1. Increasing number of changes in IT operations
- 3.4. Market Trends
- 3.4.1. BFSI is Expected to Hold Significant Share
- 4. Market Factor Analysis
- 4.1. Porters Five Forces
- 4.2. Supply/Value Chain
- 4.3. PESTEL analysis
- 4.4. Market Entropy
- 4.5. Patent/Trademark Analysis
- 5. Global AIOps Industry Analysis, Insights and Forecast, 2019-2031
- 5.1. Market Analysis, Insights and Forecast - by Organization Type
- 5.1.1. Small and Medium Enterprises
- 5.1.2. Large Enterprise
- 5.2. Market Analysis, Insights and Forecast - by Deployment
- 5.2.1. On-Premise
- 5.2.2. Cloud/SaaS
- 5.3. Market Analysis, Insights and Forecast - by End-User Industry
- 5.3.1. Media and Entertainment
- 5.3.2. IT and Telecom
- 5.3.3. Retail
- 5.3.4. Healthcare
- 5.3.5. BFSI
- 5.3.6. Other End-User Industries
- 5.4. Market Analysis, Insights and Forecast - by Region
- 5.4.1. North America
- 5.4.2. Europe
- 5.4.3. Asia Pacific
- 5.4.4. Latin America
- 5.4.5. Middle East and Africa
- 5.1. Market Analysis, Insights and Forecast - by Organization Type
- 6. North America AIOps Industry Analysis, Insights and Forecast, 2019-2031
- 6.1. Market Analysis, Insights and Forecast - by Organization Type
- 6.1.1. Small and Medium Enterprises
- 6.1.2. Large Enterprise
- 6.2. Market Analysis, Insights and Forecast - by Deployment
- 6.2.1. On-Premise
- 6.2.2. Cloud/SaaS
- 6.3. Market Analysis, Insights and Forecast - by End-User Industry
- 6.3.1. Media and Entertainment
- 6.3.2. IT and Telecom
- 6.3.3. Retail
- 6.3.4. Healthcare
- 6.3.5. BFSI
- 6.3.6. Other End-User Industries
- 6.1. Market Analysis, Insights and Forecast - by Organization Type
- 7. Europe AIOps Industry Analysis, Insights and Forecast, 2019-2031
- 7.1. Market Analysis, Insights and Forecast - by Organization Type
- 7.1.1. Small and Medium Enterprises
- 7.1.2. Large Enterprise
- 7.2. Market Analysis, Insights and Forecast - by Deployment
- 7.2.1. On-Premise
- 7.2.2. Cloud/SaaS
- 7.3. Market Analysis, Insights and Forecast - by End-User Industry
- 7.3.1. Media and Entertainment
- 7.3.2. IT and Telecom
- 7.3.3. Retail
- 7.3.4. Healthcare
- 7.3.5. BFSI
- 7.3.6. Other End-User Industries
- 7.1. Market Analysis, Insights and Forecast - by Organization Type
- 8. Asia Pacific AIOps Industry Analysis, Insights and Forecast, 2019-2031
- 8.1. Market Analysis, Insights and Forecast - by Organization Type
- 8.1.1. Small and Medium Enterprises
- 8.1.2. Large Enterprise
- 8.2. Market Analysis, Insights and Forecast - by Deployment
- 8.2.1. On-Premise
- 8.2.2. Cloud/SaaS
- 8.3. Market Analysis, Insights and Forecast - by End-User Industry
- 8.3.1. Media and Entertainment
- 8.3.2. IT and Telecom
- 8.3.3. Retail
- 8.3.4. Healthcare
- 8.3.5. BFSI
- 8.3.6. Other End-User Industries
- 8.1. Market Analysis, Insights and Forecast - by Organization Type
- 9. Latin America AIOps Industry Analysis, Insights and Forecast, 2019-2031
- 9.1. Market Analysis, Insights and Forecast - by Organization Type
- 9.1.1. Small and Medium Enterprises
- 9.1.2. Large Enterprise
- 9.2. Market Analysis, Insights and Forecast - by Deployment
- 9.2.1. On-Premise
- 9.2.2. Cloud/SaaS
- 9.3. Market Analysis, Insights and Forecast - by End-User Industry
- 9.3.1. Media and Entertainment
- 9.3.2. IT and Telecom
- 9.3.3. Retail
- 9.3.4. Healthcare
- 9.3.5. BFSI
- 9.3.6. Other End-User Industries
- 9.1. Market Analysis, Insights and Forecast - by Organization Type
- 10. Middle East and Africa AIOps Industry Analysis, Insights and Forecast, 2019-2031
- 10.1. Market Analysis, Insights and Forecast - by Organization Type
- 10.1.1. Small and Medium Enterprises
- 10.1.2. Large Enterprise
- 10.2. Market Analysis, Insights and Forecast - by Deployment
- 10.2.1. On-Premise
- 10.2.2. Cloud/SaaS
- 10.3. Market Analysis, Insights and Forecast - by End-User Industry
- 10.3.1. Media and Entertainment
- 10.3.2. IT and Telecom
- 10.3.3. Retail
- 10.3.4. Healthcare
- 10.3.5. BFSI
- 10.3.6. Other End-User Industries
- 10.1. Market Analysis, Insights and Forecast - by Organization Type
- 11. North America AIOps Industry Analysis, Insights and Forecast, 2019-2031
- 11.1. Market Analysis, Insights and Forecast - By Country/Sub-region
- 11.1.1 United States
- 11.1.2 Canada
- 11.1.3 Mexico
- 12. Europe AIOps Industry Analysis, Insights and Forecast, 2019-2031
- 12.1. Market Analysis, Insights and Forecast - By Country/Sub-region
- 12.1.1 Germany
- 12.1.2 United Kingdom
- 12.1.3 France
- 12.1.4 Spain
- 12.1.5 Italy
- 12.1.6 Spain
- 12.1.7 Belgium
- 12.1.8 Netherland
- 12.1.9 Nordics
- 12.1.10 Rest of Europe
- 13. Asia Pacific AIOps Industry Analysis, Insights and Forecast, 2019-2031
- 13.1. Market Analysis, Insights and Forecast - By Country/Sub-region
- 13.1.1 China
- 13.1.2 Japan
- 13.1.3 India
- 13.1.4 South Korea
- 13.1.5 Southeast Asia
- 13.1.6 Australia
- 13.1.7 Indonesia
- 13.1.8 Phillipes
- 13.1.9 Singapore
- 13.1.10 Thailandc
- 13.1.11 Rest of Asia Pacific
- 14. South America AIOps Industry Analysis, Insights and Forecast, 2019-2031
- 14.1. Market Analysis, Insights and Forecast - By Country/Sub-region
- 14.1.1 Brazil
- 14.1.2 Argentina
- 14.1.3 Peru
- 14.1.4 Chile
- 14.1.5 Colombia
- 14.1.6 Ecuador
- 14.1.7 Venezuela
- 14.1.8 Rest of South America
- 15. MEA AIOps Industry Analysis, Insights and Forecast, 2019-2031
- 15.1. Market Analysis, Insights and Forecast - By Country/Sub-region
- 15.1.1 United Arab Emirates
- 15.1.2 Saudi Arabia
- 15.1.3 South Africa
- 15.1.4 Rest of Middle East and Africa
- 16. Competitive Analysis
- 16.1. Global Market Share Analysis 2024
- 16.2. Company Profiles
- 16.2.1 IBM
- 16.2.1.1. Overview
- 16.2.1.2. Products
- 16.2.1.3. SWOT Analysis
- 16.2.1.4. Recent Developments
- 16.2.1.5. Financials (Based on Availability)
- 16.2.2 Cisco
- 16.2.2.1. Overview
- 16.2.2.2. Products
- 16.2.2.3. SWOT Analysis
- 16.2.2.4. Recent Developments
- 16.2.2.5. Financials (Based on Availability)
- 16.2.3 Splunk
- 16.2.3.1. Overview
- 16.2.3.2. Products
- 16.2.3.3. SWOT Analysis
- 16.2.3.4. Recent Developments
- 16.2.3.5. Financials (Based on Availability)
- 16.2.4 ServiceNow
- 16.2.4.1. Overview
- 16.2.4.2. Products
- 16.2.4.3. SWOT Analysis
- 16.2.4.4. Recent Developments
- 16.2.4.5. Financials (Based on Availability)
- 16.2.5 BMC Software
- 16.2.5.1. Overview
- 16.2.5.2. Products
- 16.2.5.3. SWOT Analysis
- 16.2.5.4. Recent Developments
- 16.2.5.5. Financials (Based on Availability)
- 16.2.1 IBM
List of Figures
- Figure 1: Global AIOps Industry Revenue Breakdown (Million, %) by Region 2024 & 2032
- Figure 2: North America AIOps Industry Revenue (Million), by Country 2024 & 2032
- Figure 3: North America AIOps Industry Revenue Share (%), by Country 2024 & 2032
- Figure 4: Europe AIOps Industry Revenue (Million), by Country 2024 & 2032
- Figure 5: Europe AIOps Industry Revenue Share (%), by Country 2024 & 2032
- Figure 6: Asia Pacific AIOps Industry Revenue (Million), by Country 2024 & 2032
- Figure 7: Asia Pacific AIOps Industry Revenue Share (%), by Country 2024 & 2032
- Figure 8: South America AIOps Industry Revenue (Million), by Country 2024 & 2032
- Figure 9: South America AIOps Industry Revenue Share (%), by Country 2024 & 2032
- Figure 10: MEA AIOps Industry Revenue (Million), by Country 2024 & 2032
- Figure 11: MEA AIOps Industry Revenue Share (%), by Country 2024 & 2032
- Figure 12: North America AIOps Industry Revenue (Million), by Organization Type 2024 & 2032
- Figure 13: North America AIOps Industry Revenue Share (%), by Organization Type 2024 & 2032
- Figure 14: North America AIOps Industry Revenue (Million), by Deployment 2024 & 2032
- Figure 15: North America AIOps Industry Revenue Share (%), by Deployment 2024 & 2032
- Figure 16: North America AIOps Industry Revenue (Million), by End-User Industry 2024 & 2032
- Figure 17: North America AIOps Industry Revenue Share (%), by End-User Industry 2024 & 2032
- Figure 18: North America AIOps Industry Revenue (Million), by Country 2024 & 2032
- Figure 19: North America AIOps Industry Revenue Share (%), by Country 2024 & 2032
- Figure 20: Europe AIOps Industry Revenue (Million), by Organization Type 2024 & 2032
- Figure 21: Europe AIOps Industry Revenue Share (%), by Organization Type 2024 & 2032
- Figure 22: Europe AIOps Industry Revenue (Million), by Deployment 2024 & 2032
- Figure 23: Europe AIOps Industry Revenue Share (%), by Deployment 2024 & 2032
- Figure 24: Europe AIOps Industry Revenue (Million), by End-User Industry 2024 & 2032
- Figure 25: Europe AIOps Industry Revenue Share (%), by End-User Industry 2024 & 2032
- Figure 26: Europe AIOps Industry Revenue (Million), by Country 2024 & 2032
- Figure 27: Europe AIOps Industry Revenue Share (%), by Country 2024 & 2032
- Figure 28: Asia Pacific AIOps Industry Revenue (Million), by Organization Type 2024 & 2032
- Figure 29: Asia Pacific AIOps Industry Revenue Share (%), by Organization Type 2024 & 2032
- Figure 30: Asia Pacific AIOps Industry Revenue (Million), by Deployment 2024 & 2032
- Figure 31: Asia Pacific AIOps Industry Revenue Share (%), by Deployment 2024 & 2032
- Figure 32: Asia Pacific AIOps Industry Revenue (Million), by End-User Industry 2024 & 2032
- Figure 33: Asia Pacific AIOps Industry Revenue Share (%), by End-User Industry 2024 & 2032
- Figure 34: Asia Pacific AIOps Industry Revenue (Million), by Country 2024 & 2032
- Figure 35: Asia Pacific AIOps Industry Revenue Share (%), by Country 2024 & 2032
- Figure 36: Latin America AIOps Industry Revenue (Million), by Organization Type 2024 & 2032
- Figure 37: Latin America AIOps Industry Revenue Share (%), by Organization Type 2024 & 2032
- Figure 38: Latin America AIOps Industry Revenue (Million), by Deployment 2024 & 2032
- Figure 39: Latin America AIOps Industry Revenue Share (%), by Deployment 2024 & 2032
- Figure 40: Latin America AIOps Industry Revenue (Million), by End-User Industry 2024 & 2032
- Figure 41: Latin America AIOps Industry Revenue Share (%), by End-User Industry 2024 & 2032
- Figure 42: Latin America AIOps Industry Revenue (Million), by Country 2024 & 2032
- Figure 43: Latin America AIOps Industry Revenue Share (%), by Country 2024 & 2032
- Figure 44: Middle East and Africa AIOps Industry Revenue (Million), by Organization Type 2024 & 2032
- Figure 45: Middle East and Africa AIOps Industry Revenue Share (%), by Organization Type 2024 & 2032
- Figure 46: Middle East and Africa AIOps Industry Revenue (Million), by Deployment 2024 & 2032
- Figure 47: Middle East and Africa AIOps Industry Revenue Share (%), by Deployment 2024 & 2032
- Figure 48: Middle East and Africa AIOps Industry Revenue (Million), by End-User Industry 2024 & 2032
- Figure 49: Middle East and Africa AIOps Industry Revenue Share (%), by End-User Industry 2024 & 2032
- Figure 50: Middle East and Africa AIOps Industry Revenue (Million), by Country 2024 & 2032
- Figure 51: Middle East and Africa AIOps Industry Revenue Share (%), by Country 2024 & 2032
List of Tables
- Table 1: Global AIOps Industry Revenue Million Forecast, by Region 2019 & 2032
- Table 2: Global AIOps Industry Revenue Million Forecast, by Organization Type 2019 & 2032
- Table 3: Global AIOps Industry Revenue Million Forecast, by Deployment 2019 & 2032
- Table 4: Global AIOps Industry Revenue Million Forecast, by End-User Industry 2019 & 2032
- Table 5: Global AIOps Industry Revenue Million Forecast, by Region 2019 & 2032
- Table 6: Global AIOps Industry Revenue Million Forecast, by Country 2019 & 2032
- Table 7: United States AIOps Industry Revenue (Million) Forecast, by Application 2019 & 2032
- Table 8: Canada AIOps Industry Revenue (Million) Forecast, by Application 2019 & 2032
- Table 9: Mexico AIOps Industry Revenue (Million) Forecast, by Application 2019 & 2032
- Table 10: Global AIOps Industry Revenue Million Forecast, by Country 2019 & 2032
- Table 11: Germany AIOps Industry Revenue (Million) Forecast, by Application 2019 & 2032
- Table 12: United Kingdom AIOps Industry Revenue (Million) Forecast, by Application 2019 & 2032
- Table 13: France AIOps Industry Revenue (Million) Forecast, by Application 2019 & 2032
- Table 14: Spain AIOps Industry Revenue (Million) Forecast, by Application 2019 & 2032
- Table 15: Italy AIOps Industry Revenue (Million) Forecast, by Application 2019 & 2032
- Table 16: Spain AIOps Industry Revenue (Million) Forecast, by Application 2019 & 2032
- Table 17: Belgium AIOps Industry Revenue (Million) Forecast, by Application 2019 & 2032
- Table 18: Netherland AIOps Industry Revenue (Million) Forecast, by Application 2019 & 2032
- Table 19: Nordics AIOps Industry Revenue (Million) Forecast, by Application 2019 & 2032
- Table 20: Rest of Europe AIOps Industry Revenue (Million) Forecast, by Application 2019 & 2032
- Table 21: Global AIOps Industry Revenue Million Forecast, by Country 2019 & 2032
- Table 22: China AIOps Industry Revenue (Million) Forecast, by Application 2019 & 2032
- Table 23: Japan AIOps Industry Revenue (Million) Forecast, by Application 2019 & 2032
- Table 24: India AIOps Industry Revenue (Million) Forecast, by Application 2019 & 2032
- Table 25: South Korea AIOps Industry Revenue (Million) Forecast, by Application 2019 & 2032
- Table 26: Southeast Asia AIOps Industry Revenue (Million) Forecast, by Application 2019 & 2032
- Table 27: Australia AIOps Industry Revenue (Million) Forecast, by Application 2019 & 2032
- Table 28: Indonesia AIOps Industry Revenue (Million) Forecast, by Application 2019 & 2032
- Table 29: Phillipes AIOps Industry Revenue (Million) Forecast, by Application 2019 & 2032
- Table 30: Singapore AIOps Industry Revenue (Million) Forecast, by Application 2019 & 2032
- Table 31: Thailandc AIOps Industry Revenue (Million) Forecast, by Application 2019 & 2032
- Table 32: Rest of Asia Pacific AIOps Industry Revenue (Million) Forecast, by Application 2019 & 2032
- Table 33: Global AIOps Industry Revenue Million Forecast, by Country 2019 & 2032
- Table 34: Brazil AIOps Industry Revenue (Million) Forecast, by Application 2019 & 2032
- Table 35: Argentina AIOps Industry Revenue (Million) Forecast, by Application 2019 & 2032
- Table 36: Peru AIOps Industry Revenue (Million) Forecast, by Application 2019 & 2032
- Table 37: Chile AIOps Industry Revenue (Million) Forecast, by Application 2019 & 2032
- Table 38: Colombia AIOps Industry Revenue (Million) Forecast, by Application 2019 & 2032
- Table 39: Ecuador AIOps Industry Revenue (Million) Forecast, by Application 2019 & 2032
- Table 40: Venezuela AIOps Industry Revenue (Million) Forecast, by Application 2019 & 2032
- Table 41: Rest of South America AIOps Industry Revenue (Million) Forecast, by Application 2019 & 2032
- Table 42: Global AIOps Industry Revenue Million Forecast, by Country 2019 & 2032
- Table 43: United Arab Emirates AIOps Industry Revenue (Million) Forecast, by Application 2019 & 2032
- Table 44: Saudi Arabia AIOps Industry Revenue (Million) Forecast, by Application 2019 & 2032
- Table 45: South Africa AIOps Industry Revenue (Million) Forecast, by Application 2019 & 2032
- Table 46: Rest of Middle East and Africa AIOps Industry Revenue (Million) Forecast, by Application 2019 & 2032
- Table 47: Global AIOps Industry Revenue Million Forecast, by Organization Type 2019 & 2032
- Table 48: Global AIOps Industry Revenue Million Forecast, by Deployment 2019 & 2032
- Table 49: Global AIOps Industry Revenue Million Forecast, by End-User Industry 2019 & 2032
- Table 50: Global AIOps Industry Revenue Million Forecast, by Country 2019 & 2032
- Table 51: Global AIOps Industry Revenue Million Forecast, by Organization Type 2019 & 2032
- Table 52: Global AIOps Industry Revenue Million Forecast, by Deployment 2019 & 2032
- Table 53: Global AIOps Industry Revenue Million Forecast, by End-User Industry 2019 & 2032
- Table 54: Global AIOps Industry Revenue Million Forecast, by Country 2019 & 2032
- Table 55: Global AIOps Industry Revenue Million Forecast, by Organization Type 2019 & 2032
- Table 56: Global AIOps Industry Revenue Million Forecast, by Deployment 2019 & 2032
- Table 57: Global AIOps Industry Revenue Million Forecast, by End-User Industry 2019 & 2032
- Table 58: Global AIOps Industry Revenue Million Forecast, by Country 2019 & 2032
- Table 59: Global AIOps Industry Revenue Million Forecast, by Organization Type 2019 & 2032
- Table 60: Global AIOps Industry Revenue Million Forecast, by Deployment 2019 & 2032
- Table 61: Global AIOps Industry Revenue Million Forecast, by End-User Industry 2019 & 2032
- Table 62: Global AIOps Industry Revenue Million Forecast, by Country 2019 & 2032
- Table 63: Global AIOps Industry Revenue Million Forecast, by Organization Type 2019 & 2032
- Table 64: Global AIOps Industry Revenue Million Forecast, by Deployment 2019 & 2032
- Table 65: Global AIOps Industry Revenue Million Forecast, by End-User Industry 2019 & 2032
- Table 66: Global AIOps Industry Revenue Million Forecast, by Country 2019 & 2032
Frequently Asked Questions
1. What is the projected Compound Annual Growth Rate (CAGR) of the AIOps Industry?
The projected CAGR is approximately 24.01%.
2. Which companies are prominent players in the AIOps Industry?
Key companies in the market include IBM , Cisco , Splunk , ServiceNow , BMC Software.
3. What are the main segments of the AIOps Industry?
The market segments include Organization Type, Deployment, End-User Industry.
4. Can you provide details about the market size?
The market size is estimated to be USD 27.24 Million as of 2022.
5. What are some drivers contributing to market growth?
Growing demand for AI-based services in IT operations; Increasing end-to-end business application assurance and uptime.
6. What are the notable trends driving market growth?
BFSI is Expected to Hold Significant Share.
7. Are there any restraints impacting market growth?
Increasing number of changes in IT operations.
8. Can you provide examples of recent developments in the market?
October 2022- IBM announced version 3.5 availability of the IBM Cloud Pak for Watson AIOps. With an emphasis on the capability to assist the users in understanding priorities among all IT stories in the context of a business line or service, IBM Cloud Pak for Watson AIOps v3.5 seeks to close this gap. Business context data is made available on an AIOps Insights Dashboard by Cloud Pak for Watson AIOps v3.5, a new offering feature in this release. It provides an illustration of the buyer context for the stakeholders to link business key performance indicators (KPIs) to application problems and rank repair options according to their potential effect.
9. What pricing options are available for accessing the report?
Pricing options include single-user, multi-user, and enterprise licenses priced at USD 4750, USD 5250, and USD 8750 respectively.
10. Is the market size provided in terms of value or volume?
The market size is provided in terms of value, measured in Million.
11. Are there any specific market keywords associated with the report?
Yes, the market keyword associated with the report is "AIOps Industry," which aids in identifying and referencing the specific market segment covered.
12. How do I determine which pricing option suits my needs best?
The pricing options vary based on user requirements and access needs. Individual users may opt for single-user licenses, while businesses requiring broader access may choose multi-user or enterprise licenses for cost-effective access to the report.
13. Are there any additional resources or data provided in the AIOps Industry report?
While the report offers comprehensive insights, it's advisable to review the specific contents or supplementary materials provided to ascertain if additional resources or data are available.
14. How can I stay updated on further developments or reports in the AIOps Industry?
To stay informed about further developments, trends, and reports in the AIOps Industry, consider subscribing to industry newsletters, following relevant companies and organizations, or regularly checking reputable industry news sources and publications.
Methodology
Step 1 - Identification of Relevant Samples Size from Population Database


Step 2 - Approaches for Defining Global Market Size (Value, Volume* & Price*)

Note*: In applicable scenarios
Step 3 - Data Sources
Primary Research
- Web Analytics
- Survey Reports
- Research Institute
- Latest Research Reports
- Opinion Leaders
Secondary Research
- Annual Reports
- White Paper
- Latest Press Release
- Industry Association
- Paid Database
- Investor Presentations

Step 4 - Data Triangulation
Involves using different sources of information in order to increase the validity of a study
These sources are likely to be stakeholders in a program - participants, other researchers, program staff, other community members, and so on.
Then we put all data in single framework & apply various statistical tools to find out the dynamic on the market.
During the analysis stage, feedback from the stakeholder groups would be compared to determine areas of agreement as well as areas of divergence


