
Key Insights
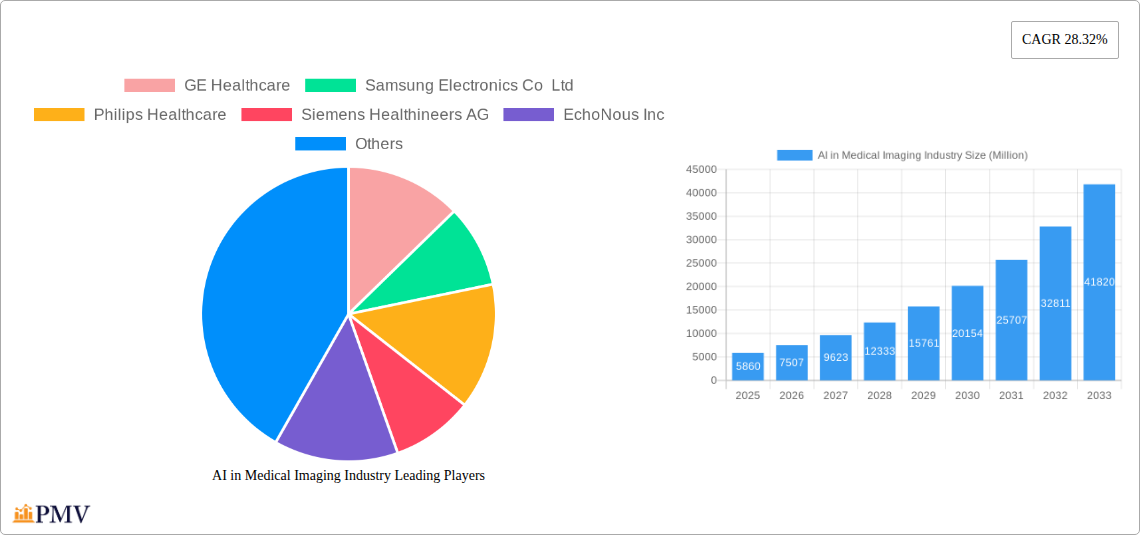
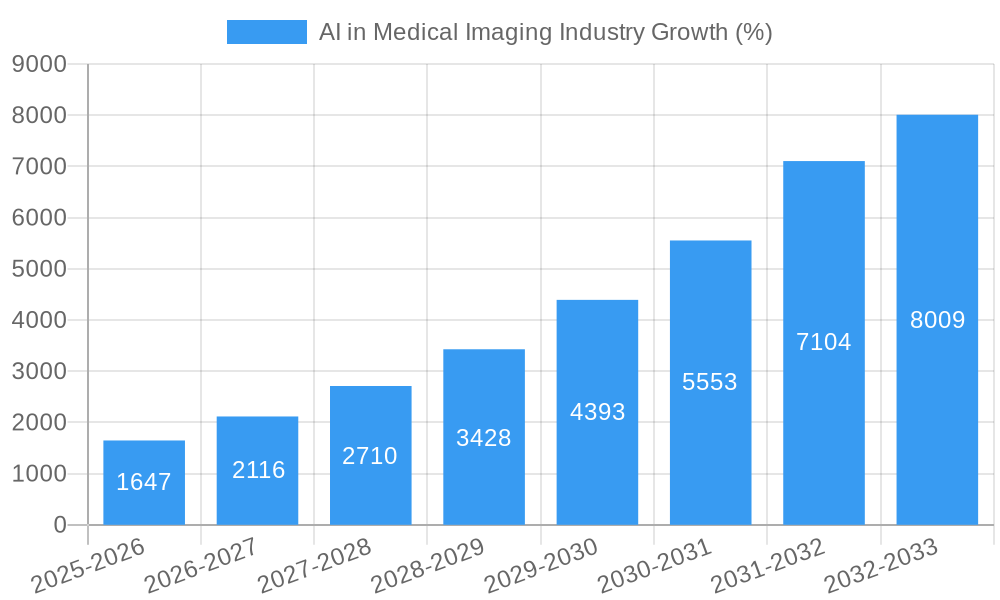
The AI in medical imaging market is experiencing explosive growth, projected to reach a substantial size driven by several key factors. The market's Compound Annual Growth Rate (CAGR) of 28.32% from 2019-2033 indicates a significant upward trajectory, fueled by increasing adoption of AI-powered diagnostic tools across healthcare settings. This rapid expansion is primarily attributed to the ability of AI to improve diagnostic accuracy, expedite workflows, and enhance overall efficiency in medical imaging analysis. Hospitals and clinics are increasingly embracing AI solutions to reduce diagnostic errors, improve patient care, and streamline operations. The substantial investment from major players like GE Healthcare, Philips Healthcare, and Siemens Healthineers, alongside innovative startups like Zebra Medical Vision and Enlitic, demonstrates the significant commercial potential and technological advancements within this sector. The market segmentation reveals strong growth across various imaging modalities, including X-ray, CT, MRI, and ultrasound, indicating a broad-based adoption of AI across the medical imaging spectrum. Technological advancements leading to improved algorithms and increased computing power further contribute to market expansion.
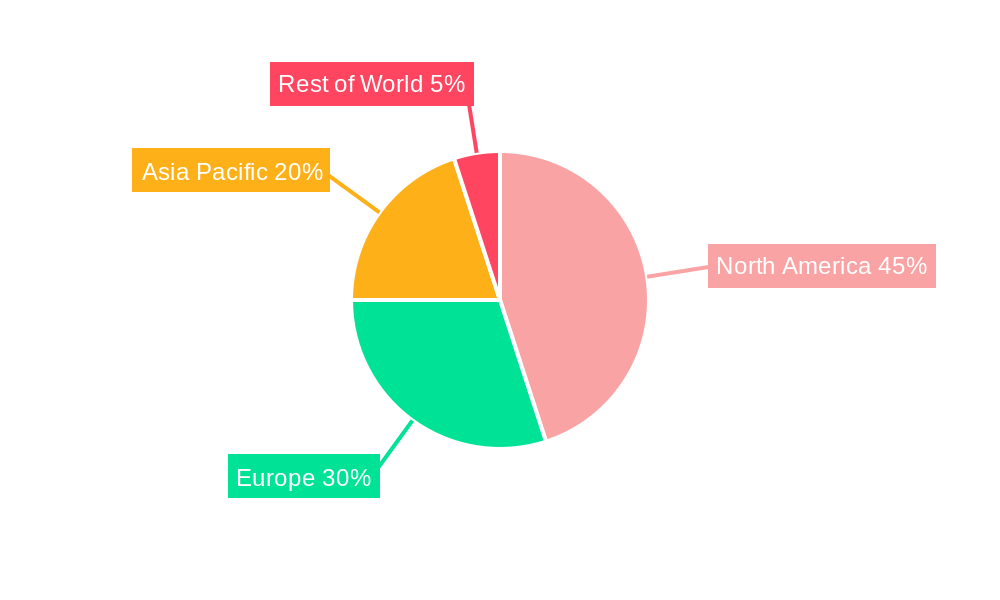
The North American market currently holds a significant share due to early adoption and substantial technological infrastructure. However, the Asia-Pacific region is poised for rapid growth, driven by increasing healthcare expenditure and a rising prevalence of chronic diseases. The competitive landscape is dynamic, with both established medical technology giants and emerging AI-focused companies vying for market dominance. Strategic partnerships, mergers and acquisitions, and the continuous development of cutting-edge algorithms are shaping the competitive dynamics. While data privacy and regulatory concerns pose challenges, the overall market outlook remains exceptionally positive, with continued innovation and adoption expected to propel growth throughout the forecast period. The market's future will likely be shaped by advancements in deep learning, cloud-based solutions, and the integration of AI into existing healthcare IT infrastructure.
AI in Medical Imaging Industry: A Comprehensive Market Report (2019-2033)
This comprehensive report provides a detailed analysis of the AI in Medical Imaging industry, offering valuable insights for stakeholders seeking to understand and capitalize on this rapidly evolving market. With a study period spanning 2019-2033, a base year of 2025, and a forecast period of 2025-2033, this report leverages extensive market research and data analysis to deliver actionable intelligence. The market is projected to reach xx Million by 2033, exhibiting a robust CAGR of xx%.
AI in Medical Imaging Industry Market Structure & Competitive Dynamics
The AI in Medical Imaging market is characterized by a dynamic interplay of established players and emerging innovators. Market concentration is moderate, with a few large players like GE Healthcare, Philips Healthcare, and Siemens Healthineers AG holding significant market share, while numerous smaller companies are driving innovation through specialized solutions. The market exhibits a highly fragmented landscape with numerous smaller companies competing fiercely for market share. Innovation ecosystems are thriving, fueled by collaborations between technology companies, healthcare providers, and research institutions. Regulatory frameworks, particularly those related to data privacy and algorithm validation, are evolving rapidly, impacting market dynamics. Product substitutes are limited, primarily older diagnostic methods, but AI-driven solutions are gradually replacing them due to improved accuracy and efficiency. End-user trends indicate a growing preference for AI-powered solutions that enhance diagnostic accuracy, improve workflow efficiency, and enable personalized medicine. M&A activity is significant, with several large acquisitions driving consolidation and accelerating technological advancement. Deal values are estimated to have exceeded xx Million in the past five years. Notable examples include the acquisition of Medo by Exo in July 2022. Further analysis reveals that the market share of the top 5 players is approximately xx%, while the remaining xx% is distributed among numerous smaller entities.
AI in Medical Imaging Industry Industry Trends & Insights
The AI in Medical Imaging market is experiencing exponential growth, driven by several key factors. Technological advancements, including deep learning and computer vision, are continuously improving the accuracy and speed of image analysis. The increasing prevalence of chronic diseases, coupled with the growing demand for efficient and accurate diagnosis, is fueling market expansion. Consumer preferences are shifting toward AI-powered solutions that provide faster results, personalized care, and improved diagnostic accuracy. Competitive dynamics are intensifying, with companies investing heavily in R&D to develop innovative solutions and expand their market reach. The market is witnessing increased adoption of cloud-based solutions, enabling scalability and accessibility for healthcare providers. The integration of AI into existing medical imaging workflows is streamlining operations and reducing costs. Overall, the market is poised for sustained growth, with a projected CAGR of xx% during the forecast period. Market penetration of AI-powered solutions is increasing significantly in developed regions, reaching xx% in 2024.
Dominant Markets & Segments in AI in Medical Imaging Industry
Leading Region: North America currently holds the largest market share, driven by high adoption rates, advanced healthcare infrastructure, and significant investments in AI technology. Europe follows closely, with a substantial and growing market.
Dominant Segment (By Offering): Software tools and platforms constitute the largest segment, due to the rising demand for flexible and scalable AI-powered solutions. Services segment is also showing substantial growth due to the increasing need for customization, training, and support.
Dominant Segment (By Image Acquisition Technology): Computed Tomography (CT) and Magnetic Resonance Imaging (MRI) currently dominate due to their extensive use in various diagnostic procedures. However, ultrasound imaging is witnessing rapid growth due to its cost-effectiveness and accessibility.
Dominant Segment (By End User): Hospitals and clinics comprise the largest end-user segment owing to their high demand for advanced diagnostic tools. Research laboratories and diagnostic centers are also contributing significantly to market growth.
Key Drivers: Economic policies supporting healthcare infrastructure development and digital transformation significantly impact market growth. Investments in AI research and development, along with favorable regulatory frameworks, are fostering innovation and adoption. The increasing accessibility of advanced imaging modalities and AI-powered analytics platforms is further boosting market expansion.
AI in Medical Imaging Industry Product Innovations
Recent product innovations highlight the integration of deep learning algorithms for improved image segmentation, detection of subtle anomalies, and quantitative image analysis. AI-powered platforms are being integrated with existing Picture Archiving and Communication Systems (PACS), improving workflow efficiency and collaboration. The development of user-friendly interfaces and cloud-based solutions is driving wider adoption across diverse healthcare settings. These innovations offer significant advantages, including enhanced diagnostic accuracy, reduced human error, and faster turnaround times, making them highly attractive to healthcare providers.
Report Segmentation & Scope
This report segments the AI in Medical Imaging market across various parameters:
By Offering: Software tools/platforms and services, with detailed market size and growth projections for each. Competitive dynamics are analyzed for both segments.
By Image Acquisition Technology: X-Ray, Computed Tomography (CT), Magnetic Resonance Imaging (MRI), Ultrasound Imaging, and Molecular Imaging, providing insights into market size, growth trends, and competitive landscape for each technology.
By End User: Hospitals, clinics, research laboratories & diagnostic centers, and other end users, with detailed analysis of market size, growth projections, and competitive dynamics within each end-user segment.
Key Drivers of AI in Medical Imaging Industry Growth
Several factors drive the growth of the AI in Medical Imaging industry. Technological advancements, particularly in deep learning and computer vision, significantly enhance diagnostic accuracy and efficiency. Increasing government investments in healthcare infrastructure and digital health initiatives create a supportive ecosystem. Favorable regulatory policies promoting the adoption of AI in healthcare accelerate market growth. Rising prevalence of chronic diseases necessitates the need for improved diagnostic tools and faster turnaround times, boosting demand for AI-powered solutions.
Challenges in the AI in Medical Imaging Industry Sector
The AI in Medical Imaging industry faces significant challenges. Regulatory hurdles related to data privacy, algorithm validation, and clinical trial requirements can slow down market growth. Supply chain disruptions, particularly concerning the availability of specialized hardware and software components, pose a significant constraint. Intense competitive pressures from both established players and emerging startups require ongoing innovation and adaptability to maintain market share. Furthermore, the need for skilled professionals to develop, implement, and maintain AI systems presents a significant challenge for market expansion. These challenges are estimated to impact market growth by approximately xx% in the short term.
Leading Players in the AI in Medical Imaging Industry Market
- GE Healthcare
- Samsung Electronics Co Ltd
- Philips Healthcare
- Siemens Healthineers AG
- EchoNous Inc
- BenevolentAI Limited
- Oxipit ai
- Zebra Medical Vision Inc
- Medtronic Plc
- Enlitic Inc
- Nvidia Corporation
- IBM Watson Health
Key Developments in AI in Medical Imaging Industry Sector
November 2022: Royal Philips showcased AI-powered diagnostic equipment and workflow solutions at the RSNA conference, demonstrating advancements in patient-centric imaging services.
July 2022: Exo acquired Medo, a Canadian AI technology developer, to enhance its ultrasound imaging platform with Medo's Sweep AI technology, expanding accessibility to a broader range of healthcare providers.
Strategic AI in Medical Imaging Industry Market Outlook
The AI in Medical Imaging market is poised for significant growth in the coming years. Continued technological advancements, expanding applications across various medical specialties, and increasing adoption by healthcare providers will drive market expansion. Strategic partnerships and collaborations between technology companies and healthcare institutions are likely to accelerate innovation and market penetration. Opportunities exist in developing personalized diagnostic solutions, integrating AI with other healthcare technologies, and addressing the regulatory and ethical considerations surrounding AI in healthcare. The market’s future hinges on addressing challenges around data security and regulatory compliance while simultaneously enhancing the user-friendliness and accessibility of AI-powered diagnostic tools.
AI in Medical Imaging Industry Segmentation
-
1. Offering
- 1.1. Software Tools/Platform
- 1.2. Services
-
2. Image Acquisition Technology
- 2.1. X-Ray
- 2.2. Computed Tomography
- 2.3. Magnetic Resonance Imaging
- 2.4. Ultrasound Imaging
- 2.5. Molecular Imaging
-
3. End User
- 3.1. Hospitals
- 3.2. Clinics
- 3.3. Research Laboratories & Diagnostic Centers
- 3.4. Other End Users
AI in Medical Imaging Industry Segmentation By Geography
-
1. North America
- 1.1. United States
- 1.2. Canada
-
2. Europe
- 2.1. Germany
- 2.2. France
- 2.3. United Kingdom
- 2.4. Rest of Europe
-
3. Asia Pacific
- 3.1. India
- 3.2. China
- 3.3. Japan
- 3.4. Rest of Asia Pacific
- 4. Rest of the World
AI in Medical Imaging Industry REPORT HIGHLIGHTS
| Aspects | Details |
|---|---|
| Study Period | 2019-2033 |
| Base Year | 2024 |
| Estimated Year | 2025 |
| Forecast Period | 2025-2033 |
| Historical Period | 2019-2024 |
| Growth Rate | CAGR of 28.32% from 2019-2033 |
| Segmentation |
|
Table of Contents
- 1. Introduction
- 1.1. Research Scope
- 1.2. Market Segmentation
- 1.3. Research Methodology
- 1.4. Definitions and Assumptions
- 2. Executive Summary
- 2.1. Introduction
- 3. Market Dynamics
- 3.1. Introduction
- 3.2. Market Drivers
- 3.2.1. Increasing Imaging Volumes
- 3.3. Market Restrains
- 3.3.1. Increasing Complexity Coupled with High Initial Costs and Maintenance Costs
- 3.4. Market Trends
- 3.4.1. Computed Tomography is Expected to Drive the Market Growth
- 4. Market Factor Analysis
- 4.1. Porters Five Forces
- 4.2. Supply/Value Chain
- 4.3. PESTEL analysis
- 4.4. Market Entropy
- 4.5. Patent/Trademark Analysis
- 5. Global AI in Medical Imaging Industry Analysis, Insights and Forecast, 2019-2031
- 5.1. Market Analysis, Insights and Forecast - by Offering
- 5.1.1. Software Tools/Platform
- 5.1.2. Services
- 5.2. Market Analysis, Insights and Forecast - by Image Acquisition Technology
- 5.2.1. X-Ray
- 5.2.2. Computed Tomography
- 5.2.3. Magnetic Resonance Imaging
- 5.2.4. Ultrasound Imaging
- 5.2.5. Molecular Imaging
- 5.3. Market Analysis, Insights and Forecast - by End User
- 5.3.1. Hospitals
- 5.3.2. Clinics
- 5.3.3. Research Laboratories & Diagnostic Centers
- 5.3.4. Other End Users
- 5.4. Market Analysis, Insights and Forecast - by Region
- 5.4.1. North America
- 5.4.2. Europe
- 5.4.3. Asia Pacific
- 5.4.4. Rest of the World
- 5.1. Market Analysis, Insights and Forecast - by Offering
- 6. North America AI in Medical Imaging Industry Analysis, Insights and Forecast, 2019-2031
- 6.1. Market Analysis, Insights and Forecast - by Offering
- 6.1.1. Software Tools/Platform
- 6.1.2. Services
- 6.2. Market Analysis, Insights and Forecast - by Image Acquisition Technology
- 6.2.1. X-Ray
- 6.2.2. Computed Tomography
- 6.2.3. Magnetic Resonance Imaging
- 6.2.4. Ultrasound Imaging
- 6.2.5. Molecular Imaging
- 6.3. Market Analysis, Insights and Forecast - by End User
- 6.3.1. Hospitals
- 6.3.2. Clinics
- 6.3.3. Research Laboratories & Diagnostic Centers
- 6.3.4. Other End Users
- 6.1. Market Analysis, Insights and Forecast - by Offering
- 7. Europe AI in Medical Imaging Industry Analysis, Insights and Forecast, 2019-2031
- 7.1. Market Analysis, Insights and Forecast - by Offering
- 7.1.1. Software Tools/Platform
- 7.1.2. Services
- 7.2. Market Analysis, Insights and Forecast - by Image Acquisition Technology
- 7.2.1. X-Ray
- 7.2.2. Computed Tomography
- 7.2.3. Magnetic Resonance Imaging
- 7.2.4. Ultrasound Imaging
- 7.2.5. Molecular Imaging
- 7.3. Market Analysis, Insights and Forecast - by End User
- 7.3.1. Hospitals
- 7.3.2. Clinics
- 7.3.3. Research Laboratories & Diagnostic Centers
- 7.3.4. Other End Users
- 7.1. Market Analysis, Insights and Forecast - by Offering
- 8. Asia Pacific AI in Medical Imaging Industry Analysis, Insights and Forecast, 2019-2031
- 8.1. Market Analysis, Insights and Forecast - by Offering
- 8.1.1. Software Tools/Platform
- 8.1.2. Services
- 8.2. Market Analysis, Insights and Forecast - by Image Acquisition Technology
- 8.2.1. X-Ray
- 8.2.2. Computed Tomography
- 8.2.3. Magnetic Resonance Imaging
- 8.2.4. Ultrasound Imaging
- 8.2.5. Molecular Imaging
- 8.3. Market Analysis, Insights and Forecast - by End User
- 8.3.1. Hospitals
- 8.3.2. Clinics
- 8.3.3. Research Laboratories & Diagnostic Centers
- 8.3.4. Other End Users
- 8.1. Market Analysis, Insights and Forecast - by Offering
- 9. Rest of the World AI in Medical Imaging Industry Analysis, Insights and Forecast, 2019-2031
- 9.1. Market Analysis, Insights and Forecast - by Offering
- 9.1.1. Software Tools/Platform
- 9.1.2. Services
- 9.2. Market Analysis, Insights and Forecast - by Image Acquisition Technology
- 9.2.1. X-Ray
- 9.2.2. Computed Tomography
- 9.2.3. Magnetic Resonance Imaging
- 9.2.4. Ultrasound Imaging
- 9.2.5. Molecular Imaging
- 9.3. Market Analysis, Insights and Forecast - by End User
- 9.3.1. Hospitals
- 9.3.2. Clinics
- 9.3.3. Research Laboratories & Diagnostic Centers
- 9.3.4. Other End Users
- 9.1. Market Analysis, Insights and Forecast - by Offering
- 10. North America AI in Medical Imaging Industry Analysis, Insights and Forecast, 2019-2031
- 10.1. Market Analysis, Insights and Forecast - By Country/Sub-region
- 10.1.1 United States
- 10.1.2 Canada
- 11. Europe AI in Medical Imaging Industry Analysis, Insights and Forecast, 2019-2031
- 11.1. Market Analysis, Insights and Forecast - By Country/Sub-region
- 11.1.1 Germany
- 11.1.2 France
- 11.1.3 United Kingdom
- 11.1.4 Rest of Europe
- 12. Asia Pacific AI in Medical Imaging Industry Analysis, Insights and Forecast, 2019-2031
- 12.1. Market Analysis, Insights and Forecast - By Country/Sub-region
- 12.1.1 India
- 12.1.2 China
- 12.1.3 Japan
- 12.1.4 Rest of Asia Pacific
- 13. Rest of the World AI in Medical Imaging Industry Analysis, Insights and Forecast, 2019-2031
- 13.1. Market Analysis, Insights and Forecast - By Country/Sub-region
- 13.1.1.
- 14. Competitive Analysis
- 14.1. Global Market Share Analysis 2024
- 14.2. Company Profiles
- 14.2.1 GE Healthcare
- 14.2.1.1. Overview
- 14.2.1.2. Products
- 14.2.1.3. SWOT Analysis
- 14.2.1.4. Recent Developments
- 14.2.1.5. Financials (Based on Availability)
- 14.2.2 Samsung Electronics Co Ltd
- 14.2.2.1. Overview
- 14.2.2.2. Products
- 14.2.2.3. SWOT Analysis
- 14.2.2.4. Recent Developments
- 14.2.2.5. Financials (Based on Availability)
- 14.2.3 Philips Healthcare
- 14.2.3.1. Overview
- 14.2.3.2. Products
- 14.2.3.3. SWOT Analysis
- 14.2.3.4. Recent Developments
- 14.2.3.5. Financials (Based on Availability)
- 14.2.4 Siemens Healthineers AG
- 14.2.4.1. Overview
- 14.2.4.2. Products
- 14.2.4.3. SWOT Analysis
- 14.2.4.4. Recent Developments
- 14.2.4.5. Financials (Based on Availability)
- 14.2.5 EchoNous Inc
- 14.2.5.1. Overview
- 14.2.5.2. Products
- 14.2.5.3. SWOT Analysis
- 14.2.5.4. Recent Developments
- 14.2.5.5. Financials (Based on Availability)
- 14.2.6 BenevolentAI Limited
- 14.2.6.1. Overview
- 14.2.6.2. Products
- 14.2.6.3. SWOT Analysis
- 14.2.6.4. Recent Developments
- 14.2.6.5. Financials (Based on Availability)
- 14.2.7 Oxipit ai*List Not Exhaustive
- 14.2.7.1. Overview
- 14.2.7.2. Products
- 14.2.7.3. SWOT Analysis
- 14.2.7.4. Recent Developments
- 14.2.7.5. Financials (Based on Availability)
- 14.2.8 Zebra Medical Vision Inc
- 14.2.8.1. Overview
- 14.2.8.2. Products
- 14.2.8.3. SWOT Analysis
- 14.2.8.4. Recent Developments
- 14.2.8.5. Financials (Based on Availability)
- 14.2.9 Medtronic Plc
- 14.2.9.1. Overview
- 14.2.9.2. Products
- 14.2.9.3. SWOT Analysis
- 14.2.9.4. Recent Developments
- 14.2.9.5. Financials (Based on Availability)
- 14.2.10 Enlitic Inc
- 14.2.10.1. Overview
- 14.2.10.2. Products
- 14.2.10.3. SWOT Analysis
- 14.2.10.4. Recent Developments
- 14.2.10.5. Financials (Based on Availability)
- 14.2.11 Nvidia Corporation
- 14.2.11.1. Overview
- 14.2.11.2. Products
- 14.2.11.3. SWOT Analysis
- 14.2.11.4. Recent Developments
- 14.2.11.5. Financials (Based on Availability)
- 14.2.12 IBM Watson Health
- 14.2.12.1. Overview
- 14.2.12.2. Products
- 14.2.12.3. SWOT Analysis
- 14.2.12.4. Recent Developments
- 14.2.12.5. Financials (Based on Availability)
- 14.2.1 GE Healthcare
List of Figures
- Figure 1: Global AI in Medical Imaging Industry Revenue Breakdown (Million, %) by Region 2024 & 2032
- Figure 2: North America AI in Medical Imaging Industry Revenue (Million), by Country 2024 & 2032
- Figure 3: North America AI in Medical Imaging Industry Revenue Share (%), by Country 2024 & 2032
- Figure 4: Europe AI in Medical Imaging Industry Revenue (Million), by Country 2024 & 2032
- Figure 5: Europe AI in Medical Imaging Industry Revenue Share (%), by Country 2024 & 2032
- Figure 6: Asia Pacific AI in Medical Imaging Industry Revenue (Million), by Country 2024 & 2032
- Figure 7: Asia Pacific AI in Medical Imaging Industry Revenue Share (%), by Country 2024 & 2032
- Figure 8: Rest of the World AI in Medical Imaging Industry Revenue (Million), by Country 2024 & 2032
- Figure 9: Rest of the World AI in Medical Imaging Industry Revenue Share (%), by Country 2024 & 2032
- Figure 10: North America AI in Medical Imaging Industry Revenue (Million), by Offering 2024 & 2032
- Figure 11: North America AI in Medical Imaging Industry Revenue Share (%), by Offering 2024 & 2032
- Figure 12: North America AI in Medical Imaging Industry Revenue (Million), by Image Acquisition Technology 2024 & 2032
- Figure 13: North America AI in Medical Imaging Industry Revenue Share (%), by Image Acquisition Technology 2024 & 2032
- Figure 14: North America AI in Medical Imaging Industry Revenue (Million), by End User 2024 & 2032
- Figure 15: North America AI in Medical Imaging Industry Revenue Share (%), by End User 2024 & 2032
- Figure 16: North America AI in Medical Imaging Industry Revenue (Million), by Country 2024 & 2032
- Figure 17: North America AI in Medical Imaging Industry Revenue Share (%), by Country 2024 & 2032
- Figure 18: Europe AI in Medical Imaging Industry Revenue (Million), by Offering 2024 & 2032
- Figure 19: Europe AI in Medical Imaging Industry Revenue Share (%), by Offering 2024 & 2032
- Figure 20: Europe AI in Medical Imaging Industry Revenue (Million), by Image Acquisition Technology 2024 & 2032
- Figure 21: Europe AI in Medical Imaging Industry Revenue Share (%), by Image Acquisition Technology 2024 & 2032
- Figure 22: Europe AI in Medical Imaging Industry Revenue (Million), by End User 2024 & 2032
- Figure 23: Europe AI in Medical Imaging Industry Revenue Share (%), by End User 2024 & 2032
- Figure 24: Europe AI in Medical Imaging Industry Revenue (Million), by Country 2024 & 2032
- Figure 25: Europe AI in Medical Imaging Industry Revenue Share (%), by Country 2024 & 2032
- Figure 26: Asia Pacific AI in Medical Imaging Industry Revenue (Million), by Offering 2024 & 2032
- Figure 27: Asia Pacific AI in Medical Imaging Industry Revenue Share (%), by Offering 2024 & 2032
- Figure 28: Asia Pacific AI in Medical Imaging Industry Revenue (Million), by Image Acquisition Technology 2024 & 2032
- Figure 29: Asia Pacific AI in Medical Imaging Industry Revenue Share (%), by Image Acquisition Technology 2024 & 2032
- Figure 30: Asia Pacific AI in Medical Imaging Industry Revenue (Million), by End User 2024 & 2032
- Figure 31: Asia Pacific AI in Medical Imaging Industry Revenue Share (%), by End User 2024 & 2032
- Figure 32: Asia Pacific AI in Medical Imaging Industry Revenue (Million), by Country 2024 & 2032
- Figure 33: Asia Pacific AI in Medical Imaging Industry Revenue Share (%), by Country 2024 & 2032
- Figure 34: Rest of the World AI in Medical Imaging Industry Revenue (Million), by Offering 2024 & 2032
- Figure 35: Rest of the World AI in Medical Imaging Industry Revenue Share (%), by Offering 2024 & 2032
- Figure 36: Rest of the World AI in Medical Imaging Industry Revenue (Million), by Image Acquisition Technology 2024 & 2032
- Figure 37: Rest of the World AI in Medical Imaging Industry Revenue Share (%), by Image Acquisition Technology 2024 & 2032
- Figure 38: Rest of the World AI in Medical Imaging Industry Revenue (Million), by End User 2024 & 2032
- Figure 39: Rest of the World AI in Medical Imaging Industry Revenue Share (%), by End User 2024 & 2032
- Figure 40: Rest of the World AI in Medical Imaging Industry Revenue (Million), by Country 2024 & 2032
- Figure 41: Rest of the World AI in Medical Imaging Industry Revenue Share (%), by Country 2024 & 2032
List of Tables
- Table 1: Global AI in Medical Imaging Industry Revenue Million Forecast, by Region 2019 & 2032
- Table 2: Global AI in Medical Imaging Industry Revenue Million Forecast, by Offering 2019 & 2032
- Table 3: Global AI in Medical Imaging Industry Revenue Million Forecast, by Image Acquisition Technology 2019 & 2032
- Table 4: Global AI in Medical Imaging Industry Revenue Million Forecast, by End User 2019 & 2032
- Table 5: Global AI in Medical Imaging Industry Revenue Million Forecast, by Region 2019 & 2032
- Table 6: Global AI in Medical Imaging Industry Revenue Million Forecast, by Country 2019 & 2032
- Table 7: United States AI in Medical Imaging Industry Revenue (Million) Forecast, by Application 2019 & 2032
- Table 8: Canada AI in Medical Imaging Industry Revenue (Million) Forecast, by Application 2019 & 2032
- Table 9: Global AI in Medical Imaging Industry Revenue Million Forecast, by Country 2019 & 2032
- Table 10: Germany AI in Medical Imaging Industry Revenue (Million) Forecast, by Application 2019 & 2032
- Table 11: France AI in Medical Imaging Industry Revenue (Million) Forecast, by Application 2019 & 2032
- Table 12: United Kingdom AI in Medical Imaging Industry Revenue (Million) Forecast, by Application 2019 & 2032
- Table 13: Rest of Europe AI in Medical Imaging Industry Revenue (Million) Forecast, by Application 2019 & 2032
- Table 14: Global AI in Medical Imaging Industry Revenue Million Forecast, by Country 2019 & 2032
- Table 15: India AI in Medical Imaging Industry Revenue (Million) Forecast, by Application 2019 & 2032
- Table 16: China AI in Medical Imaging Industry Revenue (Million) Forecast, by Application 2019 & 2032
- Table 17: Japan AI in Medical Imaging Industry Revenue (Million) Forecast, by Application 2019 & 2032
- Table 18: Rest of Asia Pacific AI in Medical Imaging Industry Revenue (Million) Forecast, by Application 2019 & 2032
- Table 19: Global AI in Medical Imaging Industry Revenue Million Forecast, by Country 2019 & 2032
- Table 20: AI in Medical Imaging Industry Revenue (Million) Forecast, by Application 2019 & 2032
- Table 21: Global AI in Medical Imaging Industry Revenue Million Forecast, by Offering 2019 & 2032
- Table 22: Global AI in Medical Imaging Industry Revenue Million Forecast, by Image Acquisition Technology 2019 & 2032
- Table 23: Global AI in Medical Imaging Industry Revenue Million Forecast, by End User 2019 & 2032
- Table 24: Global AI in Medical Imaging Industry Revenue Million Forecast, by Country 2019 & 2032
- Table 25: United States AI in Medical Imaging Industry Revenue (Million) Forecast, by Application 2019 & 2032
- Table 26: Canada AI in Medical Imaging Industry Revenue (Million) Forecast, by Application 2019 & 2032
- Table 27: Global AI in Medical Imaging Industry Revenue Million Forecast, by Offering 2019 & 2032
- Table 28: Global AI in Medical Imaging Industry Revenue Million Forecast, by Image Acquisition Technology 2019 & 2032
- Table 29: Global AI in Medical Imaging Industry Revenue Million Forecast, by End User 2019 & 2032
- Table 30: Global AI in Medical Imaging Industry Revenue Million Forecast, by Country 2019 & 2032
- Table 31: Germany AI in Medical Imaging Industry Revenue (Million) Forecast, by Application 2019 & 2032
- Table 32: France AI in Medical Imaging Industry Revenue (Million) Forecast, by Application 2019 & 2032
- Table 33: United Kingdom AI in Medical Imaging Industry Revenue (Million) Forecast, by Application 2019 & 2032
- Table 34: Rest of Europe AI in Medical Imaging Industry Revenue (Million) Forecast, by Application 2019 & 2032
- Table 35: Global AI in Medical Imaging Industry Revenue Million Forecast, by Offering 2019 & 2032
- Table 36: Global AI in Medical Imaging Industry Revenue Million Forecast, by Image Acquisition Technology 2019 & 2032
- Table 37: Global AI in Medical Imaging Industry Revenue Million Forecast, by End User 2019 & 2032
- Table 38: Global AI in Medical Imaging Industry Revenue Million Forecast, by Country 2019 & 2032
- Table 39: India AI in Medical Imaging Industry Revenue (Million) Forecast, by Application 2019 & 2032
- Table 40: China AI in Medical Imaging Industry Revenue (Million) Forecast, by Application 2019 & 2032
- Table 41: Japan AI in Medical Imaging Industry Revenue (Million) Forecast, by Application 2019 & 2032
- Table 42: Rest of Asia Pacific AI in Medical Imaging Industry Revenue (Million) Forecast, by Application 2019 & 2032
- Table 43: Global AI in Medical Imaging Industry Revenue Million Forecast, by Offering 2019 & 2032
- Table 44: Global AI in Medical Imaging Industry Revenue Million Forecast, by Image Acquisition Technology 2019 & 2032
- Table 45: Global AI in Medical Imaging Industry Revenue Million Forecast, by End User 2019 & 2032
- Table 46: Global AI in Medical Imaging Industry Revenue Million Forecast, by Country 2019 & 2032
Frequently Asked Questions
1. What is the projected Compound Annual Growth Rate (CAGR) of the AI in Medical Imaging Industry?
The projected CAGR is approximately 28.32%.
2. Which companies are prominent players in the AI in Medical Imaging Industry?
Key companies in the market include GE Healthcare, Samsung Electronics Co Ltd, Philips Healthcare, Siemens Healthineers AG, EchoNous Inc, BenevolentAI Limited, Oxipit ai*List Not Exhaustive, Zebra Medical Vision Inc, Medtronic Plc, Enlitic Inc, Nvidia Corporation, IBM Watson Health.
3. What are the main segments of the AI in Medical Imaging Industry?
The market segments include Offering, Image Acquisition Technology, End User.
4. Can you provide details about the market size?
The market size is estimated to be USD 5.86 Million as of 2022.
5. What are some drivers contributing to market growth?
Increasing Imaging Volumes.
6. What are the notable trends driving market growth?
Computed Tomography is Expected to Drive the Market Growth.
7. Are there any restraints impacting market growth?
Increasing Complexity Coupled with High Initial Costs and Maintenance Costs.
8. Can you provide examples of recent developments in the market?
November 2022 - The annual conference of the Radiological Society of North America (RSNA) presented a portfolio of smart diagnostic equipment and disruptive workflow solutions from Royal Philips, a leading global provider of health technology. The firm will deliver its most current systems and informatics solutions powered by AI that enable providers to offer high-quality imaging services that are patient-centric quickly.
9. What pricing options are available for accessing the report?
Pricing options include single-user, multi-user, and enterprise licenses priced at USD 4750, USD 5250, and USD 8750 respectively.
10. Is the market size provided in terms of value or volume?
The market size is provided in terms of value, measured in Million.
11. Are there any specific market keywords associated with the report?
Yes, the market keyword associated with the report is "AI in Medical Imaging Industry," which aids in identifying and referencing the specific market segment covered.
12. How do I determine which pricing option suits my needs best?
The pricing options vary based on user requirements and access needs. Individual users may opt for single-user licenses, while businesses requiring broader access may choose multi-user or enterprise licenses for cost-effective access to the report.
13. Are there any additional resources or data provided in the AI in Medical Imaging Industry report?
While the report offers comprehensive insights, it's advisable to review the specific contents or supplementary materials provided to ascertain if additional resources or data are available.
14. How can I stay updated on further developments or reports in the AI in Medical Imaging Industry?
To stay informed about further developments, trends, and reports in the AI in Medical Imaging Industry, consider subscribing to industry newsletters, following relevant companies and organizations, or regularly checking reputable industry news sources and publications.
Methodology
Step 1 - Identification of Relevant Samples Size from Population Database


Step 2 - Approaches for Defining Global Market Size (Value, Volume* & Price*)

Note*: In applicable scenarios
Step 3 - Data Sources
Primary Research
- Web Analytics
- Survey Reports
- Research Institute
- Latest Research Reports
- Opinion Leaders
Secondary Research
- Annual Reports
- White Paper
- Latest Press Release
- Industry Association
- Paid Database
- Investor Presentations

Step 4 - Data Triangulation
Involves using different sources of information in order to increase the validity of a study
These sources are likely to be stakeholders in a program - participants, other researchers, program staff, other community members, and so on.
Then we put all data in single framework & apply various statistical tools to find out the dynamic on the market.
During the analysis stage, feedback from the stakeholder groups would be compared to determine areas of agreement as well as areas of divergence


