
Key Insights
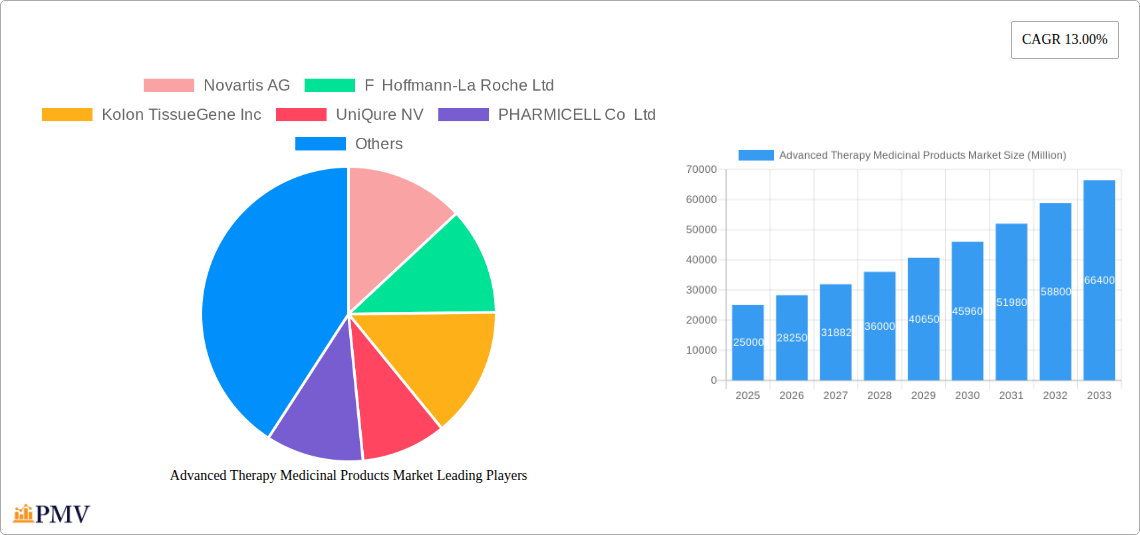
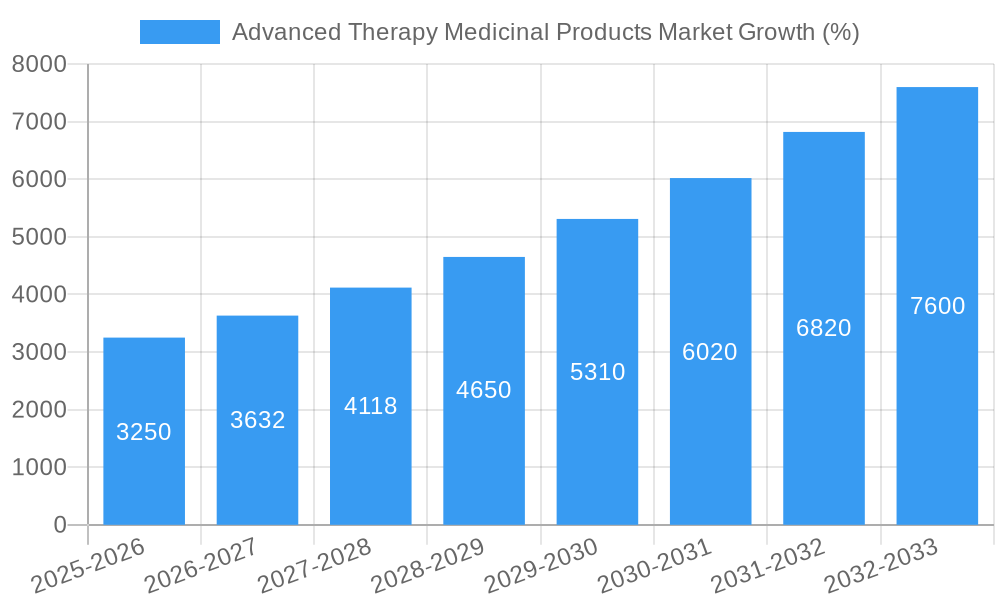
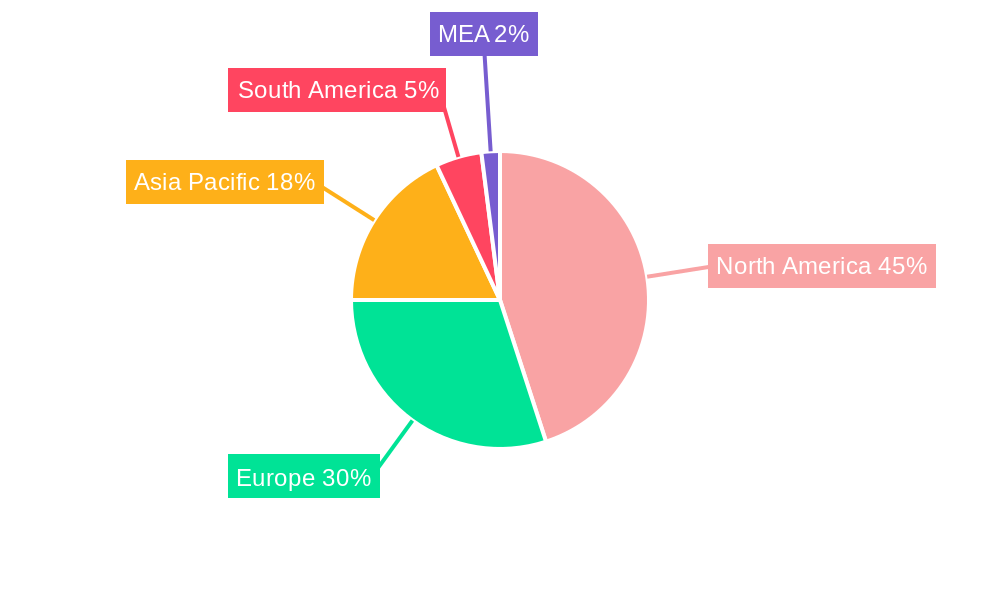
The Advanced Therapy Medicinal Products (ATMP) market is experiencing robust growth, projected to reach a substantial size by 2033. A 13% Compound Annual Growth Rate (CAGR) signifies significant investor interest and the increasing adoption of innovative therapies like cell therapy, gene therapy, CAR-T therapy, and tissue-engineered products. Driving this expansion are several key factors: the rising prevalence of chronic and life-threatening diseases for which conventional treatments offer limited efficacy, significant advancements in research and development leading to more effective and safer therapies, and growing regulatory approvals facilitating wider market access. The North American market, particularly the United States, currently holds a dominant share due to robust healthcare infrastructure, high R&D investment, and early adoption of cutting-edge technologies. However, the Asia-Pacific region is poised for substantial growth, fueled by increasing healthcare expenditure, growing awareness of ATMPs, and a large patient population. Competitive dynamics are shaped by a mix of established pharmaceutical giants and emerging biotech companies actively involved in research, development, and commercialization. The market faces challenges such as high development costs, stringent regulatory hurdles, and ensuring long-term safety and efficacy of these complex therapies.
Despite these challenges, the future outlook for the ATMP market remains positive. The continued development of personalized medicine approaches and technological advancements, particularly in gene editing and delivery systems, are expected to further propel market growth. Moreover, collaborative efforts between researchers, regulators, and industry players are streamlining the approval process, leading to accelerated commercialization and wider patient access. The market segmentation by therapy type reflects the diversity of ATMPs, each with its own unique growth trajectory based on therapeutic efficacy, clinical trial success rates, and regulatory approvals. Ongoing research in addressing the limitations of current therapies and exploring novel applications promises sustained market expansion and diversification in the coming years. The expanding pipeline of promising ATMPs in various stages of development points towards substantial future growth potential.
Advanced Therapy Medicinal Products Market: A Comprehensive Report (2019-2033)
This in-depth report provides a comprehensive analysis of the Advanced Therapy Medicinal Products (ATMP) market, offering actionable insights for stakeholders across the industry. With a study period spanning 2019-2033, a base year of 2025, and a forecast period of 2025-2033, this report meticulously examines market dynamics, competitive landscapes, and future growth trajectories. The market is expected to reach xx Million by 2033, exhibiting a CAGR of xx% during the forecast period.
Advanced Therapy Medicinal Products Market Market Structure & Competitive Dynamics
The ATMP market exhibits a moderately concentrated structure, with key players like Novartis AG, F Hoffmann-La Roche Ltd, and Gilead Sciences Inc holding significant market share. However, a vibrant ecosystem of smaller biotech companies and research institutions drives continuous innovation. Regulatory frameworks, including those from the FDA and EMA, heavily influence market access and product approvals, creating both opportunities and challenges. The market witnesses frequent mergers and acquisitions (M&A), with deal values reaching xx Million in 2024. These activities reshape the competitive landscape and accelerate technology adoption.
- Market Concentration: Highly concentrated in the cell and gene therapy segments, with top 5 players holding approximately xx% of market share in 2024.
- Innovation Ecosystems: Strong presence of academic research institutions and biotech startups fostering continuous innovation in cell and gene therapies.
- Regulatory Frameworks: Stringent regulations drive high development costs but ensure patient safety and efficacy.
- Product Substitutes: Limited direct substitutes but traditional therapies pose indirect competition.
- End-User Trends: Increasing demand for personalized medicine and effective treatments for currently incurable diseases.
- M&A Activities: A significant number of M&A deals, totaling xx Million in 2024, reflecting strategic investments and consolidation in the industry. This includes both large-scale acquisitions and smaller strategic partnerships.
Advanced Therapy Medicinal Products Market Industry Trends & Insights
The ATMP market is experiencing exponential growth fueled by several key factors. Technological advancements in gene editing (CRISPR), viral vector production, and cell manufacturing are accelerating product development and improving treatment efficacy. Rising prevalence of chronic and life-threatening diseases, coupled with growing awareness among patients and healthcare providers, fuels demand for advanced therapies. The market demonstrates a significant unmet need, particularly in oncology and rare diseases, leading to high investment and market penetration rates. The adoption of cell therapies is increasing steadily, with a market penetration of xx% in 2024, indicating strong future potential. The industry’s focus on personalized medicine, coupled with supportive regulatory frameworks in major markets, further accelerates market expansion. The CAGR for the overall ATMP market is projected at xx% from 2025 to 2033. This robust growth is attributed to increasing R&D investments, strategic collaborations, and successful clinical trials.
Dominant Markets & Segments in Advanced Therapy Medicinal Products Market
The North American region currently dominates the ATMP market, driven by robust healthcare infrastructure, high research & development investment, and early adoption of advanced therapies. Within therapy types, cell therapy holds the largest market share, followed by gene therapy and CAR-T therapy.
- Key Drivers in North America:
- Strong regulatory support and well-established clinical trial infrastructure.
- High healthcare expenditure and willingness to adopt innovative treatment approaches.
- Significant investment in R&D by both pharmaceutical companies and government agencies.
- Dominant Segment: Cell Therapy: This segment's dominance is fueled by the ongoing progress in stem cell therapies, immune cell therapies and their broad applicability across multiple diseases.
- Other Significant Segments: Gene therapy and CAR-T therapies are exhibiting substantial growth due to advancements in viral vector technology and clinical successes in treating specific cancers and genetic diseases. Tissue-engineered products are also gaining momentum in areas such as wound care and regenerative medicine.
Advanced Therapy Medicinal Products Market Product Innovations
Recent years have witnessed significant advancements in ATMPs, including the development of novel viral vectors for gene delivery, improved cell manufacturing processes, and the emergence of new cell types for therapeutic applications. These innovations enhance treatment efficacy, reduce side effects, and expand the range of treatable diseases. The integration of AI and machine learning into drug discovery and development is accelerating the identification of novel therapeutic targets and the optimization of treatment protocols. Furthermore, the development of combination therapies integrating different ATMP modalities promises to deliver even more potent and targeted treatment approaches.
Report Segmentation & Scope
This report segments the ATMP market by therapy type:
Cell Therapy: This segment encompasses various cell-based therapies including stem cell therapy, immune cell therapy, and other innovative approaches. Market size is projected at xx Million in 2025, and is expected to reach xx Million by 2033, driven by rising demand for treatment of chronic diseases and regenerative medicine applications.
Gene Therapy: This segment includes viral and non-viral gene therapies. The market is expected to grow from xx Million in 2025 to xx Million in 2033, driven by advancements in gene editing technologies like CRISPR.
CAR-T Therapy: This rapidly growing segment is focused on chimeric antigen receptor T-cell therapy for cancer treatment. The market size is anticipated to expand from xx Million in 2025 to xx Million in 2033, fueled by its demonstrated success in treating certain types of blood cancers.
Tissue-Engineered Products: This segment is driven by increasing demand for skin grafts, cartilage repair, and other regenerative therapies. It is projected to grow from xx Million in 2025 to xx Million in 2033.
Key Drivers of Advanced Therapy Medicinal Products Market Growth
Several factors are accelerating the growth of the ATMP market. Technological advancements, including CRISPR-Cas9 gene editing and improved vector systems for gene delivery, are creating new therapeutic possibilities. Rising prevalence of chronic diseases like cancer and genetic disorders, along with increasing awareness among patients, fuels the demand for innovative treatments. Supportive regulatory frameworks that encourage innovation are also key drivers of market expansion. Furthermore, substantial investments from both public and private sectors are providing the necessary resources to accelerate product development and market penetration.
Challenges in the Advanced Therapy Medicinal Products Market Sector
Despite significant potential, the ATMP market faces challenges. High development costs and lengthy regulatory approval processes increase time-to-market. Manufacturing complexities and the need for specialized facilities pose supply chain limitations. Competition among established pharmaceutical companies and emerging biotech firms creates intense pressure in the market. The need for personalized treatment approaches and the complexity of developing effective and safe therapies also presents significant hurdles. These factors collectively impact the market's overall growth trajectory and increase the development costs which could be as high as xx Million for a single product.
Leading Players in the Advanced Therapy Medicinal Products Market Market
- Novartis AG
- F Hoffmann-La Roche Ltd
- Kolon TissueGene Inc
- UniQure NV
- PHARMICELL Co Ltd
- Vericel Corporation
- Bluebird Bio Inc
- JCR Pharmaceuticals Co Ltd
- Gilead Sciences Inc
- Bristol-Myers Squibb Company
Key Developments in Advanced Therapy Medicinal Products Market Sector
- 2024 Q4: Novartis AG announces successful Phase III trial results for a novel CAR-T therapy.
- 2023 Q3: Roche acquires a promising biotech company specializing in gene editing technology.
- 2022 Q1: FDA approves a new gene therapy for a rare genetic disorder.
- 2021 Q4: Significant investment in ATMP research announced by a major government agency.
- 2020 Q2: A new partnership is formed between a large pharmaceutical company and a biotech firm to develop novel cell therapies.
Strategic Advanced Therapy Medicinal Products Market Market Outlook
The future of the ATMP market is promising, with continued technological advancements, growing market demand, and increased investment expected to drive substantial growth. Strategic partnerships between pharmaceutical companies and biotech firms will play a crucial role in accelerating product development and market access. The focus on personalized medicine and targeted therapies will further propel the market's expansion. Further regulatory clarity and streamlined approval processes will be essential for facilitating innovation and ensuring patient access to these life-changing therapies. The market is poised for continued robust growth, driven by technological breakthroughs and the increasing unmet need for effective treatments across various disease areas.
Advanced Therapy Medicinal Products Market Segmentation
-
1. Therapy Type
- 1.1. Cell Therapy
- 1.2. Gene Therapy
- 1.3. CAR-T Therapy
- 1.4. Tissue Engineered Product
-
2. Application
- 2.1. Oncology
- 2.2. Cardiology
- 2.3. Immunology
- 2.4. Orthopedics
- 2.5. Neurology
-
3. End User
- 3.1. Hospitals
- 3.2. Clinics
- 3.3. Research Institutes
- 3.4. Pharmaceutical Companies
Advanced Therapy Medicinal Products Market Segmentation By Geography
-
1. North America
- 1.1. United States
- 1.2. Canada
-
2. Europe
- 2.1. Germany
- 2.2. United Kingdom
- 2.3. France
- 2.4. Italy
- 2.5. Spain
- 2.6. Rest of Europe
-
3. Asia Pacific
- 3.1. China
- 3.2. Japan
- 3.3. India
- 3.4. Australia
- 3.5. South Korea
- 3.6. Rest of Asia Pacific
- 4. Rest of the World
Advanced Therapy Medicinal Products Market REPORT HIGHLIGHTS
| Aspects | Details |
|---|---|
| Study Period | 2019-2033 |
| Base Year | 2024 |
| Estimated Year | 2025 |
| Forecast Period | 2025-2033 |
| Historical Period | 2019-2024 |
| Growth Rate | CAGR of 13.00% from 2019-2033 |
| Segmentation |
|
Table of Contents
- 1. Introduction
- 1.1. Research Scope
- 1.2. Market Segmentation
- 1.3. Research Methodology
- 1.4. Definitions and Assumptions
- 2. Executive Summary
- 2.1. Introduction
- 3. Market Dynamics
- 3.1. Introduction
- 3.2. Market Drivers
- 3.2.1. Rising Number of Clinical Trials for ATMPs; Growing Competition Among Market Players
- 3.3. Market Restrains
- 3.3.1. Affordability and Financial Sustainability Related Challenges
- 3.4. Market Trends
- 3.4.1. The Tissue-Engineered Product Segment is Expected to Hold a Major Market Share in the Advanced Therapy Medicinal Products (ATMPs) Market
- 4. Market Factor Analysis
- 4.1. Porters Five Forces
- 4.2. Supply/Value Chain
- 4.3. PESTEL analysis
- 4.4. Market Entropy
- 4.5. Patent/Trademark Analysis
- 5. Global Advanced Therapy Medicinal Products Market Analysis, Insights and Forecast, 2019-2031
- 5.1. Market Analysis, Insights and Forecast - by Therapy Type
- 5.1.1. Cell Therapy
- 5.1.2. Gene Therapy
- 5.1.3. CAR-T Therapy
- 5.1.4. Tissue Engineered Product
- 5.2. Market Analysis, Insights and Forecast - by Application
- 5.2.1. Oncology
- 5.2.2. Cardiology
- 5.2.3. Immunology
- 5.2.4. Orthopedics
- 5.2.5. Neurology
- 5.3. Market Analysis, Insights and Forecast - by End User
- 5.3.1. Hospitals
- 5.3.2. Clinics
- 5.3.3. Research Institutes
- 5.3.4. Pharmaceutical Companies
- 5.4. Market Analysis, Insights and Forecast - by Region
- 5.4.1. North America
- 5.4.2. Europe
- 5.4.3. Asia Pacific
- 5.4.4. Rest of the World
- 5.1. Market Analysis, Insights and Forecast - by Therapy Type
- 6. North America Advanced Therapy Medicinal Products Market Analysis, Insights and Forecast, 2019-2031
- 6.1. Market Analysis, Insights and Forecast - by Therapy Type
- 6.1.1. Cell Therapy
- 6.1.2. Gene Therapy
- 6.1.3. CAR-T Therapy
- 6.1.4. Tissue Engineered Product
- 6.2. Market Analysis, Insights and Forecast - by Application
- 6.2.1. Oncology
- 6.2.2. Cardiology
- 6.2.3. Immunology
- 6.2.4. Orthopedics
- 6.2.5. Neurology
- 6.3. Market Analysis, Insights and Forecast - by End User
- 6.3.1. Hospitals
- 6.3.2. Clinics
- 6.3.3. Research Institutes
- 6.3.4. Pharmaceutical Companies
- 6.1. Market Analysis, Insights and Forecast - by Therapy Type
- 7. Europe Advanced Therapy Medicinal Products Market Analysis, Insights and Forecast, 2019-2031
- 7.1. Market Analysis, Insights and Forecast - by Therapy Type
- 7.1.1. Cell Therapy
- 7.1.2. Gene Therapy
- 7.1.3. CAR-T Therapy
- 7.1.4. Tissue Engineered Product
- 7.2. Market Analysis, Insights and Forecast - by Application
- 7.2.1. Oncology
- 7.2.2. Cardiology
- 7.2.3. Immunology
- 7.2.4. Orthopedics
- 7.2.5. Neurology
- 7.3. Market Analysis, Insights and Forecast - by End User
- 7.3.1. Hospitals
- 7.3.2. Clinics
- 7.3.3. Research Institutes
- 7.3.4. Pharmaceutical Companies
- 7.1. Market Analysis, Insights and Forecast - by Therapy Type
- 8. Asia Pacific Advanced Therapy Medicinal Products Market Analysis, Insights and Forecast, 2019-2031
- 8.1. Market Analysis, Insights and Forecast - by Therapy Type
- 8.1.1. Cell Therapy
- 8.1.2. Gene Therapy
- 8.1.3. CAR-T Therapy
- 8.1.4. Tissue Engineered Product
- 8.2. Market Analysis, Insights and Forecast - by Application
- 8.2.1. Oncology
- 8.2.2. Cardiology
- 8.2.3. Immunology
- 8.2.4. Orthopedics
- 8.2.5. Neurology
- 8.3. Market Analysis, Insights and Forecast - by End User
- 8.3.1. Hospitals
- 8.3.2. Clinics
- 8.3.3. Research Institutes
- 8.3.4. Pharmaceutical Companies
- 8.1. Market Analysis, Insights and Forecast - by Therapy Type
- 9. Rest of the World Advanced Therapy Medicinal Products Market Analysis, Insights and Forecast, 2019-2031
- 9.1. Market Analysis, Insights and Forecast - by Therapy Type
- 9.1.1. Cell Therapy
- 9.1.2. Gene Therapy
- 9.1.3. CAR-T Therapy
- 9.1.4. Tissue Engineered Product
- 9.2. Market Analysis, Insights and Forecast - by Application
- 9.2.1. Oncology
- 9.2.2. Cardiology
- 9.2.3. Immunology
- 9.2.4. Orthopedics
- 9.2.5. Neurology
- 9.3. Market Analysis, Insights and Forecast - by End User
- 9.3.1. Hospitals
- 9.3.2. Clinics
- 9.3.3. Research Institutes
- 9.3.4. Pharmaceutical Companies
- 9.1. Market Analysis, Insights and Forecast - by Therapy Type
- 10. North America Advanced Therapy Medicinal Products Market Analysis, Insights and Forecast, 2019-2031
- 10.1. Market Analysis, Insights and Forecast - By Country/Sub-region
- 10.1.1 United States
- 10.1.2 Canada
- 10.1.3 Mexico
- 11. Europe Advanced Therapy Medicinal Products Market Analysis, Insights and Forecast, 2019-2031
- 11.1. Market Analysis, Insights and Forecast - By Country/Sub-region
- 11.1.1 Germany
- 11.1.2 United Kingdom
- 11.1.3 France
- 11.1.4 Spain
- 11.1.5 Italy
- 11.1.6 Spain
- 11.1.7 Belgium
- 11.1.8 Netherland
- 11.1.9 Nordics
- 11.1.10 Rest of Europe
- 12. Asia Pacific Advanced Therapy Medicinal Products Market Analysis, Insights and Forecast, 2019-2031
- 12.1. Market Analysis, Insights and Forecast - By Country/Sub-region
- 12.1.1 China
- 12.1.2 Japan
- 12.1.3 India
- 12.1.4 South Korea
- 12.1.5 Southeast Asia
- 12.1.6 Australia
- 12.1.7 Indonesia
- 12.1.8 Phillipes
- 12.1.9 Singapore
- 12.1.10 Thailandc
- 12.1.11 Rest of Asia Pacific
- 13. South America Advanced Therapy Medicinal Products Market Analysis, Insights and Forecast, 2019-2031
- 13.1. Market Analysis, Insights and Forecast - By Country/Sub-region
- 13.1.1 Brazil
- 13.1.2 Argentina
- 13.1.3 Peru
- 13.1.4 Chile
- 13.1.5 Colombia
- 13.1.6 Ecuador
- 13.1.7 Venezuela
- 13.1.8 Rest of South America
- 14. North America Advanced Therapy Medicinal Products Market Analysis, Insights and Forecast, 2019-2031
- 14.1. Market Analysis, Insights and Forecast - By Country/Sub-region
- 14.1.1 United States
- 14.1.2 Canada
- 14.1.3 Mexico
- 15. MEA Advanced Therapy Medicinal Products Market Analysis, Insights and Forecast, 2019-2031
- 15.1. Market Analysis, Insights and Forecast - By Country/Sub-region
- 15.1.1 United Arab Emirates
- 15.1.2 Saudi Arabia
- 15.1.3 South Africa
- 15.1.4 Rest of Middle East and Africa
- 16. Competitive Analysis
- 16.1. Global Market Share Analysis 2024
- 16.2. Company Profiles
- 16.2.1 Novartis AG
- 16.2.1.1. Overview
- 16.2.1.2. Products
- 16.2.1.3. SWOT Analysis
- 16.2.1.4. Recent Developments
- 16.2.1.5. Financials (Based on Availability)
- 16.2.2 F Hoffmann-La Roche Ltd
- 16.2.2.1. Overview
- 16.2.2.2. Products
- 16.2.2.3. SWOT Analysis
- 16.2.2.4. Recent Developments
- 16.2.2.5. Financials (Based on Availability)
- 16.2.3 Kolon TissueGene Inc
- 16.2.3.1. Overview
- 16.2.3.2. Products
- 16.2.3.3. SWOT Analysis
- 16.2.3.4. Recent Developments
- 16.2.3.5. Financials (Based on Availability)
- 16.2.4 UniQure NV
- 16.2.4.1. Overview
- 16.2.4.2. Products
- 16.2.4.3. SWOT Analysis
- 16.2.4.4. Recent Developments
- 16.2.4.5. Financials (Based on Availability)
- 16.2.5 PHARMICELL Co Ltd
- 16.2.5.1. Overview
- 16.2.5.2. Products
- 16.2.5.3. SWOT Analysis
- 16.2.5.4. Recent Developments
- 16.2.5.5. Financials (Based on Availability)
- 16.2.6 Vericel Corporation
- 16.2.6.1. Overview
- 16.2.6.2. Products
- 16.2.6.3. SWOT Analysis
- 16.2.6.4. Recent Developments
- 16.2.6.5. Financials (Based on Availability)
- 16.2.7 Bluebird Bio Inc
- 16.2.7.1. Overview
- 16.2.7.2. Products
- 16.2.7.3. SWOT Analysis
- 16.2.7.4. Recent Developments
- 16.2.7.5. Financials (Based on Availability)
- 16.2.8 JCR Pharmaceuticals Co Ltd
- 16.2.8.1. Overview
- 16.2.8.2. Products
- 16.2.8.3. SWOT Analysis
- 16.2.8.4. Recent Developments
- 16.2.8.5. Financials (Based on Availability)
- 16.2.9 Gilead Sciences Inc
- 16.2.9.1. Overview
- 16.2.9.2. Products
- 16.2.9.3. SWOT Analysis
- 16.2.9.4. Recent Developments
- 16.2.9.5. Financials (Based on Availability)
- 16.2.10 Bristol-Myers Squibb Company
- 16.2.10.1. Overview
- 16.2.10.2. Products
- 16.2.10.3. SWOT Analysis
- 16.2.10.4. Recent Developments
- 16.2.10.5. Financials (Based on Availability)
- 16.2.1 Novartis AG
List of Figures
- Figure 1: Global Advanced Therapy Medicinal Products Market Revenue Breakdown (Million, %) by Region 2024 & 2032
- Figure 2: Global Advanced Therapy Medicinal Products Market Volume Breakdown (K Unit, %) by Region 2024 & 2032
- Figure 3: North America Advanced Therapy Medicinal Products Market Revenue (Million), by Country 2024 & 2032
- Figure 4: North America Advanced Therapy Medicinal Products Market Volume (K Unit), by Country 2024 & 2032
- Figure 5: North America Advanced Therapy Medicinal Products Market Revenue Share (%), by Country 2024 & 2032
- Figure 6: North America Advanced Therapy Medicinal Products Market Volume Share (%), by Country 2024 & 2032
- Figure 7: Europe Advanced Therapy Medicinal Products Market Revenue (Million), by Country 2024 & 2032
- Figure 8: Europe Advanced Therapy Medicinal Products Market Volume (K Unit), by Country 2024 & 2032
- Figure 9: Europe Advanced Therapy Medicinal Products Market Revenue Share (%), by Country 2024 & 2032
- Figure 10: Europe Advanced Therapy Medicinal Products Market Volume Share (%), by Country 2024 & 2032
- Figure 11: Asia Pacific Advanced Therapy Medicinal Products Market Revenue (Million), by Country 2024 & 2032
- Figure 12: Asia Pacific Advanced Therapy Medicinal Products Market Volume (K Unit), by Country 2024 & 2032
- Figure 13: Asia Pacific Advanced Therapy Medicinal Products Market Revenue Share (%), by Country 2024 & 2032
- Figure 14: Asia Pacific Advanced Therapy Medicinal Products Market Volume Share (%), by Country 2024 & 2032
- Figure 15: South America Advanced Therapy Medicinal Products Market Revenue (Million), by Country 2024 & 2032
- Figure 16: South America Advanced Therapy Medicinal Products Market Volume (K Unit), by Country 2024 & 2032
- Figure 17: South America Advanced Therapy Medicinal Products Market Revenue Share (%), by Country 2024 & 2032
- Figure 18: South America Advanced Therapy Medicinal Products Market Volume Share (%), by Country 2024 & 2032
- Figure 19: North America Advanced Therapy Medicinal Products Market Revenue (Million), by Country 2024 & 2032
- Figure 20: North America Advanced Therapy Medicinal Products Market Volume (K Unit), by Country 2024 & 2032
- Figure 21: North America Advanced Therapy Medicinal Products Market Revenue Share (%), by Country 2024 & 2032
- Figure 22: North America Advanced Therapy Medicinal Products Market Volume Share (%), by Country 2024 & 2032
- Figure 23: MEA Advanced Therapy Medicinal Products Market Revenue (Million), by Country 2024 & 2032
- Figure 24: MEA Advanced Therapy Medicinal Products Market Volume (K Unit), by Country 2024 & 2032
- Figure 25: MEA Advanced Therapy Medicinal Products Market Revenue Share (%), by Country 2024 & 2032
- Figure 26: MEA Advanced Therapy Medicinal Products Market Volume Share (%), by Country 2024 & 2032
- Figure 27: North America Advanced Therapy Medicinal Products Market Revenue (Million), by Therapy Type 2024 & 2032
- Figure 28: North America Advanced Therapy Medicinal Products Market Volume (K Unit), by Therapy Type 2024 & 2032
- Figure 29: North America Advanced Therapy Medicinal Products Market Revenue Share (%), by Therapy Type 2024 & 2032
- Figure 30: North America Advanced Therapy Medicinal Products Market Volume Share (%), by Therapy Type 2024 & 2032
- Figure 31: North America Advanced Therapy Medicinal Products Market Revenue (Million), by Application 2024 & 2032
- Figure 32: North America Advanced Therapy Medicinal Products Market Volume (K Unit), by Application 2024 & 2032
- Figure 33: North America Advanced Therapy Medicinal Products Market Revenue Share (%), by Application 2024 & 2032
- Figure 34: North America Advanced Therapy Medicinal Products Market Volume Share (%), by Application 2024 & 2032
- Figure 35: North America Advanced Therapy Medicinal Products Market Revenue (Million), by End User 2024 & 2032
- Figure 36: North America Advanced Therapy Medicinal Products Market Volume (K Unit), by End User 2024 & 2032
- Figure 37: North America Advanced Therapy Medicinal Products Market Revenue Share (%), by End User 2024 & 2032
- Figure 38: North America Advanced Therapy Medicinal Products Market Volume Share (%), by End User 2024 & 2032
- Figure 39: North America Advanced Therapy Medicinal Products Market Revenue (Million), by Country 2024 & 2032
- Figure 40: North America Advanced Therapy Medicinal Products Market Volume (K Unit), by Country 2024 & 2032
- Figure 41: North America Advanced Therapy Medicinal Products Market Revenue Share (%), by Country 2024 & 2032
- Figure 42: North America Advanced Therapy Medicinal Products Market Volume Share (%), by Country 2024 & 2032
- Figure 43: Europe Advanced Therapy Medicinal Products Market Revenue (Million), by Therapy Type 2024 & 2032
- Figure 44: Europe Advanced Therapy Medicinal Products Market Volume (K Unit), by Therapy Type 2024 & 2032
- Figure 45: Europe Advanced Therapy Medicinal Products Market Revenue Share (%), by Therapy Type 2024 & 2032
- Figure 46: Europe Advanced Therapy Medicinal Products Market Volume Share (%), by Therapy Type 2024 & 2032
- Figure 47: Europe Advanced Therapy Medicinal Products Market Revenue (Million), by Application 2024 & 2032
- Figure 48: Europe Advanced Therapy Medicinal Products Market Volume (K Unit), by Application 2024 & 2032
- Figure 49: Europe Advanced Therapy Medicinal Products Market Revenue Share (%), by Application 2024 & 2032
- Figure 50: Europe Advanced Therapy Medicinal Products Market Volume Share (%), by Application 2024 & 2032
- Figure 51: Europe Advanced Therapy Medicinal Products Market Revenue (Million), by End User 2024 & 2032
- Figure 52: Europe Advanced Therapy Medicinal Products Market Volume (K Unit), by End User 2024 & 2032
- Figure 53: Europe Advanced Therapy Medicinal Products Market Revenue Share (%), by End User 2024 & 2032
- Figure 54: Europe Advanced Therapy Medicinal Products Market Volume Share (%), by End User 2024 & 2032
- Figure 55: Europe Advanced Therapy Medicinal Products Market Revenue (Million), by Country 2024 & 2032
- Figure 56: Europe Advanced Therapy Medicinal Products Market Volume (K Unit), by Country 2024 & 2032
- Figure 57: Europe Advanced Therapy Medicinal Products Market Revenue Share (%), by Country 2024 & 2032
- Figure 58: Europe Advanced Therapy Medicinal Products Market Volume Share (%), by Country 2024 & 2032
- Figure 59: Asia Pacific Advanced Therapy Medicinal Products Market Revenue (Million), by Therapy Type 2024 & 2032
- Figure 60: Asia Pacific Advanced Therapy Medicinal Products Market Volume (K Unit), by Therapy Type 2024 & 2032
- Figure 61: Asia Pacific Advanced Therapy Medicinal Products Market Revenue Share (%), by Therapy Type 2024 & 2032
- Figure 62: Asia Pacific Advanced Therapy Medicinal Products Market Volume Share (%), by Therapy Type 2024 & 2032
- Figure 63: Asia Pacific Advanced Therapy Medicinal Products Market Revenue (Million), by Application 2024 & 2032
- Figure 64: Asia Pacific Advanced Therapy Medicinal Products Market Volume (K Unit), by Application 2024 & 2032
- Figure 65: Asia Pacific Advanced Therapy Medicinal Products Market Revenue Share (%), by Application 2024 & 2032
- Figure 66: Asia Pacific Advanced Therapy Medicinal Products Market Volume Share (%), by Application 2024 & 2032
- Figure 67: Asia Pacific Advanced Therapy Medicinal Products Market Revenue (Million), by End User 2024 & 2032
- Figure 68: Asia Pacific Advanced Therapy Medicinal Products Market Volume (K Unit), by End User 2024 & 2032
- Figure 69: Asia Pacific Advanced Therapy Medicinal Products Market Revenue Share (%), by End User 2024 & 2032
- Figure 70: Asia Pacific Advanced Therapy Medicinal Products Market Volume Share (%), by End User 2024 & 2032
- Figure 71: Asia Pacific Advanced Therapy Medicinal Products Market Revenue (Million), by Country 2024 & 2032
- Figure 72: Asia Pacific Advanced Therapy Medicinal Products Market Volume (K Unit), by Country 2024 & 2032
- Figure 73: Asia Pacific Advanced Therapy Medicinal Products Market Revenue Share (%), by Country 2024 & 2032
- Figure 74: Asia Pacific Advanced Therapy Medicinal Products Market Volume Share (%), by Country 2024 & 2032
- Figure 75: Rest of the World Advanced Therapy Medicinal Products Market Revenue (Million), by Therapy Type 2024 & 2032
- Figure 76: Rest of the World Advanced Therapy Medicinal Products Market Volume (K Unit), by Therapy Type 2024 & 2032
- Figure 77: Rest of the World Advanced Therapy Medicinal Products Market Revenue Share (%), by Therapy Type 2024 & 2032
- Figure 78: Rest of the World Advanced Therapy Medicinal Products Market Volume Share (%), by Therapy Type 2024 & 2032
- Figure 79: Rest of the World Advanced Therapy Medicinal Products Market Revenue (Million), by Application 2024 & 2032
- Figure 80: Rest of the World Advanced Therapy Medicinal Products Market Volume (K Unit), by Application 2024 & 2032
- Figure 81: Rest of the World Advanced Therapy Medicinal Products Market Revenue Share (%), by Application 2024 & 2032
- Figure 82: Rest of the World Advanced Therapy Medicinal Products Market Volume Share (%), by Application 2024 & 2032
- Figure 83: Rest of the World Advanced Therapy Medicinal Products Market Revenue (Million), by End User 2024 & 2032
- Figure 84: Rest of the World Advanced Therapy Medicinal Products Market Volume (K Unit), by End User 2024 & 2032
- Figure 85: Rest of the World Advanced Therapy Medicinal Products Market Revenue Share (%), by End User 2024 & 2032
- Figure 86: Rest of the World Advanced Therapy Medicinal Products Market Volume Share (%), by End User 2024 & 2032
- Figure 87: Rest of the World Advanced Therapy Medicinal Products Market Revenue (Million), by Country 2024 & 2032
- Figure 88: Rest of the World Advanced Therapy Medicinal Products Market Volume (K Unit), by Country 2024 & 2032
- Figure 89: Rest of the World Advanced Therapy Medicinal Products Market Revenue Share (%), by Country 2024 & 2032
- Figure 90: Rest of the World Advanced Therapy Medicinal Products Market Volume Share (%), by Country 2024 & 2032
List of Tables
- Table 1: Global Advanced Therapy Medicinal Products Market Revenue Million Forecast, by Region 2019 & 2032
- Table 2: Global Advanced Therapy Medicinal Products Market Volume K Unit Forecast, by Region 2019 & 2032
- Table 3: Global Advanced Therapy Medicinal Products Market Revenue Million Forecast, by Therapy Type 2019 & 2032
- Table 4: Global Advanced Therapy Medicinal Products Market Volume K Unit Forecast, by Therapy Type 2019 & 2032
- Table 5: Global Advanced Therapy Medicinal Products Market Revenue Million Forecast, by Application 2019 & 2032
- Table 6: Global Advanced Therapy Medicinal Products Market Volume K Unit Forecast, by Application 2019 & 2032
- Table 7: Global Advanced Therapy Medicinal Products Market Revenue Million Forecast, by End User 2019 & 2032
- Table 8: Global Advanced Therapy Medicinal Products Market Volume K Unit Forecast, by End User 2019 & 2032
- Table 9: Global Advanced Therapy Medicinal Products Market Revenue Million Forecast, by Region 2019 & 2032
- Table 10: Global Advanced Therapy Medicinal Products Market Volume K Unit Forecast, by Region 2019 & 2032
- Table 11: Global Advanced Therapy Medicinal Products Market Revenue Million Forecast, by Country 2019 & 2032
- Table 12: Global Advanced Therapy Medicinal Products Market Volume K Unit Forecast, by Country 2019 & 2032
- Table 13: United States Advanced Therapy Medicinal Products Market Revenue (Million) Forecast, by Application 2019 & 2032
- Table 14: United States Advanced Therapy Medicinal Products Market Volume (K Unit) Forecast, by Application 2019 & 2032
- Table 15: Canada Advanced Therapy Medicinal Products Market Revenue (Million) Forecast, by Application 2019 & 2032
- Table 16: Canada Advanced Therapy Medicinal Products Market Volume (K Unit) Forecast, by Application 2019 & 2032
- Table 17: Mexico Advanced Therapy Medicinal Products Market Revenue (Million) Forecast, by Application 2019 & 2032
- Table 18: Mexico Advanced Therapy Medicinal Products Market Volume (K Unit) Forecast, by Application 2019 & 2032
- Table 19: Global Advanced Therapy Medicinal Products Market Revenue Million Forecast, by Country 2019 & 2032
- Table 20: Global Advanced Therapy Medicinal Products Market Volume K Unit Forecast, by Country 2019 & 2032
- Table 21: Germany Advanced Therapy Medicinal Products Market Revenue (Million) Forecast, by Application 2019 & 2032
- Table 22: Germany Advanced Therapy Medicinal Products Market Volume (K Unit) Forecast, by Application 2019 & 2032
- Table 23: United Kingdom Advanced Therapy Medicinal Products Market Revenue (Million) Forecast, by Application 2019 & 2032
- Table 24: United Kingdom Advanced Therapy Medicinal Products Market Volume (K Unit) Forecast, by Application 2019 & 2032
- Table 25: France Advanced Therapy Medicinal Products Market Revenue (Million) Forecast, by Application 2019 & 2032
- Table 26: France Advanced Therapy Medicinal Products Market Volume (K Unit) Forecast, by Application 2019 & 2032
- Table 27: Spain Advanced Therapy Medicinal Products Market Revenue (Million) Forecast, by Application 2019 & 2032
- Table 28: Spain Advanced Therapy Medicinal Products Market Volume (K Unit) Forecast, by Application 2019 & 2032
- Table 29: Italy Advanced Therapy Medicinal Products Market Revenue (Million) Forecast, by Application 2019 & 2032
- Table 30: Italy Advanced Therapy Medicinal Products Market Volume (K Unit) Forecast, by Application 2019 & 2032
- Table 31: Spain Advanced Therapy Medicinal Products Market Revenue (Million) Forecast, by Application 2019 & 2032
- Table 32: Spain Advanced Therapy Medicinal Products Market Volume (K Unit) Forecast, by Application 2019 & 2032
- Table 33: Belgium Advanced Therapy Medicinal Products Market Revenue (Million) Forecast, by Application 2019 & 2032
- Table 34: Belgium Advanced Therapy Medicinal Products Market Volume (K Unit) Forecast, by Application 2019 & 2032
- Table 35: Netherland Advanced Therapy Medicinal Products Market Revenue (Million) Forecast, by Application 2019 & 2032
- Table 36: Netherland Advanced Therapy Medicinal Products Market Volume (K Unit) Forecast, by Application 2019 & 2032
- Table 37: Nordics Advanced Therapy Medicinal Products Market Revenue (Million) Forecast, by Application 2019 & 2032
- Table 38: Nordics Advanced Therapy Medicinal Products Market Volume (K Unit) Forecast, by Application 2019 & 2032
- Table 39: Rest of Europe Advanced Therapy Medicinal Products Market Revenue (Million) Forecast, by Application 2019 & 2032
- Table 40: Rest of Europe Advanced Therapy Medicinal Products Market Volume (K Unit) Forecast, by Application 2019 & 2032
- Table 41: Global Advanced Therapy Medicinal Products Market Revenue Million Forecast, by Country 2019 & 2032
- Table 42: Global Advanced Therapy Medicinal Products Market Volume K Unit Forecast, by Country 2019 & 2032
- Table 43: China Advanced Therapy Medicinal Products Market Revenue (Million) Forecast, by Application 2019 & 2032
- Table 44: China Advanced Therapy Medicinal Products Market Volume (K Unit) Forecast, by Application 2019 & 2032
- Table 45: Japan Advanced Therapy Medicinal Products Market Revenue (Million) Forecast, by Application 2019 & 2032
- Table 46: Japan Advanced Therapy Medicinal Products Market Volume (K Unit) Forecast, by Application 2019 & 2032
- Table 47: India Advanced Therapy Medicinal Products Market Revenue (Million) Forecast, by Application 2019 & 2032
- Table 48: India Advanced Therapy Medicinal Products Market Volume (K Unit) Forecast, by Application 2019 & 2032
- Table 49: South Korea Advanced Therapy Medicinal Products Market Revenue (Million) Forecast, by Application 2019 & 2032
- Table 50: South Korea Advanced Therapy Medicinal Products Market Volume (K Unit) Forecast, by Application 2019 & 2032
- Table 51: Southeast Asia Advanced Therapy Medicinal Products Market Revenue (Million) Forecast, by Application 2019 & 2032
- Table 52: Southeast Asia Advanced Therapy Medicinal Products Market Volume (K Unit) Forecast, by Application 2019 & 2032
- Table 53: Australia Advanced Therapy Medicinal Products Market Revenue (Million) Forecast, by Application 2019 & 2032
- Table 54: Australia Advanced Therapy Medicinal Products Market Volume (K Unit) Forecast, by Application 2019 & 2032
- Table 55: Indonesia Advanced Therapy Medicinal Products Market Revenue (Million) Forecast, by Application 2019 & 2032
- Table 56: Indonesia Advanced Therapy Medicinal Products Market Volume (K Unit) Forecast, by Application 2019 & 2032
- Table 57: Phillipes Advanced Therapy Medicinal Products Market Revenue (Million) Forecast, by Application 2019 & 2032
- Table 58: Phillipes Advanced Therapy Medicinal Products Market Volume (K Unit) Forecast, by Application 2019 & 2032
- Table 59: Singapore Advanced Therapy Medicinal Products Market Revenue (Million) Forecast, by Application 2019 & 2032
- Table 60: Singapore Advanced Therapy Medicinal Products Market Volume (K Unit) Forecast, by Application 2019 & 2032
- Table 61: Thailandc Advanced Therapy Medicinal Products Market Revenue (Million) Forecast, by Application 2019 & 2032
- Table 62: Thailandc Advanced Therapy Medicinal Products Market Volume (K Unit) Forecast, by Application 2019 & 2032
- Table 63: Rest of Asia Pacific Advanced Therapy Medicinal Products Market Revenue (Million) Forecast, by Application 2019 & 2032
- Table 64: Rest of Asia Pacific Advanced Therapy Medicinal Products Market Volume (K Unit) Forecast, by Application 2019 & 2032
- Table 65: Global Advanced Therapy Medicinal Products Market Revenue Million Forecast, by Country 2019 & 2032
- Table 66: Global Advanced Therapy Medicinal Products Market Volume K Unit Forecast, by Country 2019 & 2032
- Table 67: Brazil Advanced Therapy Medicinal Products Market Revenue (Million) Forecast, by Application 2019 & 2032
- Table 68: Brazil Advanced Therapy Medicinal Products Market Volume (K Unit) Forecast, by Application 2019 & 2032
- Table 69: Argentina Advanced Therapy Medicinal Products Market Revenue (Million) Forecast, by Application 2019 & 2032
- Table 70: Argentina Advanced Therapy Medicinal Products Market Volume (K Unit) Forecast, by Application 2019 & 2032
- Table 71: Peru Advanced Therapy Medicinal Products Market Revenue (Million) Forecast, by Application 2019 & 2032
- Table 72: Peru Advanced Therapy Medicinal Products Market Volume (K Unit) Forecast, by Application 2019 & 2032
- Table 73: Chile Advanced Therapy Medicinal Products Market Revenue (Million) Forecast, by Application 2019 & 2032
- Table 74: Chile Advanced Therapy Medicinal Products Market Volume (K Unit) Forecast, by Application 2019 & 2032
- Table 75: Colombia Advanced Therapy Medicinal Products Market Revenue (Million) Forecast, by Application 2019 & 2032
- Table 76: Colombia Advanced Therapy Medicinal Products Market Volume (K Unit) Forecast, by Application 2019 & 2032
- Table 77: Ecuador Advanced Therapy Medicinal Products Market Revenue (Million) Forecast, by Application 2019 & 2032
- Table 78: Ecuador Advanced Therapy Medicinal Products Market Volume (K Unit) Forecast, by Application 2019 & 2032
- Table 79: Venezuela Advanced Therapy Medicinal Products Market Revenue (Million) Forecast, by Application 2019 & 2032
- Table 80: Venezuela Advanced Therapy Medicinal Products Market Volume (K Unit) Forecast, by Application 2019 & 2032
- Table 81: Rest of South America Advanced Therapy Medicinal Products Market Revenue (Million) Forecast, by Application 2019 & 2032
- Table 82: Rest of South America Advanced Therapy Medicinal Products Market Volume (K Unit) Forecast, by Application 2019 & 2032
- Table 83: Global Advanced Therapy Medicinal Products Market Revenue Million Forecast, by Country 2019 & 2032
- Table 84: Global Advanced Therapy Medicinal Products Market Volume K Unit Forecast, by Country 2019 & 2032
- Table 85: United States Advanced Therapy Medicinal Products Market Revenue (Million) Forecast, by Application 2019 & 2032
- Table 86: United States Advanced Therapy Medicinal Products Market Volume (K Unit) Forecast, by Application 2019 & 2032
- Table 87: Canada Advanced Therapy Medicinal Products Market Revenue (Million) Forecast, by Application 2019 & 2032
- Table 88: Canada Advanced Therapy Medicinal Products Market Volume (K Unit) Forecast, by Application 2019 & 2032
- Table 89: Mexico Advanced Therapy Medicinal Products Market Revenue (Million) Forecast, by Application 2019 & 2032
- Table 90: Mexico Advanced Therapy Medicinal Products Market Volume (K Unit) Forecast, by Application 2019 & 2032
- Table 91: Global Advanced Therapy Medicinal Products Market Revenue Million Forecast, by Country 2019 & 2032
- Table 92: Global Advanced Therapy Medicinal Products Market Volume K Unit Forecast, by Country 2019 & 2032
- Table 93: United Arab Emirates Advanced Therapy Medicinal Products Market Revenue (Million) Forecast, by Application 2019 & 2032
- Table 94: United Arab Emirates Advanced Therapy Medicinal Products Market Volume (K Unit) Forecast, by Application 2019 & 2032
- Table 95: Saudi Arabia Advanced Therapy Medicinal Products Market Revenue (Million) Forecast, by Application 2019 & 2032
- Table 96: Saudi Arabia Advanced Therapy Medicinal Products Market Volume (K Unit) Forecast, by Application 2019 & 2032
- Table 97: South Africa Advanced Therapy Medicinal Products Market Revenue (Million) Forecast, by Application 2019 & 2032
- Table 98: South Africa Advanced Therapy Medicinal Products Market Volume (K Unit) Forecast, by Application 2019 & 2032
- Table 99: Rest of Middle East and Africa Advanced Therapy Medicinal Products Market Revenue (Million) Forecast, by Application 2019 & 2032
- Table 100: Rest of Middle East and Africa Advanced Therapy Medicinal Products Market Volume (K Unit) Forecast, by Application 2019 & 2032
- Table 101: Global Advanced Therapy Medicinal Products Market Revenue Million Forecast, by Therapy Type 2019 & 2032
- Table 102: Global Advanced Therapy Medicinal Products Market Volume K Unit Forecast, by Therapy Type 2019 & 2032
- Table 103: Global Advanced Therapy Medicinal Products Market Revenue Million Forecast, by Application 2019 & 2032
- Table 104: Global Advanced Therapy Medicinal Products Market Volume K Unit Forecast, by Application 2019 & 2032
- Table 105: Global Advanced Therapy Medicinal Products Market Revenue Million Forecast, by End User 2019 & 2032
- Table 106: Global Advanced Therapy Medicinal Products Market Volume K Unit Forecast, by End User 2019 & 2032
- Table 107: Global Advanced Therapy Medicinal Products Market Revenue Million Forecast, by Country 2019 & 2032
- Table 108: Global Advanced Therapy Medicinal Products Market Volume K Unit Forecast, by Country 2019 & 2032
- Table 109: United States Advanced Therapy Medicinal Products Market Revenue (Million) Forecast, by Application 2019 & 2032
- Table 110: United States Advanced Therapy Medicinal Products Market Volume (K Unit) Forecast, by Application 2019 & 2032
- Table 111: Canada Advanced Therapy Medicinal Products Market Revenue (Million) Forecast, by Application 2019 & 2032
- Table 112: Canada Advanced Therapy Medicinal Products Market Volume (K Unit) Forecast, by Application 2019 & 2032
- Table 113: Global Advanced Therapy Medicinal Products Market Revenue Million Forecast, by Therapy Type 2019 & 2032
- Table 114: Global Advanced Therapy Medicinal Products Market Volume K Unit Forecast, by Therapy Type 2019 & 2032
- Table 115: Global Advanced Therapy Medicinal Products Market Revenue Million Forecast, by Application 2019 & 2032
- Table 116: Global Advanced Therapy Medicinal Products Market Volume K Unit Forecast, by Application 2019 & 2032
- Table 117: Global Advanced Therapy Medicinal Products Market Revenue Million Forecast, by End User 2019 & 2032
- Table 118: Global Advanced Therapy Medicinal Products Market Volume K Unit Forecast, by End User 2019 & 2032
- Table 119: Global Advanced Therapy Medicinal Products Market Revenue Million Forecast, by Country 2019 & 2032
- Table 120: Global Advanced Therapy Medicinal Products Market Volume K Unit Forecast, by Country 2019 & 2032
- Table 121: Germany Advanced Therapy Medicinal Products Market Revenue (Million) Forecast, by Application 2019 & 2032
- Table 122: Germany Advanced Therapy Medicinal Products Market Volume (K Unit) Forecast, by Application 2019 & 2032
- Table 123: United Kingdom Advanced Therapy Medicinal Products Market Revenue (Million) Forecast, by Application 2019 & 2032
- Table 124: United Kingdom Advanced Therapy Medicinal Products Market Volume (K Unit) Forecast, by Application 2019 & 2032
- Table 125: France Advanced Therapy Medicinal Products Market Revenue (Million) Forecast, by Application 2019 & 2032
- Table 126: France Advanced Therapy Medicinal Products Market Volume (K Unit) Forecast, by Application 2019 & 2032
- Table 127: Italy Advanced Therapy Medicinal Products Market Revenue (Million) Forecast, by Application 2019 & 2032
- Table 128: Italy Advanced Therapy Medicinal Products Market Volume (K Unit) Forecast, by Application 2019 & 2032
- Table 129: Spain Advanced Therapy Medicinal Products Market Revenue (Million) Forecast, by Application 2019 & 2032
- Table 130: Spain Advanced Therapy Medicinal Products Market Volume (K Unit) Forecast, by Application 2019 & 2032
- Table 131: Rest of Europe Advanced Therapy Medicinal Products Market Revenue (Million) Forecast, by Application 2019 & 2032
- Table 132: Rest of Europe Advanced Therapy Medicinal Products Market Volume (K Unit) Forecast, by Application 2019 & 2032
- Table 133: Global Advanced Therapy Medicinal Products Market Revenue Million Forecast, by Therapy Type 2019 & 2032
- Table 134: Global Advanced Therapy Medicinal Products Market Volume K Unit Forecast, by Therapy Type 2019 & 2032
- Table 135: Global Advanced Therapy Medicinal Products Market Revenue Million Forecast, by Application 2019 & 2032
- Table 136: Global Advanced Therapy Medicinal Products Market Volume K Unit Forecast, by Application 2019 & 2032
- Table 137: Global Advanced Therapy Medicinal Products Market Revenue Million Forecast, by End User 2019 & 2032
- Table 138: Global Advanced Therapy Medicinal Products Market Volume K Unit Forecast, by End User 2019 & 2032
- Table 139: Global Advanced Therapy Medicinal Products Market Revenue Million Forecast, by Country 2019 & 2032
- Table 140: Global Advanced Therapy Medicinal Products Market Volume K Unit Forecast, by Country 2019 & 2032
- Table 141: China Advanced Therapy Medicinal Products Market Revenue (Million) Forecast, by Application 2019 & 2032
- Table 142: China Advanced Therapy Medicinal Products Market Volume (K Unit) Forecast, by Application 2019 & 2032
- Table 143: Japan Advanced Therapy Medicinal Products Market Revenue (Million) Forecast, by Application 2019 & 2032
- Table 144: Japan Advanced Therapy Medicinal Products Market Volume (K Unit) Forecast, by Application 2019 & 2032
- Table 145: India Advanced Therapy Medicinal Products Market Revenue (Million) Forecast, by Application 2019 & 2032
- Table 146: India Advanced Therapy Medicinal Products Market Volume (K Unit) Forecast, by Application 2019 & 2032
- Table 147: Australia Advanced Therapy Medicinal Products Market Revenue (Million) Forecast, by Application 2019 & 2032
- Table 148: Australia Advanced Therapy Medicinal Products Market Volume (K Unit) Forecast, by Application 2019 & 2032
- Table 149: South Korea Advanced Therapy Medicinal Products Market Revenue (Million) Forecast, by Application 2019 & 2032
- Table 150: South Korea Advanced Therapy Medicinal Products Market Volume (K Unit) Forecast, by Application 2019 & 2032
- Table 151: Rest of Asia Pacific Advanced Therapy Medicinal Products Market Revenue (Million) Forecast, by Application 2019 & 2032
- Table 152: Rest of Asia Pacific Advanced Therapy Medicinal Products Market Volume (K Unit) Forecast, by Application 2019 & 2032
- Table 153: Global Advanced Therapy Medicinal Products Market Revenue Million Forecast, by Therapy Type 2019 & 2032
- Table 154: Global Advanced Therapy Medicinal Products Market Volume K Unit Forecast, by Therapy Type 2019 & 2032
- Table 155: Global Advanced Therapy Medicinal Products Market Revenue Million Forecast, by Application 2019 & 2032
- Table 156: Global Advanced Therapy Medicinal Products Market Volume K Unit Forecast, by Application 2019 & 2032
- Table 157: Global Advanced Therapy Medicinal Products Market Revenue Million Forecast, by End User 2019 & 2032
- Table 158: Global Advanced Therapy Medicinal Products Market Volume K Unit Forecast, by End User 2019 & 2032
- Table 159: Global Advanced Therapy Medicinal Products Market Revenue Million Forecast, by Country 2019 & 2032
- Table 160: Global Advanced Therapy Medicinal Products Market Volume K Unit Forecast, by Country 2019 & 2032
Frequently Asked Questions
1. What is the projected Compound Annual Growth Rate (CAGR) of the Advanced Therapy Medicinal Products Market?
The projected CAGR is approximately 13.00%.
2. Which companies are prominent players in the Advanced Therapy Medicinal Products Market?
Key companies in the market include Novartis AG, F Hoffmann-La Roche Ltd, Kolon TissueGene Inc, UniQure NV, PHARMICELL Co Ltd, Vericel Corporation, Bluebird Bio Inc, JCR Pharmaceuticals Co Ltd, Gilead Sciences Inc, Bristol-Myers Squibb Company.
3. What are the main segments of the Advanced Therapy Medicinal Products Market?
The market segments include Therapy Type, Application, End User.
4. Can you provide details about the market size?
The market size is estimated to be USD XX Million as of 2022.
5. What are some drivers contributing to market growth?
Rising Number of Clinical Trials for ATMPs; Growing Competition Among Market Players.
6. What are the notable trends driving market growth?
The Tissue-Engineered Product Segment is Expected to Hold a Major Market Share in the Advanced Therapy Medicinal Products (ATMPs) Market.
7. Are there any restraints impacting market growth?
Affordability and Financial Sustainability Related Challenges.
8. Can you provide examples of recent developments in the market?
N/A
9. What pricing options are available for accessing the report?
Pricing options include single-user, multi-user, and enterprise licenses priced at USD 4750, USD 5250, and USD 8750 respectively.
10. Is the market size provided in terms of value or volume?
The market size is provided in terms of value, measured in Million and volume, measured in K Unit.
11. Are there any specific market keywords associated with the report?
Yes, the market keyword associated with the report is "Advanced Therapy Medicinal Products Market," which aids in identifying and referencing the specific market segment covered.
12. How do I determine which pricing option suits my needs best?
The pricing options vary based on user requirements and access needs. Individual users may opt for single-user licenses, while businesses requiring broader access may choose multi-user or enterprise licenses for cost-effective access to the report.
13. Are there any additional resources or data provided in the Advanced Therapy Medicinal Products Market report?
While the report offers comprehensive insights, it's advisable to review the specific contents or supplementary materials provided to ascertain if additional resources or data are available.
14. How can I stay updated on further developments or reports in the Advanced Therapy Medicinal Products Market?
To stay informed about further developments, trends, and reports in the Advanced Therapy Medicinal Products Market, consider subscribing to industry newsletters, following relevant companies and organizations, or regularly checking reputable industry news sources and publications.
Methodology
Step 1 - Identification of Relevant Samples Size from Population Database


Step 2 - Approaches for Defining Global Market Size (Value, Volume* & Price*)

Note*: In applicable scenarios
Step 3 - Data Sources
Primary Research
- Web Analytics
- Survey Reports
- Research Institute
- Latest Research Reports
- Opinion Leaders
Secondary Research
- Annual Reports
- White Paper
- Latest Press Release
- Industry Association
- Paid Database
- Investor Presentations

Step 4 - Data Triangulation
Involves using different sources of information in order to increase the validity of a study
These sources are likely to be stakeholders in a program - participants, other researchers, program staff, other community members, and so on.
Then we put all data in single framework & apply various statistical tools to find out the dynamic on the market.
During the analysis stage, feedback from the stakeholder groups would be compared to determine areas of agreement as well as areas of divergence


