
Key Insights
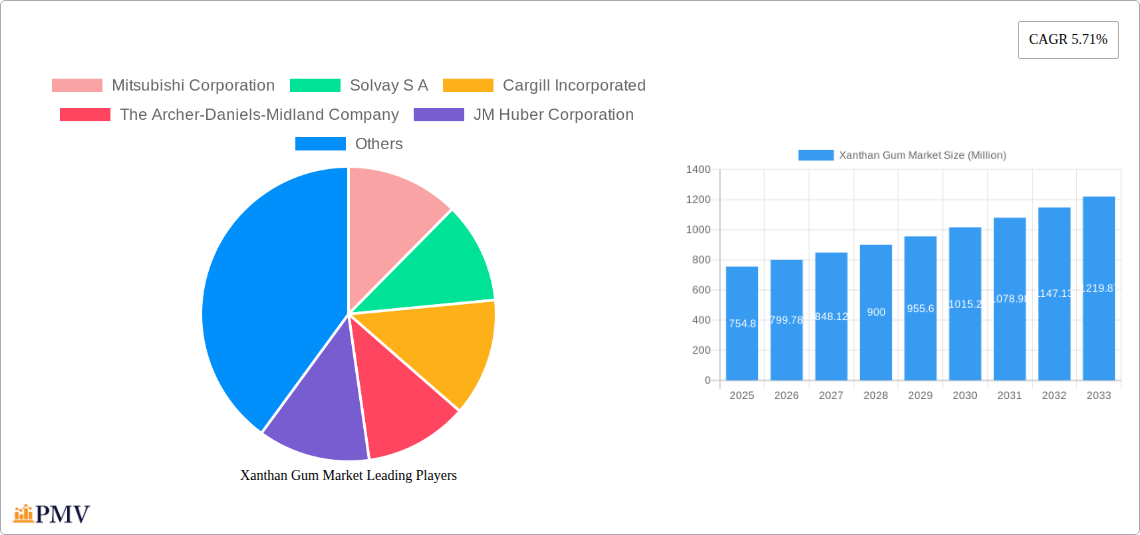
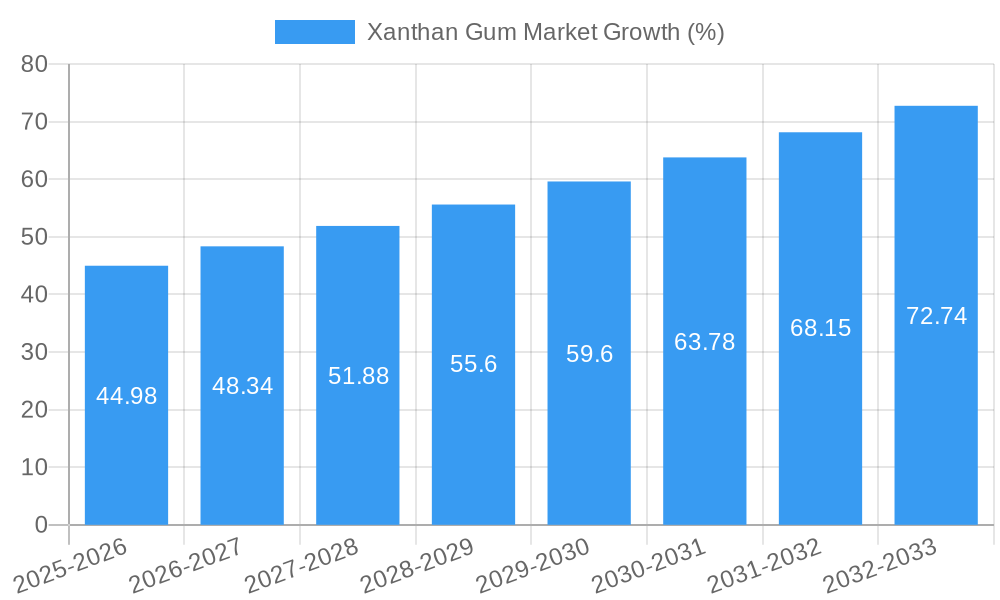
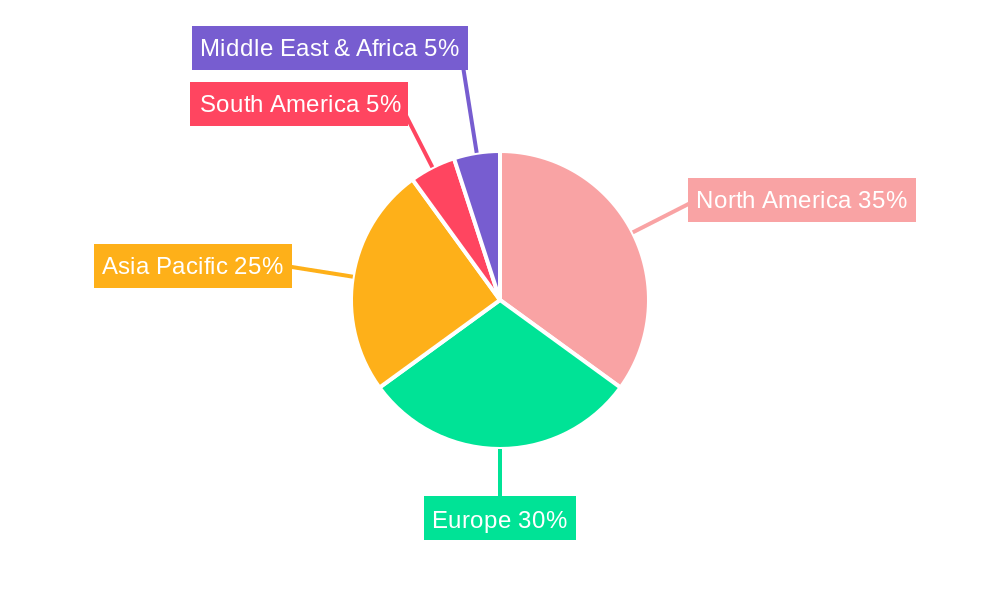
The global xanthan gum market, valued at $754.80 million in 2025, is projected to experience robust growth, driven by increasing demand across diverse sectors. The Compound Annual Growth Rate (CAGR) of 5.71% from 2025 to 2033 indicates a significant expansion, primarily fueled by the food and beverage industry's adoption of xanthan gum as a stabilizer, thickener, and emulsifier. The rising popularity of processed foods and convenience foods globally significantly boosts market growth. Furthermore, the pharmaceutical industry utilizes xanthan gum as a binder and suspending agent in various formulations, contributing to market expansion. The personal care and cosmetics sector also leverages its thickening and stabilizing properties in creams, lotions, and shampoos. While the oil refinery sector's application is relatively niche, it contributes to the overall market size. Growth is further facilitated by continuous innovation in xanthan gum production processes leading to improved quality and cost-effectiveness. However, factors like price fluctuations in raw materials and potential regulatory hurdles in certain regions might act as restraints. The market is segmented by form (liquid and dry) and application (food and beverages, pharmaceuticals, personal care and cosmetics, oil refinery, other applications), offering diverse growth opportunities across geographical regions. North America and Europe currently hold significant market share, owing to high consumption in food and beverage industries, and established personal care sectors. However, the Asia-Pacific region is expected to witness accelerated growth in the coming years due to rapid economic development and increasing consumer demand for processed foods.
The competitive landscape is marked by the presence of both large multinational corporations such as Mitsubishi Corporation, Solvay S.A., and Cargill Incorporated, and specialized producers like Foodchem International Corporation and Deosen Biochemical Ltd. These companies are focusing on expanding their product portfolios, enhancing distribution networks, and implementing strategic partnerships to cater to the growing market demand. The ongoing research and development activities aimed at improving the functionalities and applications of xanthan gum further contribute to its market attractiveness. Future growth will largely depend on consumer preference shifts towards processed foods, technological advancements in production methods, and successful navigation of raw material cost volatility and regulatory considerations.
Xanthan Gum Market: A Comprehensive Report (2019-2033)
This detailed report provides a comprehensive analysis of the global Xanthan Gum market, covering the period from 2019 to 2033. It offers invaluable insights into market dynamics, competitive landscapes, and future growth projections, empowering businesses to make informed strategic decisions. The report leverages extensive primary and secondary research, incorporating data from reputable sources and industry experts. The base year for this report is 2025, with the estimated year also being 2025, and a forecast period spanning 2025-2033, while the historical period covered is 2019-2024. The market is valued at xx Million in 2025 and is projected to reach xx Million by 2033, exhibiting a CAGR of xx% during the forecast period.
Xanthan Gum Market Market Structure & Competitive Dynamics
The Xanthan Gum market exhibits a moderately consolidated structure, with key players holding significant market share. The leading companies, including Mitsubishi Corporation, Solvay S.A., Cargill Incorporated, The Archer-Daniels-Midland Company, JM Huber Corporation, Foodchem International Corporation, Ingredion Incorporated, International Flavours and Fragrances Inc, Deosen Biochemical Ltd, and C.E. Roeper GmbH, actively compete through product innovation, strategic partnerships, and capacity expansions. The market's competitive dynamics are characterized by intense rivalry, particularly in the food and beverage sector.
- Market Concentration: The top five players collectively hold an estimated xx% market share, indicating a moderate level of concentration.
- Innovation Ecosystems: Significant investments are being made in R&D to develop novel xanthan gum applications and improve production efficiency. This is driven by increasing demand across diverse sectors.
- Regulatory Frameworks: Stringent food safety regulations and environmental standards influence the manufacturing processes and product formulations. Compliance costs can vary across regions.
- Product Substitutes: Alternative thickening and stabilizing agents, such as guar gum and locust bean gum, exert competitive pressure on xanthan gum. However, xanthan gum's superior properties often make it the preferred choice.
- End-User Trends: Growing demand for clean-label products and functional foods is fueling the adoption of xanthan gum in various applications. The rising preference for convenience foods also contributes to market growth.
- M&A Activities: The market has witnessed several mergers and acquisitions in recent years, with deal values ranging from xx Million to xx Million. These activities aim to expand market reach, strengthen product portfolios, and enhance technological capabilities.
Xanthan Gum Market Industry Trends & Insights
The global xanthan gum market is experiencing robust growth, driven by several factors. The increasing demand for processed food and beverages, coupled with the expanding applications in pharmaceuticals and personal care, significantly fuels market expansion. Technological advancements in manufacturing processes lead to improved product quality and reduced costs. Consumer preference for natural and sustainable ingredients further propels market growth. The market is also witnessing a trend towards customization, with manufacturers catering to specific end-user requirements. The market's competitive landscape is dynamic, with companies investing in innovation and capacity expansion to maintain their market positions.
- Market Growth Drivers: The rising demand for processed foods, expansion of the pharmaceutical and personal care industries, and technological advancements contribute significantly to market growth.
- Technological Disruptions: Improved fermentation processes and novel extraction techniques enhance production efficiency and product quality.
- Consumer Preferences: Growing demand for natural, sustainable, and clean-label products creates a significant opportunity for xanthan gum producers.
- Competitive Dynamics: The competitive landscape is characterized by strategic partnerships, mergers & acquisitions, and capacity expansions.
Dominant Markets & Segments in Xanthan Gum Market
The Food and Beverages segment currently dominates the Xanthan Gum market, accounting for a significant share of global consumption. This is primarily due to xanthan gum's extensive use as a thickening, stabilizing, and emulsifying agent in various food products. Geographically, North America and Asia-Pacific represent the largest markets, driven by robust economic growth, expanding food processing industries, and rising consumer demand.
Key Drivers for Food and Beverages Dominance:
- High demand for processed foods and beverages.
- Growing consumer preference for convenience foods.
- Increasing adoption of xanthan gum as a clean-label ingredient.
Dominant Region: North America currently holds the largest market share, followed by Asia-Pacific.
Dominant Form: The dry form of xanthan gum currently holds a larger market share than the liquid form.
Other Applications: While the Food and Beverage sector dominates, the pharmaceuticals, personal care & cosmetics, and oil refinery sectors exhibit significant growth potential.
Regional Dominance Analysis: The dominance of North America is attributed to its well-established food processing industry, high consumer spending, and strong regulatory framework. Asia-Pacific is experiencing rapid growth due to its expanding population, rising disposable incomes, and growing demand for processed foods.
Xanthan Gum Market Product Innovations
Recent innovations focus on developing xanthan gum with enhanced functional properties, such as improved viscosity and stability at different pH levels. These innovations cater to specific application needs and offer superior performance compared to conventional xanthan gum. Companies are also investing in sustainable production methods to reduce environmental impact and meet growing consumer demand for eco-friendly products. The focus is on delivering customized solutions tailored to specific industry requirements and expanding into new application areas.
Report Segmentation & Scope
The Xanthan Gum market is segmented by form (liquid, dry) and application (food and beverages, pharmaceuticals, personal care and cosmetics, oil refinery, other applications). Each segment presents distinct growth trajectories and competitive dynamics.
Form: The dry form segment is expected to witness faster growth due to its ease of handling, storage, and transportation. The liquid form, however, holds importance in specific applications requiring immediate use.
Application: The food and beverage segment currently dominates, but significant growth potential exists in pharmaceuticals, personal care, and other applications. The oil refinery segment offers niche market opportunities.
Key Drivers of Xanthan Gum Market Growth
Several factors drive the Xanthan Gum market's growth. The rising demand for processed foods, expanding applications in pharmaceuticals and personal care, and advancements in production technology play pivotal roles. Favorable economic conditions and supportive government policies also stimulate market expansion.
Challenges in the Xanthan Gum Market Sector
Fluctuations in raw material prices, stringent regulatory compliance requirements, and intense competition present significant challenges. Supply chain disruptions can affect production and market availability, impacting pricing and profitability.
Leading Players in the Xanthan Gum Market Market
- Mitsubishi Corporation
- Solvay S.A.
- Cargill Incorporated
- The Archer-Daniels-Midland Company
- JM Huber Corporation
- Foodchem International Corporation
- Ingredion Incorporated
- International Flavours and Fragrances Inc
- Deosen Biochemical Ltd
- C.E. Roeper GmbH
Key Developments in Xanthan Gum Market Sector
- November 2023: Mitsubishi Corporation Life Sciences Limited expanded its food ingredient product capacity by approximately 1,000 metric tons annually, enhancing its market position.
- October 2022: Cargill's launch of a digital business studio in Asia aims to accelerate innovation and market access in the Asia-Pacific food and agriculture industry.
- July 2022: CP Kelco's expansion of bio-gum production capacity, including xanthan gum, strengthens its global supply chain and market presence.
Strategic Xanthan Gum Market Market Outlook
The Xanthan Gum market is poised for continued growth, driven by increasing demand across various sectors and ongoing product innovation. Strategic investments in R&D, sustainable production practices, and expansion into new applications will be crucial for success. Companies focusing on customization and catering to specific end-user requirements are expected to gain a competitive edge.
Xanthan Gum Market Segmentation
-
1. Form
- 1.1. Liquid
- 1.2. Dry
-
2. Application
-
2.1. Food and Beverages
- 2.1.1. Bakery Products
- 2.1.2. Confectionery
- 2.1.3. Meat Products
- 2.1.4. Frozen Food
- 2.1.5. Dairy Products
- 2.1.6. Others
- 2.2. Pharmaceuticals
- 2.3. Personal care and Cosmetics
- 2.4. Oil Refinery
- 2.5. Other Applications
-
2.1. Food and Beverages
Xanthan Gum Market Segmentation By Geography
-
1. North America
- 1.1. United States
- 1.2. Canada
- 1.3. Mexico
- 1.4. Rest of North America
-
2. Europe
- 2.1. Spain
- 2.2. United Kingdom
- 2.3. Germany
- 2.4. France
- 2.5. Italy
- 2.6. Russia
- 2.7. Rest of Europe
-
3. Asia Pacific
- 3.1. China
- 3.2. Japan
- 3.3. India
- 3.4. Australia
- 3.5. Rest of Asia Pacific
-
4. South America
- 4.1. Brazil
- 4.2. Argentina
- 4.3. Rest of South America
- 5. Middle East
-
6. South Africa
- 6.1. United Arab Emrates
- 6.2. Rest of Middle East and Africa
Xanthan Gum Market REPORT HIGHLIGHTS
| Aspects | Details |
|---|---|
| Study Period | 2019-2033 |
| Base Year | 2024 |
| Estimated Year | 2025 |
| Forecast Period | 2025-2033 |
| Historical Period | 2019-2024 |
| Growth Rate | CAGR of 5.71% from 2019-2033 |
| Segmentation |
|
Table of Contents
- 1. Introduction
- 1.1. Research Scope
- 1.2. Market Segmentation
- 1.3. Research Methodology
- 1.4. Definitions and Assumptions
- 2. Executive Summary
- 2.1. Introduction
- 3. Market Dynamics
- 3.1. Introduction
- 3.2. Market Drivers
- 3.2.1. Wide Applications and Functionality; Demand For Gluten-Free Products
- 3.3. Market Restrains
- 3.3.1. Easy Availability of Economically Feasible Alternatives
- 3.4. Market Trends
- 3.4.1. Food and Beverage Industry is the Biggest Consumer of Xanthan Gum
- 4. Market Factor Analysis
- 4.1. Porters Five Forces
- 4.2. Supply/Value Chain
- 4.3. PESTEL analysis
- 4.4. Market Entropy
- 4.5. Patent/Trademark Analysis
- 5. Global Xanthan Gum Market Analysis, Insights and Forecast, 2019-2031
- 5.1. Market Analysis, Insights and Forecast - by Form
- 5.1.1. Liquid
- 5.1.2. Dry
- 5.2. Market Analysis, Insights and Forecast - by Application
- 5.2.1. Food and Beverages
- 5.2.1.1. Bakery Products
- 5.2.1.2. Confectionery
- 5.2.1.3. Meat Products
- 5.2.1.4. Frozen Food
- 5.2.1.5. Dairy Products
- 5.2.1.6. Others
- 5.2.2. Pharmaceuticals
- 5.2.3. Personal care and Cosmetics
- 5.2.4. Oil Refinery
- 5.2.5. Other Applications
- 5.2.1. Food and Beverages
- 5.3. Market Analysis, Insights and Forecast - by Region
- 5.3.1. North America
- 5.3.2. Europe
- 5.3.3. Asia Pacific
- 5.3.4. South America
- 5.3.5. Middle East
- 5.3.6. South Africa
- 5.1. Market Analysis, Insights and Forecast - by Form
- 6. North America Xanthan Gum Market Analysis, Insights and Forecast, 2019-2031
- 6.1. Market Analysis, Insights and Forecast - by Form
- 6.1.1. Liquid
- 6.1.2. Dry
- 6.2. Market Analysis, Insights and Forecast - by Application
- 6.2.1. Food and Beverages
- 6.2.1.1. Bakery Products
- 6.2.1.2. Confectionery
- 6.2.1.3. Meat Products
- 6.2.1.4. Frozen Food
- 6.2.1.5. Dairy Products
- 6.2.1.6. Others
- 6.2.2. Pharmaceuticals
- 6.2.3. Personal care and Cosmetics
- 6.2.4. Oil Refinery
- 6.2.5. Other Applications
- 6.2.1. Food and Beverages
- 6.1. Market Analysis, Insights and Forecast - by Form
- 7. Europe Xanthan Gum Market Analysis, Insights and Forecast, 2019-2031
- 7.1. Market Analysis, Insights and Forecast - by Form
- 7.1.1. Liquid
- 7.1.2. Dry
- 7.2. Market Analysis, Insights and Forecast - by Application
- 7.2.1. Food and Beverages
- 7.2.1.1. Bakery Products
- 7.2.1.2. Confectionery
- 7.2.1.3. Meat Products
- 7.2.1.4. Frozen Food
- 7.2.1.5. Dairy Products
- 7.2.1.6. Others
- 7.2.2. Pharmaceuticals
- 7.2.3. Personal care and Cosmetics
- 7.2.4. Oil Refinery
- 7.2.5. Other Applications
- 7.2.1. Food and Beverages
- 7.1. Market Analysis, Insights and Forecast - by Form
- 8. Asia Pacific Xanthan Gum Market Analysis, Insights and Forecast, 2019-2031
- 8.1. Market Analysis, Insights and Forecast - by Form
- 8.1.1. Liquid
- 8.1.2. Dry
- 8.2. Market Analysis, Insights and Forecast - by Application
- 8.2.1. Food and Beverages
- 8.2.1.1. Bakery Products
- 8.2.1.2. Confectionery
- 8.2.1.3. Meat Products
- 8.2.1.4. Frozen Food
- 8.2.1.5. Dairy Products
- 8.2.1.6. Others
- 8.2.2. Pharmaceuticals
- 8.2.3. Personal care and Cosmetics
- 8.2.4. Oil Refinery
- 8.2.5. Other Applications
- 8.2.1. Food and Beverages
- 8.1. Market Analysis, Insights and Forecast - by Form
- 9. South America Xanthan Gum Market Analysis, Insights and Forecast, 2019-2031
- 9.1. Market Analysis, Insights and Forecast - by Form
- 9.1.1. Liquid
- 9.1.2. Dry
- 9.2. Market Analysis, Insights and Forecast - by Application
- 9.2.1. Food and Beverages
- 9.2.1.1. Bakery Products
- 9.2.1.2. Confectionery
- 9.2.1.3. Meat Products
- 9.2.1.4. Frozen Food
- 9.2.1.5. Dairy Products
- 9.2.1.6. Others
- 9.2.2. Pharmaceuticals
- 9.2.3. Personal care and Cosmetics
- 9.2.4. Oil Refinery
- 9.2.5. Other Applications
- 9.2.1. Food and Beverages
- 9.1. Market Analysis, Insights and Forecast - by Form
- 10. Middle East Xanthan Gum Market Analysis, Insights and Forecast, 2019-2031
- 10.1. Market Analysis, Insights and Forecast - by Form
- 10.1.1. Liquid
- 10.1.2. Dry
- 10.2. Market Analysis, Insights and Forecast - by Application
- 10.2.1. Food and Beverages
- 10.2.1.1. Bakery Products
- 10.2.1.2. Confectionery
- 10.2.1.3. Meat Products
- 10.2.1.4. Frozen Food
- 10.2.1.5. Dairy Products
- 10.2.1.6. Others
- 10.2.2. Pharmaceuticals
- 10.2.3. Personal care and Cosmetics
- 10.2.4. Oil Refinery
- 10.2.5. Other Applications
- 10.2.1. Food and Beverages
- 10.1. Market Analysis, Insights and Forecast - by Form
- 11. South Africa Xanthan Gum Market Analysis, Insights and Forecast, 2019-2031
- 11.1. Market Analysis, Insights and Forecast - by Form
- 11.1.1. Liquid
- 11.1.2. Dry
- 11.2. Market Analysis, Insights and Forecast - by Application
- 11.2.1. Food and Beverages
- 11.2.1.1. Bakery Products
- 11.2.1.2. Confectionery
- 11.2.1.3. Meat Products
- 11.2.1.4. Frozen Food
- 11.2.1.5. Dairy Products
- 11.2.1.6. Others
- 11.2.2. Pharmaceuticals
- 11.2.3. Personal care and Cosmetics
- 11.2.4. Oil Refinery
- 11.2.5. Other Applications
- 11.2.1. Food and Beverages
- 11.1. Market Analysis, Insights and Forecast - by Form
- 12. North America Xanthan Gum Market Analysis, Insights and Forecast, 2019-2031
- 12.1. Market Analysis, Insights and Forecast - By Country/Sub-region
- 12.1.1 United States
- 12.1.2 Canada
- 12.1.3 Mexico
- 12.1.4 Rest of North America
- 13. Europe Xanthan Gum Market Analysis, Insights and Forecast, 2019-2031
- 13.1. Market Analysis, Insights and Forecast - By Country/Sub-region
- 13.1.1 Spain
- 13.1.2 United Kingdom
- 13.1.3 Germany
- 13.1.4 France
- 13.1.5 Italy
- 13.1.6 Russia
- 13.1.7 Rest of Europe
- 14. Asia Pacific Xanthan Gum Market Analysis, Insights and Forecast, 2019-2031
- 14.1. Market Analysis, Insights and Forecast - By Country/Sub-region
- 14.1.1 China
- 14.1.2 Japan
- 14.1.3 India
- 14.1.4 Australia
- 14.1.5 Rest of Asia Pacific
- 15. South America Xanthan Gum Market Analysis, Insights and Forecast, 2019-2031
- 15.1. Market Analysis, Insights and Forecast - By Country/Sub-region
- 15.1.1 Brazil
- 15.1.2 Argentina
- 15.1.3 Rest of South America
- 16. South Africa Xanthan Gum Market Analysis, Insights and Forecast, 2019-2031
- 16.1. Market Analysis, Insights and Forecast - By Country/Sub-region
- 16.1.1 United Arab Emrates
- 16.1.2 Rest of Middle East and Africa
- 17. Competitive Analysis
- 17.1. Global Market Share Analysis 2024
- 17.2. Company Profiles
- 17.2.1 Mitsubishi Corporation
- 17.2.1.1. Overview
- 17.2.1.2. Products
- 17.2.1.3. SWOT Analysis
- 17.2.1.4. Recent Developments
- 17.2.1.5. Financials (Based on Availability)
- 17.2.2 Solvay S A
- 17.2.2.1. Overview
- 17.2.2.2. Products
- 17.2.2.3. SWOT Analysis
- 17.2.2.4. Recent Developments
- 17.2.2.5. Financials (Based on Availability)
- 17.2.3 Cargill Incorporated
- 17.2.3.1. Overview
- 17.2.3.2. Products
- 17.2.3.3. SWOT Analysis
- 17.2.3.4. Recent Developments
- 17.2.3.5. Financials (Based on Availability)
- 17.2.4 The Archer-Daniels-Midland Company
- 17.2.4.1. Overview
- 17.2.4.2. Products
- 17.2.4.3. SWOT Analysis
- 17.2.4.4. Recent Developments
- 17.2.4.5. Financials (Based on Availability)
- 17.2.5 JM Huber Corporation
- 17.2.5.1. Overview
- 17.2.5.2. Products
- 17.2.5.3. SWOT Analysis
- 17.2.5.4. Recent Developments
- 17.2.5.5. Financials (Based on Availability)
- 17.2.6 Foodchem International Corporation
- 17.2.6.1. Overview
- 17.2.6.2. Products
- 17.2.6.3. SWOT Analysis
- 17.2.6.4. Recent Developments
- 17.2.6.5. Financials (Based on Availability)
- 17.2.7 Ingredion Incorporated
- 17.2.7.1. Overview
- 17.2.7.2. Products
- 17.2.7.3. SWOT Analysis
- 17.2.7.4. Recent Developments
- 17.2.7.5. Financials (Based on Availability)
- 17.2.8 International Flavours and Fragrances Inc
- 17.2.8.1. Overview
- 17.2.8.2. Products
- 17.2.8.3. SWOT Analysis
- 17.2.8.4. Recent Developments
- 17.2.8.5. Financials (Based on Availability)
- 17.2.9 Deosen Biochemical Ltd
- 17.2.9.1. Overview
- 17.2.9.2. Products
- 17.2.9.3. SWOT Analysis
- 17.2.9.4. Recent Developments
- 17.2.9.5. Financials (Based on Availability)
- 17.2.10 C E Roeper GmbH
- 17.2.10.1. Overview
- 17.2.10.2. Products
- 17.2.10.3. SWOT Analysis
- 17.2.10.4. Recent Developments
- 17.2.10.5. Financials (Based on Availability)
- 17.2.1 Mitsubishi Corporation
List of Figures
- Figure 1: Global Xanthan Gum Market Revenue Breakdown (Million, %) by Region 2024 & 2032
- Figure 2: North America Xanthan Gum Market Revenue (Million), by Country 2024 & 2032
- Figure 3: North America Xanthan Gum Market Revenue Share (%), by Country 2024 & 2032
- Figure 4: Europe Xanthan Gum Market Revenue (Million), by Country 2024 & 2032
- Figure 5: Europe Xanthan Gum Market Revenue Share (%), by Country 2024 & 2032
- Figure 6: Asia Pacific Xanthan Gum Market Revenue (Million), by Country 2024 & 2032
- Figure 7: Asia Pacific Xanthan Gum Market Revenue Share (%), by Country 2024 & 2032
- Figure 8: South America Xanthan Gum Market Revenue (Million), by Country 2024 & 2032
- Figure 9: South America Xanthan Gum Market Revenue Share (%), by Country 2024 & 2032
- Figure 10: South Africa Xanthan Gum Market Revenue (Million), by Country 2024 & 2032
- Figure 11: South Africa Xanthan Gum Market Revenue Share (%), by Country 2024 & 2032
- Figure 12: North America Xanthan Gum Market Revenue (Million), by Form 2024 & 2032
- Figure 13: North America Xanthan Gum Market Revenue Share (%), by Form 2024 & 2032
- Figure 14: North America Xanthan Gum Market Revenue (Million), by Application 2024 & 2032
- Figure 15: North America Xanthan Gum Market Revenue Share (%), by Application 2024 & 2032
- Figure 16: North America Xanthan Gum Market Revenue (Million), by Country 2024 & 2032
- Figure 17: North America Xanthan Gum Market Revenue Share (%), by Country 2024 & 2032
- Figure 18: Europe Xanthan Gum Market Revenue (Million), by Form 2024 & 2032
- Figure 19: Europe Xanthan Gum Market Revenue Share (%), by Form 2024 & 2032
- Figure 20: Europe Xanthan Gum Market Revenue (Million), by Application 2024 & 2032
- Figure 21: Europe Xanthan Gum Market Revenue Share (%), by Application 2024 & 2032
- Figure 22: Europe Xanthan Gum Market Revenue (Million), by Country 2024 & 2032
- Figure 23: Europe Xanthan Gum Market Revenue Share (%), by Country 2024 & 2032
- Figure 24: Asia Pacific Xanthan Gum Market Revenue (Million), by Form 2024 & 2032
- Figure 25: Asia Pacific Xanthan Gum Market Revenue Share (%), by Form 2024 & 2032
- Figure 26: Asia Pacific Xanthan Gum Market Revenue (Million), by Application 2024 & 2032
- Figure 27: Asia Pacific Xanthan Gum Market Revenue Share (%), by Application 2024 & 2032
- Figure 28: Asia Pacific Xanthan Gum Market Revenue (Million), by Country 2024 & 2032
- Figure 29: Asia Pacific Xanthan Gum Market Revenue Share (%), by Country 2024 & 2032
- Figure 30: South America Xanthan Gum Market Revenue (Million), by Form 2024 & 2032
- Figure 31: South America Xanthan Gum Market Revenue Share (%), by Form 2024 & 2032
- Figure 32: South America Xanthan Gum Market Revenue (Million), by Application 2024 & 2032
- Figure 33: South America Xanthan Gum Market Revenue Share (%), by Application 2024 & 2032
- Figure 34: South America Xanthan Gum Market Revenue (Million), by Country 2024 & 2032
- Figure 35: South America Xanthan Gum Market Revenue Share (%), by Country 2024 & 2032
- Figure 36: Middle East Xanthan Gum Market Revenue (Million), by Form 2024 & 2032
- Figure 37: Middle East Xanthan Gum Market Revenue Share (%), by Form 2024 & 2032
- Figure 38: Middle East Xanthan Gum Market Revenue (Million), by Application 2024 & 2032
- Figure 39: Middle East Xanthan Gum Market Revenue Share (%), by Application 2024 & 2032
- Figure 40: Middle East Xanthan Gum Market Revenue (Million), by Country 2024 & 2032
- Figure 41: Middle East Xanthan Gum Market Revenue Share (%), by Country 2024 & 2032
- Figure 42: South Africa Xanthan Gum Market Revenue (Million), by Form 2024 & 2032
- Figure 43: South Africa Xanthan Gum Market Revenue Share (%), by Form 2024 & 2032
- Figure 44: South Africa Xanthan Gum Market Revenue (Million), by Application 2024 & 2032
- Figure 45: South Africa Xanthan Gum Market Revenue Share (%), by Application 2024 & 2032
- Figure 46: South Africa Xanthan Gum Market Revenue (Million), by Country 2024 & 2032
- Figure 47: South Africa Xanthan Gum Market Revenue Share (%), by Country 2024 & 2032
List of Tables
- Table 1: Global Xanthan Gum Market Revenue Million Forecast, by Region 2019 & 2032
- Table 2: Global Xanthan Gum Market Revenue Million Forecast, by Form 2019 & 2032
- Table 3: Global Xanthan Gum Market Revenue Million Forecast, by Application 2019 & 2032
- Table 4: Global Xanthan Gum Market Revenue Million Forecast, by Region 2019 & 2032
- Table 5: Global Xanthan Gum Market Revenue Million Forecast, by Country 2019 & 2032
- Table 6: United States Xanthan Gum Market Revenue (Million) Forecast, by Application 2019 & 2032
- Table 7: Canada Xanthan Gum Market Revenue (Million) Forecast, by Application 2019 & 2032
- Table 8: Mexico Xanthan Gum Market Revenue (Million) Forecast, by Application 2019 & 2032
- Table 9: Rest of North America Xanthan Gum Market Revenue (Million) Forecast, by Application 2019 & 2032
- Table 10: Global Xanthan Gum Market Revenue Million Forecast, by Country 2019 & 2032
- Table 11: Spain Xanthan Gum Market Revenue (Million) Forecast, by Application 2019 & 2032
- Table 12: United Kingdom Xanthan Gum Market Revenue (Million) Forecast, by Application 2019 & 2032
- Table 13: Germany Xanthan Gum Market Revenue (Million) Forecast, by Application 2019 & 2032
- Table 14: France Xanthan Gum Market Revenue (Million) Forecast, by Application 2019 & 2032
- Table 15: Italy Xanthan Gum Market Revenue (Million) Forecast, by Application 2019 & 2032
- Table 16: Russia Xanthan Gum Market Revenue (Million) Forecast, by Application 2019 & 2032
- Table 17: Rest of Europe Xanthan Gum Market Revenue (Million) Forecast, by Application 2019 & 2032
- Table 18: Global Xanthan Gum Market Revenue Million Forecast, by Country 2019 & 2032
- Table 19: China Xanthan Gum Market Revenue (Million) Forecast, by Application 2019 & 2032
- Table 20: Japan Xanthan Gum Market Revenue (Million) Forecast, by Application 2019 & 2032
- Table 21: India Xanthan Gum Market Revenue (Million) Forecast, by Application 2019 & 2032
- Table 22: Australia Xanthan Gum Market Revenue (Million) Forecast, by Application 2019 & 2032
- Table 23: Rest of Asia Pacific Xanthan Gum Market Revenue (Million) Forecast, by Application 2019 & 2032
- Table 24: Global Xanthan Gum Market Revenue Million Forecast, by Country 2019 & 2032
- Table 25: Brazil Xanthan Gum Market Revenue (Million) Forecast, by Application 2019 & 2032
- Table 26: Argentina Xanthan Gum Market Revenue (Million) Forecast, by Application 2019 & 2032
- Table 27: Rest of South America Xanthan Gum Market Revenue (Million) Forecast, by Application 2019 & 2032
- Table 28: Global Xanthan Gum Market Revenue Million Forecast, by Country 2019 & 2032
- Table 29: United Arab Emrates Xanthan Gum Market Revenue (Million) Forecast, by Application 2019 & 2032
- Table 30: Rest of Middle East and Africa Xanthan Gum Market Revenue (Million) Forecast, by Application 2019 & 2032
- Table 31: Global Xanthan Gum Market Revenue Million Forecast, by Form 2019 & 2032
- Table 32: Global Xanthan Gum Market Revenue Million Forecast, by Application 2019 & 2032
- Table 33: Global Xanthan Gum Market Revenue Million Forecast, by Country 2019 & 2032
- Table 34: United States Xanthan Gum Market Revenue (Million) Forecast, by Application 2019 & 2032
- Table 35: Canada Xanthan Gum Market Revenue (Million) Forecast, by Application 2019 & 2032
- Table 36: Mexico Xanthan Gum Market Revenue (Million) Forecast, by Application 2019 & 2032
- Table 37: Rest of North America Xanthan Gum Market Revenue (Million) Forecast, by Application 2019 & 2032
- Table 38: Global Xanthan Gum Market Revenue Million Forecast, by Form 2019 & 2032
- Table 39: Global Xanthan Gum Market Revenue Million Forecast, by Application 2019 & 2032
- Table 40: Global Xanthan Gum Market Revenue Million Forecast, by Country 2019 & 2032
- Table 41: Spain Xanthan Gum Market Revenue (Million) Forecast, by Application 2019 & 2032
- Table 42: United Kingdom Xanthan Gum Market Revenue (Million) Forecast, by Application 2019 & 2032
- Table 43: Germany Xanthan Gum Market Revenue (Million) Forecast, by Application 2019 & 2032
- Table 44: France Xanthan Gum Market Revenue (Million) Forecast, by Application 2019 & 2032
- Table 45: Italy Xanthan Gum Market Revenue (Million) Forecast, by Application 2019 & 2032
- Table 46: Russia Xanthan Gum Market Revenue (Million) Forecast, by Application 2019 & 2032
- Table 47: Rest of Europe Xanthan Gum Market Revenue (Million) Forecast, by Application 2019 & 2032
- Table 48: Global Xanthan Gum Market Revenue Million Forecast, by Form 2019 & 2032
- Table 49: Global Xanthan Gum Market Revenue Million Forecast, by Application 2019 & 2032
- Table 50: Global Xanthan Gum Market Revenue Million Forecast, by Country 2019 & 2032
- Table 51: China Xanthan Gum Market Revenue (Million) Forecast, by Application 2019 & 2032
- Table 52: Japan Xanthan Gum Market Revenue (Million) Forecast, by Application 2019 & 2032
- Table 53: India Xanthan Gum Market Revenue (Million) Forecast, by Application 2019 & 2032
- Table 54: Australia Xanthan Gum Market Revenue (Million) Forecast, by Application 2019 & 2032
- Table 55: Rest of Asia Pacific Xanthan Gum Market Revenue (Million) Forecast, by Application 2019 & 2032
- Table 56: Global Xanthan Gum Market Revenue Million Forecast, by Form 2019 & 2032
- Table 57: Global Xanthan Gum Market Revenue Million Forecast, by Application 2019 & 2032
- Table 58: Global Xanthan Gum Market Revenue Million Forecast, by Country 2019 & 2032
- Table 59: Brazil Xanthan Gum Market Revenue (Million) Forecast, by Application 2019 & 2032
- Table 60: Argentina Xanthan Gum Market Revenue (Million) Forecast, by Application 2019 & 2032
- Table 61: Rest of South America Xanthan Gum Market Revenue (Million) Forecast, by Application 2019 & 2032
- Table 62: Global Xanthan Gum Market Revenue Million Forecast, by Form 2019 & 2032
- Table 63: Global Xanthan Gum Market Revenue Million Forecast, by Application 2019 & 2032
- Table 64: Global Xanthan Gum Market Revenue Million Forecast, by Country 2019 & 2032
- Table 65: Global Xanthan Gum Market Revenue Million Forecast, by Form 2019 & 2032
- Table 66: Global Xanthan Gum Market Revenue Million Forecast, by Application 2019 & 2032
- Table 67: Global Xanthan Gum Market Revenue Million Forecast, by Country 2019 & 2032
- Table 68: United Arab Emrates Xanthan Gum Market Revenue (Million) Forecast, by Application 2019 & 2032
- Table 69: Rest of Middle East and Africa Xanthan Gum Market Revenue (Million) Forecast, by Application 2019 & 2032
Frequently Asked Questions
1. What is the projected Compound Annual Growth Rate (CAGR) of the Xanthan Gum Market?
The projected CAGR is approximately 5.71%.
2. Which companies are prominent players in the Xanthan Gum Market?
Key companies in the market include Mitsubishi Corporation, Solvay S A, Cargill Incorporated, The Archer-Daniels-Midland Company, JM Huber Corporation , Foodchem International Corporation, Ingredion Incorporated, International Flavours and Fragrances Inc, Deosen Biochemical Ltd, C E Roeper GmbH.
3. What are the main segments of the Xanthan Gum Market?
The market segments include Form, Application.
4. Can you provide details about the market size?
The market size is estimated to be USD 754.80 Million as of 2022.
5. What are some drivers contributing to market growth?
Wide Applications and Functionality; Demand For Gluten-Free Products.
6. What are the notable trends driving market growth?
Food and Beverage Industry is the Biggest Consumer of Xanthan Gum.
7. Are there any restraints impacting market growth?
Easy Availability of Economically Feasible Alternatives.
8. Can you provide examples of recent developments in the market?
November 2023: Mitsubishi Corporation Life Sciences Limited expanded its food ingredient product capacity at the Saiki Factory of its subsidiary Kohjin Life Sciences Ltd. The company expanded the production capacity for its main products by approximately 1,000 metric tons annually.
9. What pricing options are available for accessing the report?
Pricing options include single-user, multi-user, and enterprise licenses priced at USD 4750, USD 5250, and USD 8750 respectively.
10. Is the market size provided in terms of value or volume?
The market size is provided in terms of value, measured in Million.
11. Are there any specific market keywords associated with the report?
Yes, the market keyword associated with the report is "Xanthan Gum Market," which aids in identifying and referencing the specific market segment covered.
12. How do I determine which pricing option suits my needs best?
The pricing options vary based on user requirements and access needs. Individual users may opt for single-user licenses, while businesses requiring broader access may choose multi-user or enterprise licenses for cost-effective access to the report.
13. Are there any additional resources or data provided in the Xanthan Gum Market report?
While the report offers comprehensive insights, it's advisable to review the specific contents or supplementary materials provided to ascertain if additional resources or data are available.
14. How can I stay updated on further developments or reports in the Xanthan Gum Market?
To stay informed about further developments, trends, and reports in the Xanthan Gum Market, consider subscribing to industry newsletters, following relevant companies and organizations, or regularly checking reputable industry news sources and publications.
Methodology
Step 1 - Identification of Relevant Samples Size from Population Database


Step 2 - Approaches for Defining Global Market Size (Value, Volume* & Price*)

Note*: In applicable scenarios
Step 3 - Data Sources
Primary Research
- Web Analytics
- Survey Reports
- Research Institute
- Latest Research Reports
- Opinion Leaders
Secondary Research
- Annual Reports
- White Paper
- Latest Press Release
- Industry Association
- Paid Database
- Investor Presentations

Step 4 - Data Triangulation
Involves using different sources of information in order to increase the validity of a study
These sources are likely to be stakeholders in a program - participants, other researchers, program staff, other community members, and so on.
Then we put all data in single framework & apply various statistical tools to find out the dynamic on the market.
During the analysis stage, feedback from the stakeholder groups would be compared to determine areas of agreement as well as areas of divergence


