
Key Insights
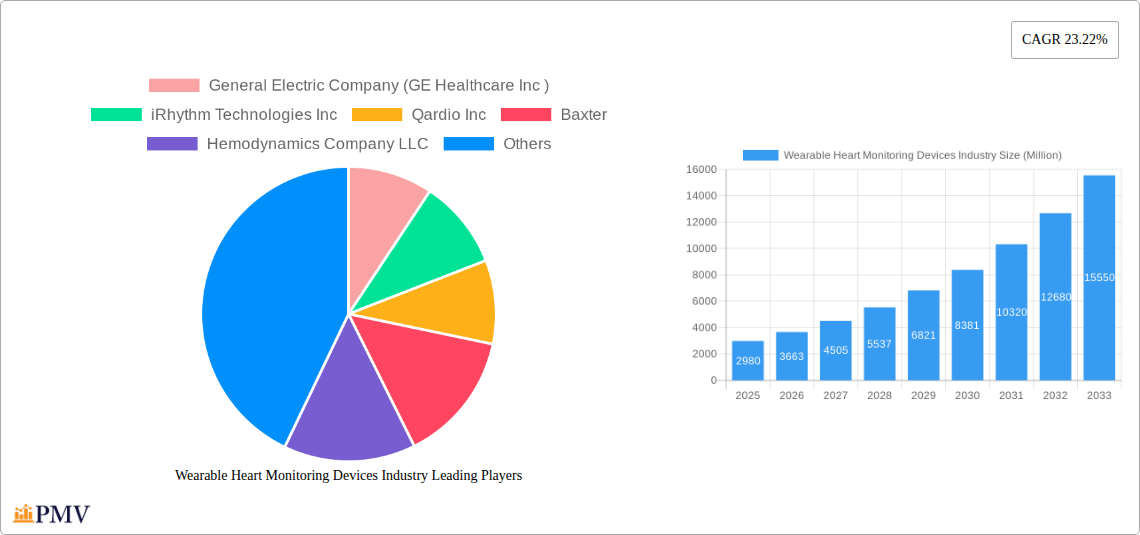
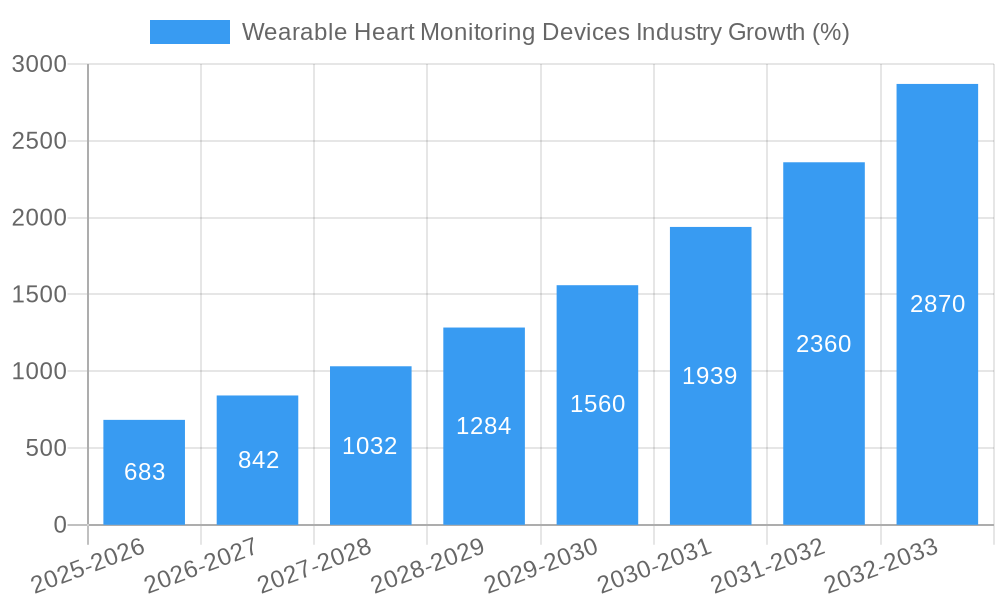
The global wearable heart monitoring devices market is experiencing robust growth, projected to reach a substantial size, driven by several key factors. The market's Compound Annual Growth Rate (CAGR) of 23.22% from 2019 to 2024 indicates significant expansion, fueled by increasing prevalence of cardiovascular diseases, rising geriatric population requiring remote health monitoring, and technological advancements leading to smaller, more accurate, and user-friendly devices. The increasing adoption of telehealth and remote patient monitoring (RPM) programs, particularly post-pandemic, significantly boosts market demand. The integration of sophisticated sensors and AI-powered analytics enables early detection of cardiac events, facilitating timely interventions and improved patient outcomes. Further growth is anticipated from the rising consumer awareness about heart health and the increasing availability of affordable wearable devices. Market segmentation reveals strong growth across product types, notably electric pulse-based and optical technology-based devices. Diagnostic and monitoring devices comprise a larger segment compared to therapeutic devices. Applications in sports and fitness, along with home healthcare and remote patient monitoring, are key drivers, reflecting the broader shift towards proactive healthcare management.
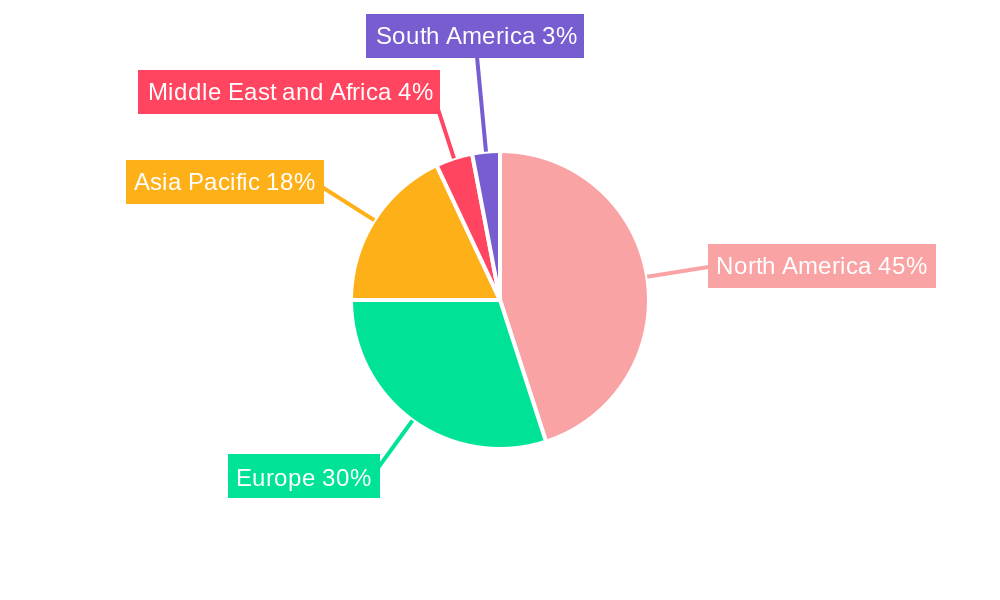
Competition in the market is intense, with established players like General Electric (GE Healthcare), Medtronic, and Philips competing with emerging companies focused on innovation and specialized technologies. Geographic distribution shows North America and Europe currently holding significant market shares, but the Asia-Pacific region is expected to witness accelerated growth due to increasing healthcare spending and rising adoption of advanced medical technologies. The market's future trajectory will depend on factors such as regulatory approvals for new devices, advancements in data analytics capabilities, and the continuing integration of wearable heart monitors into broader healthcare ecosystems. Successful players will need to focus on delivering cost-effective, user-friendly, and highly accurate devices alongside strong data security and privacy measures. Further expansion is anticipated through strategic partnerships and collaborations across healthcare providers, technology companies, and insurance providers.
Wearable Heart Monitoring Devices Industry: A Comprehensive Market Report (2019-2033)
This comprehensive report provides a detailed analysis of the Wearable Heart Monitoring Devices industry, offering invaluable insights into market dynamics, competitive landscapes, and future growth prospects. Covering the period from 2019 to 2033, with a focus on 2025, this report is an essential resource for industry stakeholders, investors, and researchers seeking a deep understanding of this rapidly evolving sector. The report includes detailed segmentation by product type, device type, and application, along with in-depth profiles of key players. The total market size is projected to reach xx Million by 2033.
Wearable Heart Monitoring Devices Industry Market Structure & Competitive Dynamics
The Wearable Heart Monitoring Devices market is characterized by a moderately concentrated structure, with several key players holding significant market share. The competitive landscape is dynamic, driven by continuous innovation, strategic mergers and acquisitions (M&A), and evolving regulatory frameworks. Market concentration is approximately xx%, with the top five players accounting for approximately xx% of the total market revenue in 2024. Innovation ecosystems are robust, with significant investment in R&D across both established players and emerging startups. Regulatory frameworks vary across geographies, influencing product approvals and market access. Product substitution is a potential threat, with advancements in alternative technologies impacting market share dynamics.
End-user trends, particularly the increasing adoption of remote patient monitoring and home healthcare solutions, are key market drivers. The M&A landscape is active, with several significant deals concluded in recent years. For instance, the combined market value of completed M&A deals in the sector totaled approximately xx Million in 2024. These activities reflect the increasing consolidation within the industry and the pursuit of expansion into new markets and technologies.
- Market Share: Top 5 players hold approximately xx% of the market share.
- M&A Activity: Significant deals totaling xx Million in 2024.
- Regulatory Landscape: Varying regulations across different geographies impacting market access.
- Innovation Ecosystem: Robust R&D investment fuels continuous technological advancements.
Wearable Heart Monitoring Devices Industry Industry Trends & Insights
The Wearable Heart Monitoring Devices market is experiencing robust growth, driven by several key factors. The rising prevalence of cardiovascular diseases globally fuels demand for effective monitoring solutions. Technological advancements, such as miniaturization, improved sensor technology, and enhanced data analytics capabilities, are transforming the industry. Consumer preferences are shifting towards convenient, user-friendly devices that offer real-time data and insights. The market is also witnessing increased adoption of remote patient monitoring (RPM) programs, enhancing healthcare accessibility and efficiency.
The market is exhibiting a Compound Annual Growth Rate (CAGR) of xx% during the forecast period (2025-2033), with significant growth potential in emerging markets. Market penetration remains relatively low in certain regions, presenting substantial untapped opportunities. Competitive dynamics are intensifying, with companies focusing on product differentiation, strategic partnerships, and innovative business models to gain a competitive edge. The increasing integration of wearable heart monitoring devices with other healthcare technologies, such as telehealth platforms, is further accelerating market growth. The market penetration rate is currently estimated at xx% and is projected to reach xx% by 2033.
Dominant Markets & Segments in Wearable Heart Monitoring Devices Industry
The North American region currently dominates the global Wearable Heart Monitoring Devices market, driven by factors such as high healthcare expenditure, advanced healthcare infrastructure, and early adoption of innovative technologies. Within product segments, the Electric Pulse-based Product segment holds the largest market share due to its established technology and widespread availability.
Key Drivers by Segment:
- North America: High healthcare expenditure, advanced infrastructure, early adoption of new technologies.
- Electric Pulse-based Products: Established technology, widespread availability, cost-effectiveness.
- Diagnostic & Monitoring Devices: Growing demand for early disease detection and improved patient care.
- Remote Patient Monitoring Applications: Increasing adoption of telehealth and RPM programs.
Dominance Analysis:
The dominance of North America is primarily attributed to its robust healthcare infrastructure, high disposable income levels, and favorable regulatory environment. The high prevalence of cardiovascular diseases in this region further fuels the demand for wearable heart monitoring solutions. The electric pulse-based product segment benefits from its mature technology and lower production costs compared to optical technology-based products, making it more widely accessible. The diagnostic and monitoring device segment dominates due to the increasing focus on preventive healthcare and early disease detection. Finally, remote patient monitoring applications are experiencing rapid growth as the healthcare industry shifts towards value-based care and improved patient outcomes.
Wearable Heart Monitoring Devices Industry Product Innovations
Recent product developments focus on enhancing accuracy, miniaturization, and user-friendliness. Advanced algorithms and AI-powered analytics are being integrated to improve data interpretation and provide personalized insights. The integration of multiple sensors into a single device for comprehensive health monitoring is also gaining traction. These innovations cater to the growing demand for convenient, accurate, and data-rich wearable heart monitoring solutions, improving market fit and expanding the addressable market.
Report Segmentation & Scope
This report segments the Wearable Heart Monitoring Devices market across various parameters:
By Product: Electric Pulse-based Product (xx Million in 2025, xx% CAGR), Optical Technology-based Product (xx Million in 2025, xx% CAGR). The electric pulse-based segment is currently larger but optical technology is projected for faster growth.
By Device Type: Diagnostic & Monitoring Devices (xx Million in 2025, xx% CAGR), Therapeutic Devices (xx Million in 2025, xx% CAGR). Diagnostic and monitoring devices currently hold a larger share of the market.
By Application: Sports & Fitness (xx Million in 2025, xx% CAGR), Remote Patient Monitoring (xx Million in 2025, xx% CAGR), Home Healthcare (xx Million in 2025, xx% CAGR). Remote patient monitoring is experiencing the fastest growth.
Key Drivers of Wearable Heart Monitoring Devices Industry Growth
Several factors contribute to the industry's growth: the increasing prevalence of cardiovascular diseases, technological advancements leading to smaller, more accurate devices, rising adoption of remote patient monitoring, and supportive government initiatives promoting telehealth and preventative healthcare. The decreasing cost of sensors and data processing also plays a significant role.
Challenges in the Wearable Heart Monitoring Devices Industry Sector
The Wearable Heart Monitoring Devices industry faces challenges such as stringent regulatory approvals, the need for robust data security measures to protect sensitive patient information, and the potential for data inaccuracy impacting diagnosis and treatment. Competition from established players and new entrants also presents a significant challenge. These challenges could potentially reduce market growth by approximately xx% by 2033 if not adequately addressed.
Leading Players in the Wearable Heart Monitoring Devices Industry Market
- General Electric Company (GE Healthcare Inc)
- iRhythm Technologies Inc
- Qardio Inc
- Baxter
- Hemodynamics Company LLC
- ACS Diagnostics Inc
- Koninklijke Philips N V (BioTelemetry Inc)
- Boston Scientific (Preventice Solutions Inc)
- Heartbit Holdings Plc
- Medtronic plc
- Vital Connect Inc
- Asahi Kasei Corporation (ZOLL Medical Corporation)
Key Developments in Wearable Heart Monitoring Devices Industry Sector
- December 2022: Researchers at the University of Missouri College of Engineering designed a breathable, antimicrobial heart health wearable (USD 2.6 Million NIH grant). This development signifies advancements in material science and expands the potential applications of wearable technology.
- March 2022: Amrita University, India, launched Amrita Spandanam, a home-use wearable device measuring six vital parameters. This signifies the increasing accessibility of affordable health monitoring solutions in emerging markets.
Strategic Wearable Heart Monitoring Devices Industry Market Outlook
The future of the Wearable Heart Monitoring Devices market is bright, with significant growth potential driven by technological advancements, increasing healthcare expenditure, and the growing adoption of remote patient monitoring. Strategic opportunities exist in developing innovative products with enhanced accuracy, user-friendliness, and data analytics capabilities, expanding into underserved markets, and forging strategic partnerships to enhance market penetration. The market is poised for continued expansion, offering significant opportunities for both established players and new entrants.
Wearable Heart Monitoring Devices Industry Segmentation
-
1. Product
- 1.1. Electric Pulse-based Product
- 1.2. Optical Technology-based Product
-
2. Device Type
- 2.1. Diagnostic & Monitoring Devices
- 2.2. Therapeutic Devices
-
3. Application
- 3.1. Sports & Fitness
- 3.2. Remote Patient Monitoring
- 3.3. Home Healthcare
Wearable Heart Monitoring Devices Industry Segmentation By Geography
-
1. North America
- 1.1. United States
- 1.2. Canada
- 1.3. Mexico
-
2. Europe
- 2.1. Germany
- 2.2. United Kingdom
- 2.3. France
- 2.4. Italy
- 2.5. Spain
- 2.6. Rest of Europe
-
3. Asia Pacific
- 3.1. China
- 3.2. Japan
- 3.3. India
- 3.4. Australia
- 3.5. South Korea
- 3.6. Rest of Asia Pacific
-
4. Middle East and Africa
- 4.1. GCC
- 4.2. South Africa
- 4.3. Rest of Middle East and Africa
-
5. South America
- 5.1. Brazil
- 5.2. Argentina
- 5.3. Rest of South America
Wearable Heart Monitoring Devices Industry REPORT HIGHLIGHTS
| Aspects | Details |
|---|---|
| Study Period | 2019-2033 |
| Base Year | 2024 |
| Estimated Year | 2025 |
| Forecast Period | 2025-2033 |
| Historical Period | 2019-2024 |
| Growth Rate | CAGR of 23.22% from 2019-2033 |
| Segmentation |
|
Table of Contents
- 1. Introduction
- 1.1. Research Scope
- 1.2. Market Segmentation
- 1.3. Research Methodology
- 1.4. Definitions and Assumptions
- 2. Executive Summary
- 2.1. Introduction
- 3. Market Dynamics
- 3.1. Introduction
- 3.2. Market Drivers
- 3.2.1. Increasing Rate of Heart Failure; Rising Awareness of Wearables-based Cardiac Monitoring; Technological advancements in Wearable Devices
- 3.3. Market Restrains
- 3.3.1. Privacy and Security Issue of Wearable Devices; Stringent Rules & Regulatory Policy
- 3.4. Market Trends
- 3.4.1. The Optical Technology-based Product is Projected to Have a Notable Growth Rate in the Wearable Heart Monitoring Devices Market Over the Forecast Period
- 4. Market Factor Analysis
- 4.1. Porters Five Forces
- 4.2. Supply/Value Chain
- 4.3. PESTEL analysis
- 4.4. Market Entropy
- 4.5. Patent/Trademark Analysis
- 5. Global Wearable Heart Monitoring Devices Industry Analysis, Insights and Forecast, 2019-2031
- 5.1. Market Analysis, Insights and Forecast - by Product
- 5.1.1. Electric Pulse-based Product
- 5.1.2. Optical Technology-based Product
- 5.2. Market Analysis, Insights and Forecast - by Device Type
- 5.2.1. Diagnostic & Monitoring Devices
- 5.2.2. Therapeutic Devices
- 5.3. Market Analysis, Insights and Forecast - by Application
- 5.3.1. Sports & Fitness
- 5.3.2. Remote Patient Monitoring
- 5.3.3. Home Healthcare
- 5.4. Market Analysis, Insights and Forecast - by Region
- 5.4.1. North America
- 5.4.2. Europe
- 5.4.3. Asia Pacific
- 5.4.4. Middle East and Africa
- 5.4.5. South America
- 5.1. Market Analysis, Insights and Forecast - by Product
- 6. North America Wearable Heart Monitoring Devices Industry Analysis, Insights and Forecast, 2019-2031
- 6.1. Market Analysis, Insights and Forecast - by Product
- 6.1.1. Electric Pulse-based Product
- 6.1.2. Optical Technology-based Product
- 6.2. Market Analysis, Insights and Forecast - by Device Type
- 6.2.1. Diagnostic & Monitoring Devices
- 6.2.2. Therapeutic Devices
- 6.3. Market Analysis, Insights and Forecast - by Application
- 6.3.1. Sports & Fitness
- 6.3.2. Remote Patient Monitoring
- 6.3.3. Home Healthcare
- 6.1. Market Analysis, Insights and Forecast - by Product
- 7. Europe Wearable Heart Monitoring Devices Industry Analysis, Insights and Forecast, 2019-2031
- 7.1. Market Analysis, Insights and Forecast - by Product
- 7.1.1. Electric Pulse-based Product
- 7.1.2. Optical Technology-based Product
- 7.2. Market Analysis, Insights and Forecast - by Device Type
- 7.2.1. Diagnostic & Monitoring Devices
- 7.2.2. Therapeutic Devices
- 7.3. Market Analysis, Insights and Forecast - by Application
- 7.3.1. Sports & Fitness
- 7.3.2. Remote Patient Monitoring
- 7.3.3. Home Healthcare
- 7.1. Market Analysis, Insights and Forecast - by Product
- 8. Asia Pacific Wearable Heart Monitoring Devices Industry Analysis, Insights and Forecast, 2019-2031
- 8.1. Market Analysis, Insights and Forecast - by Product
- 8.1.1. Electric Pulse-based Product
- 8.1.2. Optical Technology-based Product
- 8.2. Market Analysis, Insights and Forecast - by Device Type
- 8.2.1. Diagnostic & Monitoring Devices
- 8.2.2. Therapeutic Devices
- 8.3. Market Analysis, Insights and Forecast - by Application
- 8.3.1. Sports & Fitness
- 8.3.2. Remote Patient Monitoring
- 8.3.3. Home Healthcare
- 8.1. Market Analysis, Insights and Forecast - by Product
- 9. Middle East and Africa Wearable Heart Monitoring Devices Industry Analysis, Insights and Forecast, 2019-2031
- 9.1. Market Analysis, Insights and Forecast - by Product
- 9.1.1. Electric Pulse-based Product
- 9.1.2. Optical Technology-based Product
- 9.2. Market Analysis, Insights and Forecast - by Device Type
- 9.2.1. Diagnostic & Monitoring Devices
- 9.2.2. Therapeutic Devices
- 9.3. Market Analysis, Insights and Forecast - by Application
- 9.3.1. Sports & Fitness
- 9.3.2. Remote Patient Monitoring
- 9.3.3. Home Healthcare
- 9.1. Market Analysis, Insights and Forecast - by Product
- 10. South America Wearable Heart Monitoring Devices Industry Analysis, Insights and Forecast, 2019-2031
- 10.1. Market Analysis, Insights and Forecast - by Product
- 10.1.1. Electric Pulse-based Product
- 10.1.2. Optical Technology-based Product
- 10.2. Market Analysis, Insights and Forecast - by Device Type
- 10.2.1. Diagnostic & Monitoring Devices
- 10.2.2. Therapeutic Devices
- 10.3. Market Analysis, Insights and Forecast - by Application
- 10.3.1. Sports & Fitness
- 10.3.2. Remote Patient Monitoring
- 10.3.3. Home Healthcare
- 10.1. Market Analysis, Insights and Forecast - by Product
- 11. North America Wearable Heart Monitoring Devices Industry Analysis, Insights and Forecast, 2019-2031
- 11.1. Market Analysis, Insights and Forecast - By Country/Sub-region
- 11.1.1 United States
- 11.1.2 Canada
- 11.1.3 Mexico
- 12. Europe Wearable Heart Monitoring Devices Industry Analysis, Insights and Forecast, 2019-2031
- 12.1. Market Analysis, Insights and Forecast - By Country/Sub-region
- 12.1.1 Germany
- 12.1.2 United Kingdom
- 12.1.3 France
- 12.1.4 Italy
- 12.1.5 Spain
- 12.1.6 Rest of Europe
- 13. Asia Pacific Wearable Heart Monitoring Devices Industry Analysis, Insights and Forecast, 2019-2031
- 13.1. Market Analysis, Insights and Forecast - By Country/Sub-region
- 13.1.1 China
- 13.1.2 Japan
- 13.1.3 India
- 13.1.4 Australia
- 13.1.5 South Korea
- 13.1.6 Rest of Asia Pacific
- 14. Middle East and Africa Wearable Heart Monitoring Devices Industry Analysis, Insights and Forecast, 2019-2031
- 14.1. Market Analysis, Insights and Forecast - By Country/Sub-region
- 14.1.1 GCC
- 14.1.2 South Africa
- 14.1.3 Rest of Middle East and Africa
- 15. South America Wearable Heart Monitoring Devices Industry Analysis, Insights and Forecast, 2019-2031
- 15.1. Market Analysis, Insights and Forecast - By Country/Sub-region
- 15.1.1 Brazil
- 15.1.2 Argentina
- 15.1.3 Rest of South America
- 16. Competitive Analysis
- 16.1. Global Market Share Analysis 2024
- 16.2. Company Profiles
- 16.2.1 General Electric Company (GE Healthcare Inc )
- 16.2.1.1. Overview
- 16.2.1.2. Products
- 16.2.1.3. SWOT Analysis
- 16.2.1.4. Recent Developments
- 16.2.1.5. Financials (Based on Availability)
- 16.2.2 iRhythm Technologies Inc
- 16.2.2.1. Overview
- 16.2.2.2. Products
- 16.2.2.3. SWOT Analysis
- 16.2.2.4. Recent Developments
- 16.2.2.5. Financials (Based on Availability)
- 16.2.3 Qardio Inc
- 16.2.3.1. Overview
- 16.2.3.2. Products
- 16.2.3.3. SWOT Analysis
- 16.2.3.4. Recent Developments
- 16.2.3.5. Financials (Based on Availability)
- 16.2.4 Baxter
- 16.2.4.1. Overview
- 16.2.4.2. Products
- 16.2.4.3. SWOT Analysis
- 16.2.4.4. Recent Developments
- 16.2.4.5. Financials (Based on Availability)
- 16.2.5 Hemodynamics Company LLC
- 16.2.5.1. Overview
- 16.2.5.2. Products
- 16.2.5.3. SWOT Analysis
- 16.2.5.4. Recent Developments
- 16.2.5.5. Financials (Based on Availability)
- 16.2.6 ACS Diagnostics Inc
- 16.2.6.1. Overview
- 16.2.6.2. Products
- 16.2.6.3. SWOT Analysis
- 16.2.6.4. Recent Developments
- 16.2.6.5. Financials (Based on Availability)
- 16.2.7 Koninklijke Philips N V (BioTelemetry Inc )
- 16.2.7.1. Overview
- 16.2.7.2. Products
- 16.2.7.3. SWOT Analysis
- 16.2.7.4. Recent Developments
- 16.2.7.5. Financials (Based on Availability)
- 16.2.8 Boston Scientific (Preventice Solutions Inc )
- 16.2.8.1. Overview
- 16.2.8.2. Products
- 16.2.8.3. SWOT Analysis
- 16.2.8.4. Recent Developments
- 16.2.8.5. Financials (Based on Availability)
- 16.2.9 Heartbit Holdings Plc
- 16.2.9.1. Overview
- 16.2.9.2. Products
- 16.2.9.3. SWOT Analysis
- 16.2.9.4. Recent Developments
- 16.2.9.5. Financials (Based on Availability)
- 16.2.10 Medtronic plc
- 16.2.10.1. Overview
- 16.2.10.2. Products
- 16.2.10.3. SWOT Analysis
- 16.2.10.4. Recent Developments
- 16.2.10.5. Financials (Based on Availability)
- 16.2.11 Vital Connect Inc
- 16.2.11.1. Overview
- 16.2.11.2. Products
- 16.2.11.3. SWOT Analysis
- 16.2.11.4. Recent Developments
- 16.2.11.5. Financials (Based on Availability)
- 16.2.12 Asahi Kasei Corporation (ZOLL Medical Corporation)
- 16.2.12.1. Overview
- 16.2.12.2. Products
- 16.2.12.3. SWOT Analysis
- 16.2.12.4. Recent Developments
- 16.2.12.5. Financials (Based on Availability)
- 16.2.1 General Electric Company (GE Healthcare Inc )
List of Figures
- Figure 1: Global Wearable Heart Monitoring Devices Industry Revenue Breakdown (Million, %) by Region 2024 & 2032
- Figure 2: Global Wearable Heart Monitoring Devices Industry Volume Breakdown (K Unit, %) by Region 2024 & 2032
- Figure 3: North America Wearable Heart Monitoring Devices Industry Revenue (Million), by Country 2024 & 2032
- Figure 4: North America Wearable Heart Monitoring Devices Industry Volume (K Unit), by Country 2024 & 2032
- Figure 5: North America Wearable Heart Monitoring Devices Industry Revenue Share (%), by Country 2024 & 2032
- Figure 6: North America Wearable Heart Monitoring Devices Industry Volume Share (%), by Country 2024 & 2032
- Figure 7: Europe Wearable Heart Monitoring Devices Industry Revenue (Million), by Country 2024 & 2032
- Figure 8: Europe Wearable Heart Monitoring Devices Industry Volume (K Unit), by Country 2024 & 2032
- Figure 9: Europe Wearable Heart Monitoring Devices Industry Revenue Share (%), by Country 2024 & 2032
- Figure 10: Europe Wearable Heart Monitoring Devices Industry Volume Share (%), by Country 2024 & 2032
- Figure 11: Asia Pacific Wearable Heart Monitoring Devices Industry Revenue (Million), by Country 2024 & 2032
- Figure 12: Asia Pacific Wearable Heart Monitoring Devices Industry Volume (K Unit), by Country 2024 & 2032
- Figure 13: Asia Pacific Wearable Heart Monitoring Devices Industry Revenue Share (%), by Country 2024 & 2032
- Figure 14: Asia Pacific Wearable Heart Monitoring Devices Industry Volume Share (%), by Country 2024 & 2032
- Figure 15: Middle East and Africa Wearable Heart Monitoring Devices Industry Revenue (Million), by Country 2024 & 2032
- Figure 16: Middle East and Africa Wearable Heart Monitoring Devices Industry Volume (K Unit), by Country 2024 & 2032
- Figure 17: Middle East and Africa Wearable Heart Monitoring Devices Industry Revenue Share (%), by Country 2024 & 2032
- Figure 18: Middle East and Africa Wearable Heart Monitoring Devices Industry Volume Share (%), by Country 2024 & 2032
- Figure 19: South America Wearable Heart Monitoring Devices Industry Revenue (Million), by Country 2024 & 2032
- Figure 20: South America Wearable Heart Monitoring Devices Industry Volume (K Unit), by Country 2024 & 2032
- Figure 21: South America Wearable Heart Monitoring Devices Industry Revenue Share (%), by Country 2024 & 2032
- Figure 22: South America Wearable Heart Monitoring Devices Industry Volume Share (%), by Country 2024 & 2032
- Figure 23: North America Wearable Heart Monitoring Devices Industry Revenue (Million), by Product 2024 & 2032
- Figure 24: North America Wearable Heart Monitoring Devices Industry Volume (K Unit), by Product 2024 & 2032
- Figure 25: North America Wearable Heart Monitoring Devices Industry Revenue Share (%), by Product 2024 & 2032
- Figure 26: North America Wearable Heart Monitoring Devices Industry Volume Share (%), by Product 2024 & 2032
- Figure 27: North America Wearable Heart Monitoring Devices Industry Revenue (Million), by Device Type 2024 & 2032
- Figure 28: North America Wearable Heart Monitoring Devices Industry Volume (K Unit), by Device Type 2024 & 2032
- Figure 29: North America Wearable Heart Monitoring Devices Industry Revenue Share (%), by Device Type 2024 & 2032
- Figure 30: North America Wearable Heart Monitoring Devices Industry Volume Share (%), by Device Type 2024 & 2032
- Figure 31: North America Wearable Heart Monitoring Devices Industry Revenue (Million), by Application 2024 & 2032
- Figure 32: North America Wearable Heart Monitoring Devices Industry Volume (K Unit), by Application 2024 & 2032
- Figure 33: North America Wearable Heart Monitoring Devices Industry Revenue Share (%), by Application 2024 & 2032
- Figure 34: North America Wearable Heart Monitoring Devices Industry Volume Share (%), by Application 2024 & 2032
- Figure 35: North America Wearable Heart Monitoring Devices Industry Revenue (Million), by Country 2024 & 2032
- Figure 36: North America Wearable Heart Monitoring Devices Industry Volume (K Unit), by Country 2024 & 2032
- Figure 37: North America Wearable Heart Monitoring Devices Industry Revenue Share (%), by Country 2024 & 2032
- Figure 38: North America Wearable Heart Monitoring Devices Industry Volume Share (%), by Country 2024 & 2032
- Figure 39: Europe Wearable Heart Monitoring Devices Industry Revenue (Million), by Product 2024 & 2032
- Figure 40: Europe Wearable Heart Monitoring Devices Industry Volume (K Unit), by Product 2024 & 2032
- Figure 41: Europe Wearable Heart Monitoring Devices Industry Revenue Share (%), by Product 2024 & 2032
- Figure 42: Europe Wearable Heart Monitoring Devices Industry Volume Share (%), by Product 2024 & 2032
- Figure 43: Europe Wearable Heart Monitoring Devices Industry Revenue (Million), by Device Type 2024 & 2032
- Figure 44: Europe Wearable Heart Monitoring Devices Industry Volume (K Unit), by Device Type 2024 & 2032
- Figure 45: Europe Wearable Heart Monitoring Devices Industry Revenue Share (%), by Device Type 2024 & 2032
- Figure 46: Europe Wearable Heart Monitoring Devices Industry Volume Share (%), by Device Type 2024 & 2032
- Figure 47: Europe Wearable Heart Monitoring Devices Industry Revenue (Million), by Application 2024 & 2032
- Figure 48: Europe Wearable Heart Monitoring Devices Industry Volume (K Unit), by Application 2024 & 2032
- Figure 49: Europe Wearable Heart Monitoring Devices Industry Revenue Share (%), by Application 2024 & 2032
- Figure 50: Europe Wearable Heart Monitoring Devices Industry Volume Share (%), by Application 2024 & 2032
- Figure 51: Europe Wearable Heart Monitoring Devices Industry Revenue (Million), by Country 2024 & 2032
- Figure 52: Europe Wearable Heart Monitoring Devices Industry Volume (K Unit), by Country 2024 & 2032
- Figure 53: Europe Wearable Heart Monitoring Devices Industry Revenue Share (%), by Country 2024 & 2032
- Figure 54: Europe Wearable Heart Monitoring Devices Industry Volume Share (%), by Country 2024 & 2032
- Figure 55: Asia Pacific Wearable Heart Monitoring Devices Industry Revenue (Million), by Product 2024 & 2032
- Figure 56: Asia Pacific Wearable Heart Monitoring Devices Industry Volume (K Unit), by Product 2024 & 2032
- Figure 57: Asia Pacific Wearable Heart Monitoring Devices Industry Revenue Share (%), by Product 2024 & 2032
- Figure 58: Asia Pacific Wearable Heart Monitoring Devices Industry Volume Share (%), by Product 2024 & 2032
- Figure 59: Asia Pacific Wearable Heart Monitoring Devices Industry Revenue (Million), by Device Type 2024 & 2032
- Figure 60: Asia Pacific Wearable Heart Monitoring Devices Industry Volume (K Unit), by Device Type 2024 & 2032
- Figure 61: Asia Pacific Wearable Heart Monitoring Devices Industry Revenue Share (%), by Device Type 2024 & 2032
- Figure 62: Asia Pacific Wearable Heart Monitoring Devices Industry Volume Share (%), by Device Type 2024 & 2032
- Figure 63: Asia Pacific Wearable Heart Monitoring Devices Industry Revenue (Million), by Application 2024 & 2032
- Figure 64: Asia Pacific Wearable Heart Monitoring Devices Industry Volume (K Unit), by Application 2024 & 2032
- Figure 65: Asia Pacific Wearable Heart Monitoring Devices Industry Revenue Share (%), by Application 2024 & 2032
- Figure 66: Asia Pacific Wearable Heart Monitoring Devices Industry Volume Share (%), by Application 2024 & 2032
- Figure 67: Asia Pacific Wearable Heart Monitoring Devices Industry Revenue (Million), by Country 2024 & 2032
- Figure 68: Asia Pacific Wearable Heart Monitoring Devices Industry Volume (K Unit), by Country 2024 & 2032
- Figure 69: Asia Pacific Wearable Heart Monitoring Devices Industry Revenue Share (%), by Country 2024 & 2032
- Figure 70: Asia Pacific Wearable Heart Monitoring Devices Industry Volume Share (%), by Country 2024 & 2032
- Figure 71: Middle East and Africa Wearable Heart Monitoring Devices Industry Revenue (Million), by Product 2024 & 2032
- Figure 72: Middle East and Africa Wearable Heart Monitoring Devices Industry Volume (K Unit), by Product 2024 & 2032
- Figure 73: Middle East and Africa Wearable Heart Monitoring Devices Industry Revenue Share (%), by Product 2024 & 2032
- Figure 74: Middle East and Africa Wearable Heart Monitoring Devices Industry Volume Share (%), by Product 2024 & 2032
- Figure 75: Middle East and Africa Wearable Heart Monitoring Devices Industry Revenue (Million), by Device Type 2024 & 2032
- Figure 76: Middle East and Africa Wearable Heart Monitoring Devices Industry Volume (K Unit), by Device Type 2024 & 2032
- Figure 77: Middle East and Africa Wearable Heart Monitoring Devices Industry Revenue Share (%), by Device Type 2024 & 2032
- Figure 78: Middle East and Africa Wearable Heart Monitoring Devices Industry Volume Share (%), by Device Type 2024 & 2032
- Figure 79: Middle East and Africa Wearable Heart Monitoring Devices Industry Revenue (Million), by Application 2024 & 2032
- Figure 80: Middle East and Africa Wearable Heart Monitoring Devices Industry Volume (K Unit), by Application 2024 & 2032
- Figure 81: Middle East and Africa Wearable Heart Monitoring Devices Industry Revenue Share (%), by Application 2024 & 2032
- Figure 82: Middle East and Africa Wearable Heart Monitoring Devices Industry Volume Share (%), by Application 2024 & 2032
- Figure 83: Middle East and Africa Wearable Heart Monitoring Devices Industry Revenue (Million), by Country 2024 & 2032
- Figure 84: Middle East and Africa Wearable Heart Monitoring Devices Industry Volume (K Unit), by Country 2024 & 2032
- Figure 85: Middle East and Africa Wearable Heart Monitoring Devices Industry Revenue Share (%), by Country 2024 & 2032
- Figure 86: Middle East and Africa Wearable Heart Monitoring Devices Industry Volume Share (%), by Country 2024 & 2032
- Figure 87: South America Wearable Heart Monitoring Devices Industry Revenue (Million), by Product 2024 & 2032
- Figure 88: South America Wearable Heart Monitoring Devices Industry Volume (K Unit), by Product 2024 & 2032
- Figure 89: South America Wearable Heart Monitoring Devices Industry Revenue Share (%), by Product 2024 & 2032
- Figure 90: South America Wearable Heart Monitoring Devices Industry Volume Share (%), by Product 2024 & 2032
- Figure 91: South America Wearable Heart Monitoring Devices Industry Revenue (Million), by Device Type 2024 & 2032
- Figure 92: South America Wearable Heart Monitoring Devices Industry Volume (K Unit), by Device Type 2024 & 2032
- Figure 93: South America Wearable Heart Monitoring Devices Industry Revenue Share (%), by Device Type 2024 & 2032
- Figure 94: South America Wearable Heart Monitoring Devices Industry Volume Share (%), by Device Type 2024 & 2032
- Figure 95: South America Wearable Heart Monitoring Devices Industry Revenue (Million), by Application 2024 & 2032
- Figure 96: South America Wearable Heart Monitoring Devices Industry Volume (K Unit), by Application 2024 & 2032
- Figure 97: South America Wearable Heart Monitoring Devices Industry Revenue Share (%), by Application 2024 & 2032
- Figure 98: South America Wearable Heart Monitoring Devices Industry Volume Share (%), by Application 2024 & 2032
- Figure 99: South America Wearable Heart Monitoring Devices Industry Revenue (Million), by Country 2024 & 2032
- Figure 100: South America Wearable Heart Monitoring Devices Industry Volume (K Unit), by Country 2024 & 2032
- Figure 101: South America Wearable Heart Monitoring Devices Industry Revenue Share (%), by Country 2024 & 2032
- Figure 102: South America Wearable Heart Monitoring Devices Industry Volume Share (%), by Country 2024 & 2032
List of Tables
- Table 1: Global Wearable Heart Monitoring Devices Industry Revenue Million Forecast, by Region 2019 & 2032
- Table 2: Global Wearable Heart Monitoring Devices Industry Volume K Unit Forecast, by Region 2019 & 2032
- Table 3: Global Wearable Heart Monitoring Devices Industry Revenue Million Forecast, by Product 2019 & 2032
- Table 4: Global Wearable Heart Monitoring Devices Industry Volume K Unit Forecast, by Product 2019 & 2032
- Table 5: Global Wearable Heart Monitoring Devices Industry Revenue Million Forecast, by Device Type 2019 & 2032
- Table 6: Global Wearable Heart Monitoring Devices Industry Volume K Unit Forecast, by Device Type 2019 & 2032
- Table 7: Global Wearable Heart Monitoring Devices Industry Revenue Million Forecast, by Application 2019 & 2032
- Table 8: Global Wearable Heart Monitoring Devices Industry Volume K Unit Forecast, by Application 2019 & 2032
- Table 9: Global Wearable Heart Monitoring Devices Industry Revenue Million Forecast, by Region 2019 & 2032
- Table 10: Global Wearable Heart Monitoring Devices Industry Volume K Unit Forecast, by Region 2019 & 2032
- Table 11: Global Wearable Heart Monitoring Devices Industry Revenue Million Forecast, by Country 2019 & 2032
- Table 12: Global Wearable Heart Monitoring Devices Industry Volume K Unit Forecast, by Country 2019 & 2032
- Table 13: United States Wearable Heart Monitoring Devices Industry Revenue (Million) Forecast, by Application 2019 & 2032
- Table 14: United States Wearable Heart Monitoring Devices Industry Volume (K Unit) Forecast, by Application 2019 & 2032
- Table 15: Canada Wearable Heart Monitoring Devices Industry Revenue (Million) Forecast, by Application 2019 & 2032
- Table 16: Canada Wearable Heart Monitoring Devices Industry Volume (K Unit) Forecast, by Application 2019 & 2032
- Table 17: Mexico Wearable Heart Monitoring Devices Industry Revenue (Million) Forecast, by Application 2019 & 2032
- Table 18: Mexico Wearable Heart Monitoring Devices Industry Volume (K Unit) Forecast, by Application 2019 & 2032
- Table 19: Global Wearable Heart Monitoring Devices Industry Revenue Million Forecast, by Country 2019 & 2032
- Table 20: Global Wearable Heart Monitoring Devices Industry Volume K Unit Forecast, by Country 2019 & 2032
- Table 21: Germany Wearable Heart Monitoring Devices Industry Revenue (Million) Forecast, by Application 2019 & 2032
- Table 22: Germany Wearable Heart Monitoring Devices Industry Volume (K Unit) Forecast, by Application 2019 & 2032
- Table 23: United Kingdom Wearable Heart Monitoring Devices Industry Revenue (Million) Forecast, by Application 2019 & 2032
- Table 24: United Kingdom Wearable Heart Monitoring Devices Industry Volume (K Unit) Forecast, by Application 2019 & 2032
- Table 25: France Wearable Heart Monitoring Devices Industry Revenue (Million) Forecast, by Application 2019 & 2032
- Table 26: France Wearable Heart Monitoring Devices Industry Volume (K Unit) Forecast, by Application 2019 & 2032
- Table 27: Italy Wearable Heart Monitoring Devices Industry Revenue (Million) Forecast, by Application 2019 & 2032
- Table 28: Italy Wearable Heart Monitoring Devices Industry Volume (K Unit) Forecast, by Application 2019 & 2032
- Table 29: Spain Wearable Heart Monitoring Devices Industry Revenue (Million) Forecast, by Application 2019 & 2032
- Table 30: Spain Wearable Heart Monitoring Devices Industry Volume (K Unit) Forecast, by Application 2019 & 2032
- Table 31: Rest of Europe Wearable Heart Monitoring Devices Industry Revenue (Million) Forecast, by Application 2019 & 2032
- Table 32: Rest of Europe Wearable Heart Monitoring Devices Industry Volume (K Unit) Forecast, by Application 2019 & 2032
- Table 33: Global Wearable Heart Monitoring Devices Industry Revenue Million Forecast, by Country 2019 & 2032
- Table 34: Global Wearable Heart Monitoring Devices Industry Volume K Unit Forecast, by Country 2019 & 2032
- Table 35: China Wearable Heart Monitoring Devices Industry Revenue (Million) Forecast, by Application 2019 & 2032
- Table 36: China Wearable Heart Monitoring Devices Industry Volume (K Unit) Forecast, by Application 2019 & 2032
- Table 37: Japan Wearable Heart Monitoring Devices Industry Revenue (Million) Forecast, by Application 2019 & 2032
- Table 38: Japan Wearable Heart Monitoring Devices Industry Volume (K Unit) Forecast, by Application 2019 & 2032
- Table 39: India Wearable Heart Monitoring Devices Industry Revenue (Million) Forecast, by Application 2019 & 2032
- Table 40: India Wearable Heart Monitoring Devices Industry Volume (K Unit) Forecast, by Application 2019 & 2032
- Table 41: Australia Wearable Heart Monitoring Devices Industry Revenue (Million) Forecast, by Application 2019 & 2032
- Table 42: Australia Wearable Heart Monitoring Devices Industry Volume (K Unit) Forecast, by Application 2019 & 2032
- Table 43: South Korea Wearable Heart Monitoring Devices Industry Revenue (Million) Forecast, by Application 2019 & 2032
- Table 44: South Korea Wearable Heart Monitoring Devices Industry Volume (K Unit) Forecast, by Application 2019 & 2032
- Table 45: Rest of Asia Pacific Wearable Heart Monitoring Devices Industry Revenue (Million) Forecast, by Application 2019 & 2032
- Table 46: Rest of Asia Pacific Wearable Heart Monitoring Devices Industry Volume (K Unit) Forecast, by Application 2019 & 2032
- Table 47: Global Wearable Heart Monitoring Devices Industry Revenue Million Forecast, by Country 2019 & 2032
- Table 48: Global Wearable Heart Monitoring Devices Industry Volume K Unit Forecast, by Country 2019 & 2032
- Table 49: GCC Wearable Heart Monitoring Devices Industry Revenue (Million) Forecast, by Application 2019 & 2032
- Table 50: GCC Wearable Heart Monitoring Devices Industry Volume (K Unit) Forecast, by Application 2019 & 2032
- Table 51: South Africa Wearable Heart Monitoring Devices Industry Revenue (Million) Forecast, by Application 2019 & 2032
- Table 52: South Africa Wearable Heart Monitoring Devices Industry Volume (K Unit) Forecast, by Application 2019 & 2032
- Table 53: Rest of Middle East and Africa Wearable Heart Monitoring Devices Industry Revenue (Million) Forecast, by Application 2019 & 2032
- Table 54: Rest of Middle East and Africa Wearable Heart Monitoring Devices Industry Volume (K Unit) Forecast, by Application 2019 & 2032
- Table 55: Global Wearable Heart Monitoring Devices Industry Revenue Million Forecast, by Country 2019 & 2032
- Table 56: Global Wearable Heart Monitoring Devices Industry Volume K Unit Forecast, by Country 2019 & 2032
- Table 57: Brazil Wearable Heart Monitoring Devices Industry Revenue (Million) Forecast, by Application 2019 & 2032
- Table 58: Brazil Wearable Heart Monitoring Devices Industry Volume (K Unit) Forecast, by Application 2019 & 2032
- Table 59: Argentina Wearable Heart Monitoring Devices Industry Revenue (Million) Forecast, by Application 2019 & 2032
- Table 60: Argentina Wearable Heart Monitoring Devices Industry Volume (K Unit) Forecast, by Application 2019 & 2032
- Table 61: Rest of South America Wearable Heart Monitoring Devices Industry Revenue (Million) Forecast, by Application 2019 & 2032
- Table 62: Rest of South America Wearable Heart Monitoring Devices Industry Volume (K Unit) Forecast, by Application 2019 & 2032
- Table 63: Global Wearable Heart Monitoring Devices Industry Revenue Million Forecast, by Product 2019 & 2032
- Table 64: Global Wearable Heart Monitoring Devices Industry Volume K Unit Forecast, by Product 2019 & 2032
- Table 65: Global Wearable Heart Monitoring Devices Industry Revenue Million Forecast, by Device Type 2019 & 2032
- Table 66: Global Wearable Heart Monitoring Devices Industry Volume K Unit Forecast, by Device Type 2019 & 2032
- Table 67: Global Wearable Heart Monitoring Devices Industry Revenue Million Forecast, by Application 2019 & 2032
- Table 68: Global Wearable Heart Monitoring Devices Industry Volume K Unit Forecast, by Application 2019 & 2032
- Table 69: Global Wearable Heart Monitoring Devices Industry Revenue Million Forecast, by Country 2019 & 2032
- Table 70: Global Wearable Heart Monitoring Devices Industry Volume K Unit Forecast, by Country 2019 & 2032
- Table 71: United States Wearable Heart Monitoring Devices Industry Revenue (Million) Forecast, by Application 2019 & 2032
- Table 72: United States Wearable Heart Monitoring Devices Industry Volume (K Unit) Forecast, by Application 2019 & 2032
- Table 73: Canada Wearable Heart Monitoring Devices Industry Revenue (Million) Forecast, by Application 2019 & 2032
- Table 74: Canada Wearable Heart Monitoring Devices Industry Volume (K Unit) Forecast, by Application 2019 & 2032
- Table 75: Mexico Wearable Heart Monitoring Devices Industry Revenue (Million) Forecast, by Application 2019 & 2032
- Table 76: Mexico Wearable Heart Monitoring Devices Industry Volume (K Unit) Forecast, by Application 2019 & 2032
- Table 77: Global Wearable Heart Monitoring Devices Industry Revenue Million Forecast, by Product 2019 & 2032
- Table 78: Global Wearable Heart Monitoring Devices Industry Volume K Unit Forecast, by Product 2019 & 2032
- Table 79: Global Wearable Heart Monitoring Devices Industry Revenue Million Forecast, by Device Type 2019 & 2032
- Table 80: Global Wearable Heart Monitoring Devices Industry Volume K Unit Forecast, by Device Type 2019 & 2032
- Table 81: Global Wearable Heart Monitoring Devices Industry Revenue Million Forecast, by Application 2019 & 2032
- Table 82: Global Wearable Heart Monitoring Devices Industry Volume K Unit Forecast, by Application 2019 & 2032
- Table 83: Global Wearable Heart Monitoring Devices Industry Revenue Million Forecast, by Country 2019 & 2032
- Table 84: Global Wearable Heart Monitoring Devices Industry Volume K Unit Forecast, by Country 2019 & 2032
- Table 85: Germany Wearable Heart Monitoring Devices Industry Revenue (Million) Forecast, by Application 2019 & 2032
- Table 86: Germany Wearable Heart Monitoring Devices Industry Volume (K Unit) Forecast, by Application 2019 & 2032
- Table 87: United Kingdom Wearable Heart Monitoring Devices Industry Revenue (Million) Forecast, by Application 2019 & 2032
- Table 88: United Kingdom Wearable Heart Monitoring Devices Industry Volume (K Unit) Forecast, by Application 2019 & 2032
- Table 89: France Wearable Heart Monitoring Devices Industry Revenue (Million) Forecast, by Application 2019 & 2032
- Table 90: France Wearable Heart Monitoring Devices Industry Volume (K Unit) Forecast, by Application 2019 & 2032
- Table 91: Italy Wearable Heart Monitoring Devices Industry Revenue (Million) Forecast, by Application 2019 & 2032
- Table 92: Italy Wearable Heart Monitoring Devices Industry Volume (K Unit) Forecast, by Application 2019 & 2032
- Table 93: Spain Wearable Heart Monitoring Devices Industry Revenue (Million) Forecast, by Application 2019 & 2032
- Table 94: Spain Wearable Heart Monitoring Devices Industry Volume (K Unit) Forecast, by Application 2019 & 2032
- Table 95: Rest of Europe Wearable Heart Monitoring Devices Industry Revenue (Million) Forecast, by Application 2019 & 2032
- Table 96: Rest of Europe Wearable Heart Monitoring Devices Industry Volume (K Unit) Forecast, by Application 2019 & 2032
- Table 97: Global Wearable Heart Monitoring Devices Industry Revenue Million Forecast, by Product 2019 & 2032
- Table 98: Global Wearable Heart Monitoring Devices Industry Volume K Unit Forecast, by Product 2019 & 2032
- Table 99: Global Wearable Heart Monitoring Devices Industry Revenue Million Forecast, by Device Type 2019 & 2032
- Table 100: Global Wearable Heart Monitoring Devices Industry Volume K Unit Forecast, by Device Type 2019 & 2032
- Table 101: Global Wearable Heart Monitoring Devices Industry Revenue Million Forecast, by Application 2019 & 2032
- Table 102: Global Wearable Heart Monitoring Devices Industry Volume K Unit Forecast, by Application 2019 & 2032
- Table 103: Global Wearable Heart Monitoring Devices Industry Revenue Million Forecast, by Country 2019 & 2032
- Table 104: Global Wearable Heart Monitoring Devices Industry Volume K Unit Forecast, by Country 2019 & 2032
- Table 105: China Wearable Heart Monitoring Devices Industry Revenue (Million) Forecast, by Application 2019 & 2032
- Table 106: China Wearable Heart Monitoring Devices Industry Volume (K Unit) Forecast, by Application 2019 & 2032
- Table 107: Japan Wearable Heart Monitoring Devices Industry Revenue (Million) Forecast, by Application 2019 & 2032
- Table 108: Japan Wearable Heart Monitoring Devices Industry Volume (K Unit) Forecast, by Application 2019 & 2032
- Table 109: India Wearable Heart Monitoring Devices Industry Revenue (Million) Forecast, by Application 2019 & 2032
- Table 110: India Wearable Heart Monitoring Devices Industry Volume (K Unit) Forecast, by Application 2019 & 2032
- Table 111: Australia Wearable Heart Monitoring Devices Industry Revenue (Million) Forecast, by Application 2019 & 2032
- Table 112: Australia Wearable Heart Monitoring Devices Industry Volume (K Unit) Forecast, by Application 2019 & 2032
- Table 113: South Korea Wearable Heart Monitoring Devices Industry Revenue (Million) Forecast, by Application 2019 & 2032
- Table 114: South Korea Wearable Heart Monitoring Devices Industry Volume (K Unit) Forecast, by Application 2019 & 2032
- Table 115: Rest of Asia Pacific Wearable Heart Monitoring Devices Industry Revenue (Million) Forecast, by Application 2019 & 2032
- Table 116: Rest of Asia Pacific Wearable Heart Monitoring Devices Industry Volume (K Unit) Forecast, by Application 2019 & 2032
- Table 117: Global Wearable Heart Monitoring Devices Industry Revenue Million Forecast, by Product 2019 & 2032
- Table 118: Global Wearable Heart Monitoring Devices Industry Volume K Unit Forecast, by Product 2019 & 2032
- Table 119: Global Wearable Heart Monitoring Devices Industry Revenue Million Forecast, by Device Type 2019 & 2032
- Table 120: Global Wearable Heart Monitoring Devices Industry Volume K Unit Forecast, by Device Type 2019 & 2032
- Table 121: Global Wearable Heart Monitoring Devices Industry Revenue Million Forecast, by Application 2019 & 2032
- Table 122: Global Wearable Heart Monitoring Devices Industry Volume K Unit Forecast, by Application 2019 & 2032
- Table 123: Global Wearable Heart Monitoring Devices Industry Revenue Million Forecast, by Country 2019 & 2032
- Table 124: Global Wearable Heart Monitoring Devices Industry Volume K Unit Forecast, by Country 2019 & 2032
- Table 125: GCC Wearable Heart Monitoring Devices Industry Revenue (Million) Forecast, by Application 2019 & 2032
- Table 126: GCC Wearable Heart Monitoring Devices Industry Volume (K Unit) Forecast, by Application 2019 & 2032
- Table 127: South Africa Wearable Heart Monitoring Devices Industry Revenue (Million) Forecast, by Application 2019 & 2032
- Table 128: South Africa Wearable Heart Monitoring Devices Industry Volume (K Unit) Forecast, by Application 2019 & 2032
- Table 129: Rest of Middle East and Africa Wearable Heart Monitoring Devices Industry Revenue (Million) Forecast, by Application 2019 & 2032
- Table 130: Rest of Middle East and Africa Wearable Heart Monitoring Devices Industry Volume (K Unit) Forecast, by Application 2019 & 2032
- Table 131: Global Wearable Heart Monitoring Devices Industry Revenue Million Forecast, by Product 2019 & 2032
- Table 132: Global Wearable Heart Monitoring Devices Industry Volume K Unit Forecast, by Product 2019 & 2032
- Table 133: Global Wearable Heart Monitoring Devices Industry Revenue Million Forecast, by Device Type 2019 & 2032
- Table 134: Global Wearable Heart Monitoring Devices Industry Volume K Unit Forecast, by Device Type 2019 & 2032
- Table 135: Global Wearable Heart Monitoring Devices Industry Revenue Million Forecast, by Application 2019 & 2032
- Table 136: Global Wearable Heart Monitoring Devices Industry Volume K Unit Forecast, by Application 2019 & 2032
- Table 137: Global Wearable Heart Monitoring Devices Industry Revenue Million Forecast, by Country 2019 & 2032
- Table 138: Global Wearable Heart Monitoring Devices Industry Volume K Unit Forecast, by Country 2019 & 2032
- Table 139: Brazil Wearable Heart Monitoring Devices Industry Revenue (Million) Forecast, by Application 2019 & 2032
- Table 140: Brazil Wearable Heart Monitoring Devices Industry Volume (K Unit) Forecast, by Application 2019 & 2032
- Table 141: Argentina Wearable Heart Monitoring Devices Industry Revenue (Million) Forecast, by Application 2019 & 2032
- Table 142: Argentina Wearable Heart Monitoring Devices Industry Volume (K Unit) Forecast, by Application 2019 & 2032
- Table 143: Rest of South America Wearable Heart Monitoring Devices Industry Revenue (Million) Forecast, by Application 2019 & 2032
- Table 144: Rest of South America Wearable Heart Monitoring Devices Industry Volume (K Unit) Forecast, by Application 2019 & 2032
Frequently Asked Questions
1. What is the projected Compound Annual Growth Rate (CAGR) of the Wearable Heart Monitoring Devices Industry?
The projected CAGR is approximately 23.22%.
2. Which companies are prominent players in the Wearable Heart Monitoring Devices Industry?
Key companies in the market include General Electric Company (GE Healthcare Inc ), iRhythm Technologies Inc, Qardio Inc, Baxter, Hemodynamics Company LLC, ACS Diagnostics Inc, Koninklijke Philips N V (BioTelemetry Inc ), Boston Scientific (Preventice Solutions Inc ), Heartbit Holdings Plc, Medtronic plc, Vital Connect Inc , Asahi Kasei Corporation (ZOLL Medical Corporation).
3. What are the main segments of the Wearable Heart Monitoring Devices Industry?
The market segments include Product, Device Type, Application.
4. Can you provide details about the market size?
The market size is estimated to be USD 2.98 Million as of 2022.
5. What are some drivers contributing to market growth?
Increasing Rate of Heart Failure; Rising Awareness of Wearables-based Cardiac Monitoring; Technological advancements in Wearable Devices.
6. What are the notable trends driving market growth?
The Optical Technology-based Product is Projected to Have a Notable Growth Rate in the Wearable Heart Monitoring Devices Market Over the Forecast Period.
7. Are there any restraints impacting market growth?
Privacy and Security Issue of Wearable Devices; Stringent Rules & Regulatory Policy.
8. Can you provide examples of recent developments in the market?
In December 2022, researchers at the University of Missouri College of Engineering designed a breathable new heart health wearable with antimicrobial properties using a USD 2.6 million grant from the National Institute of Health.
9. What pricing options are available for accessing the report?
Pricing options include single-user, multi-user, and enterprise licenses priced at USD 4750, USD 5250, and USD 8750 respectively.
10. Is the market size provided in terms of value or volume?
The market size is provided in terms of value, measured in Million and volume, measured in K Unit.
11. Are there any specific market keywords associated with the report?
Yes, the market keyword associated with the report is "Wearable Heart Monitoring Devices Industry," which aids in identifying and referencing the specific market segment covered.
12. How do I determine which pricing option suits my needs best?
The pricing options vary based on user requirements and access needs. Individual users may opt for single-user licenses, while businesses requiring broader access may choose multi-user or enterprise licenses for cost-effective access to the report.
13. Are there any additional resources or data provided in the Wearable Heart Monitoring Devices Industry report?
While the report offers comprehensive insights, it's advisable to review the specific contents or supplementary materials provided to ascertain if additional resources or data are available.
14. How can I stay updated on further developments or reports in the Wearable Heart Monitoring Devices Industry?
To stay informed about further developments, trends, and reports in the Wearable Heart Monitoring Devices Industry, consider subscribing to industry newsletters, following relevant companies and organizations, or regularly checking reputable industry news sources and publications.
Methodology
Step 1 - Identification of Relevant Samples Size from Population Database


Step 2 - Approaches for Defining Global Market Size (Value, Volume* & Price*)

Note*: In applicable scenarios
Step 3 - Data Sources
Primary Research
- Web Analytics
- Survey Reports
- Research Institute
- Latest Research Reports
- Opinion Leaders
Secondary Research
- Annual Reports
- White Paper
- Latest Press Release
- Industry Association
- Paid Database
- Investor Presentations

Step 4 - Data Triangulation
Involves using different sources of information in order to increase the validity of a study
These sources are likely to be stakeholders in a program - participants, other researchers, program staff, other community members, and so on.
Then we put all data in single framework & apply various statistical tools to find out the dynamic on the market.
During the analysis stage, feedback from the stakeholder groups would be compared to determine areas of agreement as well as areas of divergence


