
Key Insights
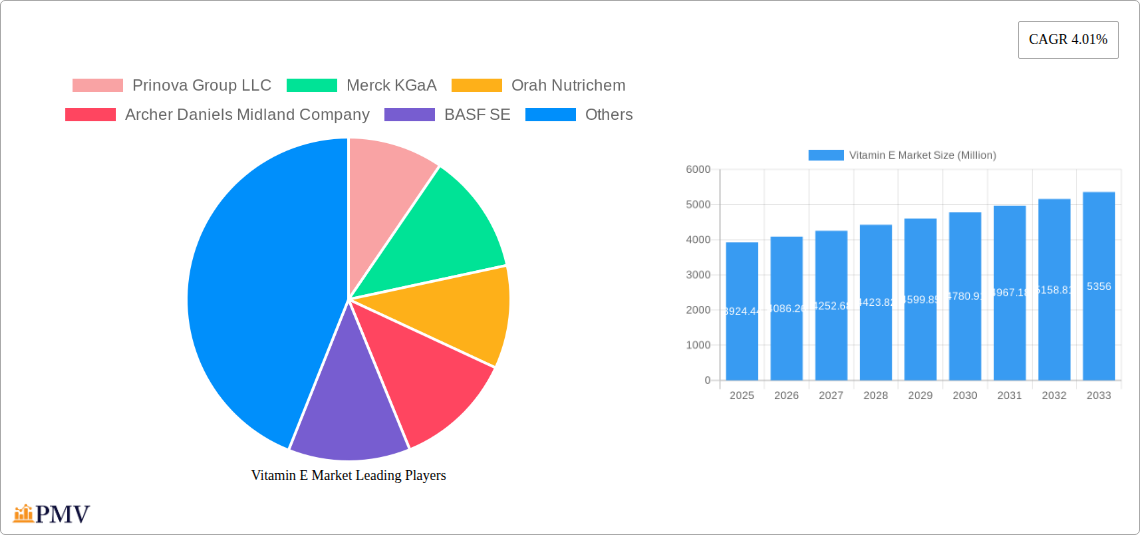
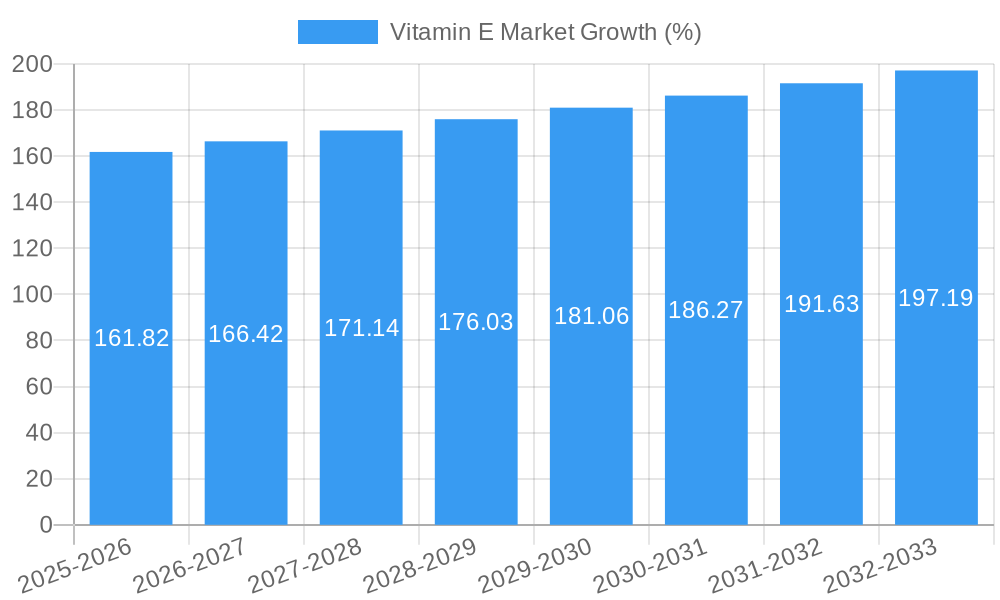
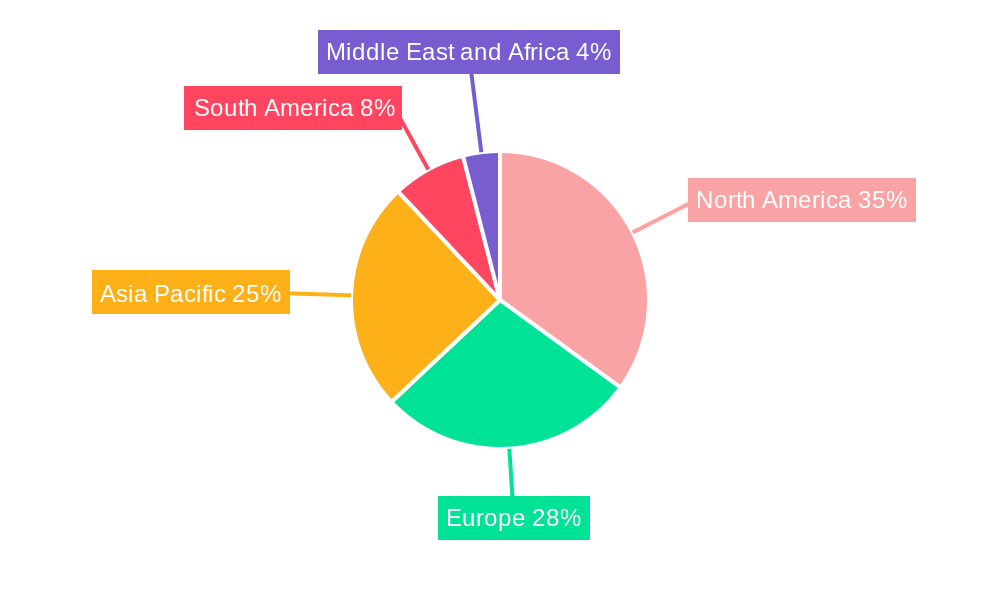
The global Vitamin E market, valued at $3924.44 million in 2025, is projected to experience robust growth, driven by increasing consumer awareness of its health benefits and expanding applications across diverse sectors. The market's Compound Annual Growth Rate (CAGR) of 4.01% from 2019 to 2024 indicates a steady, albeit moderate, expansion. This growth is fueled by several key factors. The rising prevalence of chronic diseases like cardiovascular ailments and diabetes is boosting demand for Vitamin E supplements. Furthermore, the growing popularity of functional foods and beverages enriched with vitamins is significantly contributing to market expansion. The increasing use of Vitamin E in cosmetics and personal care products as an antioxidant and skin protectant also represents a significant growth driver. The market is segmented by product type (natural and synthetic) and application (functional food & beverages, pharmaceuticals & dietary supplements, infant nutrition, pet food & animal feed, cosmetics). The natural Vitamin E segment is anticipated to witness higher growth due to growing consumer preference for natural ingredients. Geographically, North America and Europe currently hold substantial market shares, however, the Asia-Pacific region is poised for significant growth driven by increasing disposable incomes and rising health consciousness in developing economies like India and China. Competitive landscape analysis reveals the presence of both large multinational corporations and specialized players, leading to both innovation and price competition.
While the market shows promising growth trajectory, certain challenges persist. Fluctuations in raw material prices and stringent regulatory frameworks in various regions can influence profitability. Furthermore, consumer perception and trust in supplement efficacy and safety remain critical aspects impacting market dynamics. Successfully navigating these challenges will require companies to focus on product innovation, efficient supply chain management, and effective marketing strategies that highlight the health benefits of Vitamin E backed by scientific evidence. The forecast period (2025-2033) anticipates continued market expansion, primarily driven by the aforementioned factors, although the exact growth rate may be influenced by evolving macroeconomic conditions and consumer preferences. The market’s future trajectory will depend on further innovation in delivery systems, formulations, and the development of new applications in emerging areas.
Vitamin E Market: A Comprehensive Report (2019-2033)
This detailed report provides a comprehensive analysis of the global Vitamin E market, offering invaluable insights for industry stakeholders, investors, and researchers. Covering the period from 2019 to 2033, with a base year of 2025, this report meticulously examines market dynamics, competitive landscapes, and future growth prospects. The study encompasses detailed segmentations by product type (natural and synthetic) and application (functional food and beverages, pharmaceuticals and dietary supplements, infant nutrition, pet food and animal feed, and cosmetics). The report’s findings are supported by rigorous data analysis and incorporate key developments impacting the market's trajectory. The global Vitamin E market is projected to reach xx Million by 2033, exhibiting a CAGR of xx% during the forecast period (2025-2033).
Vitamin E Market Market Structure & Competitive Dynamics
The Vitamin E market exhibits a moderately concentrated structure, with a few major players holding significant market share. However, the presence of numerous smaller companies and regional players contributes to a dynamic competitive landscape. Innovation within the industry focuses on enhancing product purity, efficacy, and bioavailability. Stringent regulatory frameworks governing food and pharmaceutical ingredients significantly impact market operations. Natural Vitamin E, due to growing consumer preference for natural products, is witnessing increasing demand and presenting a key area of competition. Mergers and acquisitions (M&A) activity is a significant factor influencing market consolidation, with deal values reaching xx Million in recent years.
- Market Concentration: High, with top 5 players holding approximately xx% of market share in 2024.
- Innovation Ecosystem: Active R&D focused on improved extraction techniques, enhanced formulations, and delivery systems.
- Regulatory Frameworks: Stringent regulations regarding purity, labeling, and safety standards, particularly in the food and pharmaceutical sectors.
- Product Substitutes: Limited direct substitutes; however, other antioxidants may present indirect competition.
- End-User Trends: Growing preference for natural and organic products, coupled with increased health consciousness.
- M&A Activities: Significant M&A activity in recent years, driven by market consolidation and expansion strategies. Examples include the One Rock Capital acquisition of BASF's specialty chemical facility in 2021.
Vitamin E Market Industry Trends & Insights
The Vitamin E market is experiencing robust growth fueled by the escalating demand for health supplements, fortified foods, and cosmetic products. The increasing prevalence of chronic diseases and a rising awareness of the benefits of antioxidants are key drivers. Technological advancements in extraction and production methods are enhancing efficiency and reducing costs. Consumer preference is shifting towards natural Vitamin E due to concerns about synthetic alternatives. Intense competition necessitates continuous innovation and strategic partnerships to maintain a competitive edge. The market penetration of Vitamin E in various application segments is expected to rise significantly in the coming years, with notable growth anticipated particularly in the functional food and beverage sector.
Dominant Markets & Segments in Vitamin E Market
The North American region is currently the dominant market for Vitamin E, driven by strong consumer demand and established distribution channels. Within the product type segment, natural Vitamin E is experiencing faster growth compared to its synthetic counterpart. The functional food and beverage and pharmaceutical/dietary supplement sectors are the largest application segments, showcasing significant potential.
- Key Drivers for North American Dominance: High disposable income, health-conscious consumer base, robust healthcare infrastructure.
- Natural Vitamin E: Driven by increased consumer preference for natural ingredients and perceptions of superior quality.
- Functional Food & Beverages: The growing popularity of functional foods and beverages enriched with vitamins and antioxidants fuels high growth potential.
- Pharmaceuticals & Dietary Supplements: Demand from the pharmaceutical industry to fortify products and the growing dietary supplements market.
The European market is also a significant contributor, exhibiting similar growth patterns driven by a similar focus on health and wellness. Asia-Pacific is expected to experience substantial growth in the forecast period, fuelled by rising disposable incomes and growing awareness of health benefits.
Vitamin E Market Product Innovations
Recent product innovations have centered on developing more bioavailable and stable Vitamin E formulations. The industry is also focusing on developing new delivery systems to enhance absorption and efficacy. These advancements are addressing consumer needs and enhancing the value proposition of Vitamin E products in the competitive market. Companies are increasingly incorporating sustainable and ethically sourced Vitamin E to cater to the rising demand for environmentally friendly products.
Report Segmentation & Scope
This report provides a detailed segmentation of the Vitamin E market across various parameters:
By Product Type: Natural Vitamin E and Synthetic Vitamin E. Growth projections indicate a faster growth rate for the natural segment. Competitive dynamics vary significantly between segments, with differences in production costs and consumer preference. Market sizes vary accordingly.
By Application: Functional Food & Beverages (substantial market size and high growth rate), Pharmaceuticals & Dietary Supplements (large market size with steady growth), Infant Nutrition (smaller market size but high growth rate), Pet Food & Animal Feed (moderate market size and steady growth), and Cosmetics (moderate market size and growth potential). Competitive dynamics are application-specific, reflecting varying regulatory requirements and consumer preferences.
Key Drivers of Vitamin E Market Growth
The Vitamin E market's growth is predominantly propelled by:
- Growing health consciousness: The rising awareness of the health benefits of antioxidants and their role in preventing chronic diseases fuels increased consumption.
- Increasing demand for functional foods and beverages: Consumers are actively seeking fortified foods and drinks.
- Technological advancements: Innovations in extraction and production techniques are leading to improved quality and cost-effectiveness.
- Stringent regulatory frameworks: Though stringent, these ensure product safety and enhance consumer trust.
Challenges in the Vitamin E Market Sector
The Vitamin E market faces several challenges:
- Fluctuations in raw material prices: The cost of raw materials affects overall profitability.
- Intense competition: Many players compete for market share, requiring ongoing innovation.
- Regulatory compliance: Adhering to various regulations in different regions increases compliance costs.
- Supply chain disruptions: Global events can significantly impact the supply chain and availability of raw materials.
Leading Players in the Vitamin E Market Market
- Prinova Group LLC
- Merck KGaA
- Orah Nutrichem
- Archer Daniels Midland Company
- BASF SE
- Aryan International
- Koninklijke DSM NV
- The Bountiful Company
- Jilin Beisha Pharmaceutical Co Ltd
- BTSA Biotecnologías Aplicadas SL
Key Developments in Vitamin E Market Sector
- June 2021: Prinova launched an e-commerce website to enhance ingredient purchases in the United States, aiming to deliver B2B vitamin distribution solutions worldwide.
- June 2021: One Rock Capital acquired BASF's specialty chemical facility in Kankakee, Illinois, focusing on vegetable oils, natural Vitamin E, and specialty chemicals.
- December 2021: The Kensing company partnered with Azelis to improve the distribution of vegetable oils, vitamins, and personal care products across Europe, the Middle East, and Africa.
Strategic Vitamin E Market Market Outlook
The Vitamin E market holds significant potential for growth driven by increasing demand and ongoing technological innovation. Strategic opportunities include expanding into emerging markets, developing innovative product formulations, and fostering strategic partnerships to expand distribution networks. Focus on sustainable and ethical sourcing will also be crucial for long-term success. The market is poised for continued expansion, driven by factors such as evolving consumer preferences and technological advancements.
Vitamin E Market Segmentation
-
1. Product Type
- 1.1. Natural
- 1.2. Synthetic
-
2. Application
- 2.1. Functional Food and Beverages
- 2.2. Pharmaceuticals and Dietary Supplements
- 2.3. Infant Nutrition
- 2.4. Pet Food and Animal Feed
- 2.5. Cosmetics
Vitamin E Market Segmentation By Geography
-
1. North America
- 1.1. United States
- 1.2. Canada
- 1.3. Mexico
- 1.4. Rest of North America
-
2. Europe
- 2.1. Germany
- 2.2. United Kingdom
- 2.3. France
- 2.4. Russia
- 2.5. Spain
- 2.6. Italy
- 2.7. Rest of Europe
-
3. Asia Pacific
- 3.1. India
- 3.2. China
- 3.3. Japan
- 3.4. Australia
- 3.5. Rest of Asia Pacific
-
4. South America
- 4.1. Brazil
- 4.2. Argentina
- 4.3. Rest of South America
-
5. Middle East and Africa
- 5.1. South Africa
- 5.2. Saudi Arabia
- 5.3. Rest of Middle East and Africa
Vitamin E Market REPORT HIGHLIGHTS
| Aspects | Details |
|---|---|
| Study Period | 2019-2033 |
| Base Year | 2024 |
| Estimated Year | 2025 |
| Forecast Period | 2025-2033 |
| Historical Period | 2019-2024 |
| Growth Rate | CAGR of 4.01% from 2019-2033 |
| Segmentation |
|
Table of Contents
- 1. Introduction
- 1.1. Research Scope
- 1.2. Market Segmentation
- 1.3. Research Methodology
- 1.4. Definitions and Assumptions
- 2. Executive Summary
- 2.1. Introduction
- 3. Market Dynamics
- 3.1. Introduction
- 3.2. Market Drivers
- 3.2.1. Awareness of Health Benefits Associated with Tocotrienol; Escalating Demand for Anti-Aging Products Containing Tocotrienol
- 3.3. Market Restrains
- 3.3.1. Availability of Substitutes
- 3.4. Market Trends
- 3.4.1. Increasing Demand for Vitamin E in Various Applications
- 4. Market Factor Analysis
- 4.1. Porters Five Forces
- 4.2. Supply/Value Chain
- 4.3. PESTEL analysis
- 4.4. Market Entropy
- 4.5. Patent/Trademark Analysis
- 5. Global Vitamin E Market Analysis, Insights and Forecast, 2019-2031
- 5.1. Market Analysis, Insights and Forecast - by Product Type
- 5.1.1. Natural
- 5.1.2. Synthetic
- 5.2. Market Analysis, Insights and Forecast - by Application
- 5.2.1. Functional Food and Beverages
- 5.2.2. Pharmaceuticals and Dietary Supplements
- 5.2.3. Infant Nutrition
- 5.2.4. Pet Food and Animal Feed
- 5.2.5. Cosmetics
- 5.3. Market Analysis, Insights and Forecast - by Region
- 5.3.1. North America
- 5.3.2. Europe
- 5.3.3. Asia Pacific
- 5.3.4. South America
- 5.3.5. Middle East and Africa
- 5.1. Market Analysis, Insights and Forecast - by Product Type
- 6. North America Vitamin E Market Analysis, Insights and Forecast, 2019-2031
- 6.1. Market Analysis, Insights and Forecast - by Product Type
- 6.1.1. Natural
- 6.1.2. Synthetic
- 6.2. Market Analysis, Insights and Forecast - by Application
- 6.2.1. Functional Food and Beverages
- 6.2.2. Pharmaceuticals and Dietary Supplements
- 6.2.3. Infant Nutrition
- 6.2.4. Pet Food and Animal Feed
- 6.2.5. Cosmetics
- 6.1. Market Analysis, Insights and Forecast - by Product Type
- 7. Europe Vitamin E Market Analysis, Insights and Forecast, 2019-2031
- 7.1. Market Analysis, Insights and Forecast - by Product Type
- 7.1.1. Natural
- 7.1.2. Synthetic
- 7.2. Market Analysis, Insights and Forecast - by Application
- 7.2.1. Functional Food and Beverages
- 7.2.2. Pharmaceuticals and Dietary Supplements
- 7.2.3. Infant Nutrition
- 7.2.4. Pet Food and Animal Feed
- 7.2.5. Cosmetics
- 7.1. Market Analysis, Insights and Forecast - by Product Type
- 8. Asia Pacific Vitamin E Market Analysis, Insights and Forecast, 2019-2031
- 8.1. Market Analysis, Insights and Forecast - by Product Type
- 8.1.1. Natural
- 8.1.2. Synthetic
- 8.2. Market Analysis, Insights and Forecast - by Application
- 8.2.1. Functional Food and Beverages
- 8.2.2. Pharmaceuticals and Dietary Supplements
- 8.2.3. Infant Nutrition
- 8.2.4. Pet Food and Animal Feed
- 8.2.5. Cosmetics
- 8.1. Market Analysis, Insights and Forecast - by Product Type
- 9. South America Vitamin E Market Analysis, Insights and Forecast, 2019-2031
- 9.1. Market Analysis, Insights and Forecast - by Product Type
- 9.1.1. Natural
- 9.1.2. Synthetic
- 9.2. Market Analysis, Insights and Forecast - by Application
- 9.2.1. Functional Food and Beverages
- 9.2.2. Pharmaceuticals and Dietary Supplements
- 9.2.3. Infant Nutrition
- 9.2.4. Pet Food and Animal Feed
- 9.2.5. Cosmetics
- 9.1. Market Analysis, Insights and Forecast - by Product Type
- 10. Middle East and Africa Vitamin E Market Analysis, Insights and Forecast, 2019-2031
- 10.1. Market Analysis, Insights and Forecast - by Product Type
- 10.1.1. Natural
- 10.1.2. Synthetic
- 10.2. Market Analysis, Insights and Forecast - by Application
- 10.2.1. Functional Food and Beverages
- 10.2.2. Pharmaceuticals and Dietary Supplements
- 10.2.3. Infant Nutrition
- 10.2.4. Pet Food and Animal Feed
- 10.2.5. Cosmetics
- 10.1. Market Analysis, Insights and Forecast - by Product Type
- 11. North America Vitamin E Market Analysis, Insights and Forecast, 2019-2031
- 11.1. Market Analysis, Insights and Forecast - By Country/Sub-region
- 11.1.1 United States
- 11.1.2 Canada
- 11.1.3 Mexico
- 11.1.4 Rest of North America
- 12. Europe Vitamin E Market Analysis, Insights and Forecast, 2019-2031
- 12.1. Market Analysis, Insights and Forecast - By Country/Sub-region
- 12.1.1 Germany
- 12.1.2 United Kingdom
- 12.1.3 France
- 12.1.4 Russia
- 12.1.5 Spain
- 12.1.6 Italy
- 12.1.7 Rest of Europe
- 13. Asia Pacific Vitamin E Market Analysis, Insights and Forecast, 2019-2031
- 13.1. Market Analysis, Insights and Forecast - By Country/Sub-region
- 13.1.1 India
- 13.1.2 China
- 13.1.3 Japan
- 13.1.4 Australia
- 13.1.5 Rest of Asia Pacific
- 14. South America Vitamin E Market Analysis, Insights and Forecast, 2019-2031
- 14.1. Market Analysis, Insights and Forecast - By Country/Sub-region
- 14.1.1 Brazil
- 14.1.2 Argentina
- 14.1.3 Rest of South America
- 15. Middle East and Africa Vitamin E Market Analysis, Insights and Forecast, 2019-2031
- 15.1. Market Analysis, Insights and Forecast - By Country/Sub-region
- 15.1.1 South Africa
- 15.1.2 Saudi Arabia
- 15.1.3 Rest of Middle East and Africa
- 16. Competitive Analysis
- 16.1. Global Market Share Analysis 2024
- 16.2. Company Profiles
- 16.2.1 Prinova Group LLC
- 16.2.1.1. Overview
- 16.2.1.2. Products
- 16.2.1.3. SWOT Analysis
- 16.2.1.4. Recent Developments
- 16.2.1.5. Financials (Based on Availability)
- 16.2.2 Merck KGaA
- 16.2.2.1. Overview
- 16.2.2.2. Products
- 16.2.2.3. SWOT Analysis
- 16.2.2.4. Recent Developments
- 16.2.2.5. Financials (Based on Availability)
- 16.2.3 Orah Nutrichem
- 16.2.3.1. Overview
- 16.2.3.2. Products
- 16.2.3.3. SWOT Analysis
- 16.2.3.4. Recent Developments
- 16.2.3.5. Financials (Based on Availability)
- 16.2.4 Archer Daniels Midland Company
- 16.2.4.1. Overview
- 16.2.4.2. Products
- 16.2.4.3. SWOT Analysis
- 16.2.4.4. Recent Developments
- 16.2.4.5. Financials (Based on Availability)
- 16.2.5 BASF SE
- 16.2.5.1. Overview
- 16.2.5.2. Products
- 16.2.5.3. SWOT Analysis
- 16.2.5.4. Recent Developments
- 16.2.5.5. Financials (Based on Availability)
- 16.2.6 Aryan International
- 16.2.6.1. Overview
- 16.2.6.2. Products
- 16.2.6.3. SWOT Analysis
- 16.2.6.4. Recent Developments
- 16.2.6.5. Financials (Based on Availability)
- 16.2.7 Koninklijke DSM NV
- 16.2.7.1. Overview
- 16.2.7.2. Products
- 16.2.7.3. SWOT Analysis
- 16.2.7.4. Recent Developments
- 16.2.7.5. Financials (Based on Availability)
- 16.2.8 The Bountiful Company*List Not Exhaustive
- 16.2.8.1. Overview
- 16.2.8.2. Products
- 16.2.8.3. SWOT Analysis
- 16.2.8.4. Recent Developments
- 16.2.8.5. Financials (Based on Availability)
- 16.2.9 Jilin Beisha Pharmaceutical Co Ltd
- 16.2.9.1. Overview
- 16.2.9.2. Products
- 16.2.9.3. SWOT Analysis
- 16.2.9.4. Recent Developments
- 16.2.9.5. Financials (Based on Availability)
- 16.2.10 BTSA Biotecnologías Aplicadas SL
- 16.2.10.1. Overview
- 16.2.10.2. Products
- 16.2.10.3. SWOT Analysis
- 16.2.10.4. Recent Developments
- 16.2.10.5. Financials (Based on Availability)
- 16.2.1 Prinova Group LLC
List of Figures
- Figure 1: Global Vitamin E Market Revenue Breakdown (Million, %) by Region 2024 & 2032
- Figure 2: Global Vitamin E Market Volume Breakdown (K Tons, %) by Region 2024 & 2032
- Figure 3: North America Vitamin E Market Revenue (Million), by Country 2024 & 2032
- Figure 4: North America Vitamin E Market Volume (K Tons), by Country 2024 & 2032
- Figure 5: North America Vitamin E Market Revenue Share (%), by Country 2024 & 2032
- Figure 6: North America Vitamin E Market Volume Share (%), by Country 2024 & 2032
- Figure 7: Europe Vitamin E Market Revenue (Million), by Country 2024 & 2032
- Figure 8: Europe Vitamin E Market Volume (K Tons), by Country 2024 & 2032
- Figure 9: Europe Vitamin E Market Revenue Share (%), by Country 2024 & 2032
- Figure 10: Europe Vitamin E Market Volume Share (%), by Country 2024 & 2032
- Figure 11: Asia Pacific Vitamin E Market Revenue (Million), by Country 2024 & 2032
- Figure 12: Asia Pacific Vitamin E Market Volume (K Tons), by Country 2024 & 2032
- Figure 13: Asia Pacific Vitamin E Market Revenue Share (%), by Country 2024 & 2032
- Figure 14: Asia Pacific Vitamin E Market Volume Share (%), by Country 2024 & 2032
- Figure 15: South America Vitamin E Market Revenue (Million), by Country 2024 & 2032
- Figure 16: South America Vitamin E Market Volume (K Tons), by Country 2024 & 2032
- Figure 17: South America Vitamin E Market Revenue Share (%), by Country 2024 & 2032
- Figure 18: South America Vitamin E Market Volume Share (%), by Country 2024 & 2032
- Figure 19: Middle East and Africa Vitamin E Market Revenue (Million), by Country 2024 & 2032
- Figure 20: Middle East and Africa Vitamin E Market Volume (K Tons), by Country 2024 & 2032
- Figure 21: Middle East and Africa Vitamin E Market Revenue Share (%), by Country 2024 & 2032
- Figure 22: Middle East and Africa Vitamin E Market Volume Share (%), by Country 2024 & 2032
- Figure 23: North America Vitamin E Market Revenue (Million), by Product Type 2024 & 2032
- Figure 24: North America Vitamin E Market Volume (K Tons), by Product Type 2024 & 2032
- Figure 25: North America Vitamin E Market Revenue Share (%), by Product Type 2024 & 2032
- Figure 26: North America Vitamin E Market Volume Share (%), by Product Type 2024 & 2032
- Figure 27: North America Vitamin E Market Revenue (Million), by Application 2024 & 2032
- Figure 28: North America Vitamin E Market Volume (K Tons), by Application 2024 & 2032
- Figure 29: North America Vitamin E Market Revenue Share (%), by Application 2024 & 2032
- Figure 30: North America Vitamin E Market Volume Share (%), by Application 2024 & 2032
- Figure 31: North America Vitamin E Market Revenue (Million), by Country 2024 & 2032
- Figure 32: North America Vitamin E Market Volume (K Tons), by Country 2024 & 2032
- Figure 33: North America Vitamin E Market Revenue Share (%), by Country 2024 & 2032
- Figure 34: North America Vitamin E Market Volume Share (%), by Country 2024 & 2032
- Figure 35: Europe Vitamin E Market Revenue (Million), by Product Type 2024 & 2032
- Figure 36: Europe Vitamin E Market Volume (K Tons), by Product Type 2024 & 2032
- Figure 37: Europe Vitamin E Market Revenue Share (%), by Product Type 2024 & 2032
- Figure 38: Europe Vitamin E Market Volume Share (%), by Product Type 2024 & 2032
- Figure 39: Europe Vitamin E Market Revenue (Million), by Application 2024 & 2032
- Figure 40: Europe Vitamin E Market Volume (K Tons), by Application 2024 & 2032
- Figure 41: Europe Vitamin E Market Revenue Share (%), by Application 2024 & 2032
- Figure 42: Europe Vitamin E Market Volume Share (%), by Application 2024 & 2032
- Figure 43: Europe Vitamin E Market Revenue (Million), by Country 2024 & 2032
- Figure 44: Europe Vitamin E Market Volume (K Tons), by Country 2024 & 2032
- Figure 45: Europe Vitamin E Market Revenue Share (%), by Country 2024 & 2032
- Figure 46: Europe Vitamin E Market Volume Share (%), by Country 2024 & 2032
- Figure 47: Asia Pacific Vitamin E Market Revenue (Million), by Product Type 2024 & 2032
- Figure 48: Asia Pacific Vitamin E Market Volume (K Tons), by Product Type 2024 & 2032
- Figure 49: Asia Pacific Vitamin E Market Revenue Share (%), by Product Type 2024 & 2032
- Figure 50: Asia Pacific Vitamin E Market Volume Share (%), by Product Type 2024 & 2032
- Figure 51: Asia Pacific Vitamin E Market Revenue (Million), by Application 2024 & 2032
- Figure 52: Asia Pacific Vitamin E Market Volume (K Tons), by Application 2024 & 2032
- Figure 53: Asia Pacific Vitamin E Market Revenue Share (%), by Application 2024 & 2032
- Figure 54: Asia Pacific Vitamin E Market Volume Share (%), by Application 2024 & 2032
- Figure 55: Asia Pacific Vitamin E Market Revenue (Million), by Country 2024 & 2032
- Figure 56: Asia Pacific Vitamin E Market Volume (K Tons), by Country 2024 & 2032
- Figure 57: Asia Pacific Vitamin E Market Revenue Share (%), by Country 2024 & 2032
- Figure 58: Asia Pacific Vitamin E Market Volume Share (%), by Country 2024 & 2032
- Figure 59: South America Vitamin E Market Revenue (Million), by Product Type 2024 & 2032
- Figure 60: South America Vitamin E Market Volume (K Tons), by Product Type 2024 & 2032
- Figure 61: South America Vitamin E Market Revenue Share (%), by Product Type 2024 & 2032
- Figure 62: South America Vitamin E Market Volume Share (%), by Product Type 2024 & 2032
- Figure 63: South America Vitamin E Market Revenue (Million), by Application 2024 & 2032
- Figure 64: South America Vitamin E Market Volume (K Tons), by Application 2024 & 2032
- Figure 65: South America Vitamin E Market Revenue Share (%), by Application 2024 & 2032
- Figure 66: South America Vitamin E Market Volume Share (%), by Application 2024 & 2032
- Figure 67: South America Vitamin E Market Revenue (Million), by Country 2024 & 2032
- Figure 68: South America Vitamin E Market Volume (K Tons), by Country 2024 & 2032
- Figure 69: South America Vitamin E Market Revenue Share (%), by Country 2024 & 2032
- Figure 70: South America Vitamin E Market Volume Share (%), by Country 2024 & 2032
- Figure 71: Middle East and Africa Vitamin E Market Revenue (Million), by Product Type 2024 & 2032
- Figure 72: Middle East and Africa Vitamin E Market Volume (K Tons), by Product Type 2024 & 2032
- Figure 73: Middle East and Africa Vitamin E Market Revenue Share (%), by Product Type 2024 & 2032
- Figure 74: Middle East and Africa Vitamin E Market Volume Share (%), by Product Type 2024 & 2032
- Figure 75: Middle East and Africa Vitamin E Market Revenue (Million), by Application 2024 & 2032
- Figure 76: Middle East and Africa Vitamin E Market Volume (K Tons), by Application 2024 & 2032
- Figure 77: Middle East and Africa Vitamin E Market Revenue Share (%), by Application 2024 & 2032
- Figure 78: Middle East and Africa Vitamin E Market Volume Share (%), by Application 2024 & 2032
- Figure 79: Middle East and Africa Vitamin E Market Revenue (Million), by Country 2024 & 2032
- Figure 80: Middle East and Africa Vitamin E Market Volume (K Tons), by Country 2024 & 2032
- Figure 81: Middle East and Africa Vitamin E Market Revenue Share (%), by Country 2024 & 2032
- Figure 82: Middle East and Africa Vitamin E Market Volume Share (%), by Country 2024 & 2032
List of Tables
- Table 1: Global Vitamin E Market Revenue Million Forecast, by Region 2019 & 2032
- Table 2: Global Vitamin E Market Volume K Tons Forecast, by Region 2019 & 2032
- Table 3: Global Vitamin E Market Revenue Million Forecast, by Product Type 2019 & 2032
- Table 4: Global Vitamin E Market Volume K Tons Forecast, by Product Type 2019 & 2032
- Table 5: Global Vitamin E Market Revenue Million Forecast, by Application 2019 & 2032
- Table 6: Global Vitamin E Market Volume K Tons Forecast, by Application 2019 & 2032
- Table 7: Global Vitamin E Market Revenue Million Forecast, by Region 2019 & 2032
- Table 8: Global Vitamin E Market Volume K Tons Forecast, by Region 2019 & 2032
- Table 9: Global Vitamin E Market Revenue Million Forecast, by Country 2019 & 2032
- Table 10: Global Vitamin E Market Volume K Tons Forecast, by Country 2019 & 2032
- Table 11: United States Vitamin E Market Revenue (Million) Forecast, by Application 2019 & 2032
- Table 12: United States Vitamin E Market Volume (K Tons) Forecast, by Application 2019 & 2032
- Table 13: Canada Vitamin E Market Revenue (Million) Forecast, by Application 2019 & 2032
- Table 14: Canada Vitamin E Market Volume (K Tons) Forecast, by Application 2019 & 2032
- Table 15: Mexico Vitamin E Market Revenue (Million) Forecast, by Application 2019 & 2032
- Table 16: Mexico Vitamin E Market Volume (K Tons) Forecast, by Application 2019 & 2032
- Table 17: Rest of North America Vitamin E Market Revenue (Million) Forecast, by Application 2019 & 2032
- Table 18: Rest of North America Vitamin E Market Volume (K Tons) Forecast, by Application 2019 & 2032
- Table 19: Global Vitamin E Market Revenue Million Forecast, by Country 2019 & 2032
- Table 20: Global Vitamin E Market Volume K Tons Forecast, by Country 2019 & 2032
- Table 21: Germany Vitamin E Market Revenue (Million) Forecast, by Application 2019 & 2032
- Table 22: Germany Vitamin E Market Volume (K Tons) Forecast, by Application 2019 & 2032
- Table 23: United Kingdom Vitamin E Market Revenue (Million) Forecast, by Application 2019 & 2032
- Table 24: United Kingdom Vitamin E Market Volume (K Tons) Forecast, by Application 2019 & 2032
- Table 25: France Vitamin E Market Revenue (Million) Forecast, by Application 2019 & 2032
- Table 26: France Vitamin E Market Volume (K Tons) Forecast, by Application 2019 & 2032
- Table 27: Russia Vitamin E Market Revenue (Million) Forecast, by Application 2019 & 2032
- Table 28: Russia Vitamin E Market Volume (K Tons) Forecast, by Application 2019 & 2032
- Table 29: Spain Vitamin E Market Revenue (Million) Forecast, by Application 2019 & 2032
- Table 30: Spain Vitamin E Market Volume (K Tons) Forecast, by Application 2019 & 2032
- Table 31: Italy Vitamin E Market Revenue (Million) Forecast, by Application 2019 & 2032
- Table 32: Italy Vitamin E Market Volume (K Tons) Forecast, by Application 2019 & 2032
- Table 33: Rest of Europe Vitamin E Market Revenue (Million) Forecast, by Application 2019 & 2032
- Table 34: Rest of Europe Vitamin E Market Volume (K Tons) Forecast, by Application 2019 & 2032
- Table 35: Global Vitamin E Market Revenue Million Forecast, by Country 2019 & 2032
- Table 36: Global Vitamin E Market Volume K Tons Forecast, by Country 2019 & 2032
- Table 37: India Vitamin E Market Revenue (Million) Forecast, by Application 2019 & 2032
- Table 38: India Vitamin E Market Volume (K Tons) Forecast, by Application 2019 & 2032
- Table 39: China Vitamin E Market Revenue (Million) Forecast, by Application 2019 & 2032
- Table 40: China Vitamin E Market Volume (K Tons) Forecast, by Application 2019 & 2032
- Table 41: Japan Vitamin E Market Revenue (Million) Forecast, by Application 2019 & 2032
- Table 42: Japan Vitamin E Market Volume (K Tons) Forecast, by Application 2019 & 2032
- Table 43: Australia Vitamin E Market Revenue (Million) Forecast, by Application 2019 & 2032
- Table 44: Australia Vitamin E Market Volume (K Tons) Forecast, by Application 2019 & 2032
- Table 45: Rest of Asia Pacific Vitamin E Market Revenue (Million) Forecast, by Application 2019 & 2032
- Table 46: Rest of Asia Pacific Vitamin E Market Volume (K Tons) Forecast, by Application 2019 & 2032
- Table 47: Global Vitamin E Market Revenue Million Forecast, by Country 2019 & 2032
- Table 48: Global Vitamin E Market Volume K Tons Forecast, by Country 2019 & 2032
- Table 49: Brazil Vitamin E Market Revenue (Million) Forecast, by Application 2019 & 2032
- Table 50: Brazil Vitamin E Market Volume (K Tons) Forecast, by Application 2019 & 2032
- Table 51: Argentina Vitamin E Market Revenue (Million) Forecast, by Application 2019 & 2032
- Table 52: Argentina Vitamin E Market Volume (K Tons) Forecast, by Application 2019 & 2032
- Table 53: Rest of South America Vitamin E Market Revenue (Million) Forecast, by Application 2019 & 2032
- Table 54: Rest of South America Vitamin E Market Volume (K Tons) Forecast, by Application 2019 & 2032
- Table 55: Global Vitamin E Market Revenue Million Forecast, by Country 2019 & 2032
- Table 56: Global Vitamin E Market Volume K Tons Forecast, by Country 2019 & 2032
- Table 57: South Africa Vitamin E Market Revenue (Million) Forecast, by Application 2019 & 2032
- Table 58: South Africa Vitamin E Market Volume (K Tons) Forecast, by Application 2019 & 2032
- Table 59: Saudi Arabia Vitamin E Market Revenue (Million) Forecast, by Application 2019 & 2032
- Table 60: Saudi Arabia Vitamin E Market Volume (K Tons) Forecast, by Application 2019 & 2032
- Table 61: Rest of Middle East and Africa Vitamin E Market Revenue (Million) Forecast, by Application 2019 & 2032
- Table 62: Rest of Middle East and Africa Vitamin E Market Volume (K Tons) Forecast, by Application 2019 & 2032
- Table 63: Global Vitamin E Market Revenue Million Forecast, by Product Type 2019 & 2032
- Table 64: Global Vitamin E Market Volume K Tons Forecast, by Product Type 2019 & 2032
- Table 65: Global Vitamin E Market Revenue Million Forecast, by Application 2019 & 2032
- Table 66: Global Vitamin E Market Volume K Tons Forecast, by Application 2019 & 2032
- Table 67: Global Vitamin E Market Revenue Million Forecast, by Country 2019 & 2032
- Table 68: Global Vitamin E Market Volume K Tons Forecast, by Country 2019 & 2032
- Table 69: United States Vitamin E Market Revenue (Million) Forecast, by Application 2019 & 2032
- Table 70: United States Vitamin E Market Volume (K Tons) Forecast, by Application 2019 & 2032
- Table 71: Canada Vitamin E Market Revenue (Million) Forecast, by Application 2019 & 2032
- Table 72: Canada Vitamin E Market Volume (K Tons) Forecast, by Application 2019 & 2032
- Table 73: Mexico Vitamin E Market Revenue (Million) Forecast, by Application 2019 & 2032
- Table 74: Mexico Vitamin E Market Volume (K Tons) Forecast, by Application 2019 & 2032
- Table 75: Rest of North America Vitamin E Market Revenue (Million) Forecast, by Application 2019 & 2032
- Table 76: Rest of North America Vitamin E Market Volume (K Tons) Forecast, by Application 2019 & 2032
- Table 77: Global Vitamin E Market Revenue Million Forecast, by Product Type 2019 & 2032
- Table 78: Global Vitamin E Market Volume K Tons Forecast, by Product Type 2019 & 2032
- Table 79: Global Vitamin E Market Revenue Million Forecast, by Application 2019 & 2032
- Table 80: Global Vitamin E Market Volume K Tons Forecast, by Application 2019 & 2032
- Table 81: Global Vitamin E Market Revenue Million Forecast, by Country 2019 & 2032
- Table 82: Global Vitamin E Market Volume K Tons Forecast, by Country 2019 & 2032
- Table 83: Germany Vitamin E Market Revenue (Million) Forecast, by Application 2019 & 2032
- Table 84: Germany Vitamin E Market Volume (K Tons) Forecast, by Application 2019 & 2032
- Table 85: United Kingdom Vitamin E Market Revenue (Million) Forecast, by Application 2019 & 2032
- Table 86: United Kingdom Vitamin E Market Volume (K Tons) Forecast, by Application 2019 & 2032
- Table 87: France Vitamin E Market Revenue (Million) Forecast, by Application 2019 & 2032
- Table 88: France Vitamin E Market Volume (K Tons) Forecast, by Application 2019 & 2032
- Table 89: Russia Vitamin E Market Revenue (Million) Forecast, by Application 2019 & 2032
- Table 90: Russia Vitamin E Market Volume (K Tons) Forecast, by Application 2019 & 2032
- Table 91: Spain Vitamin E Market Revenue (Million) Forecast, by Application 2019 & 2032
- Table 92: Spain Vitamin E Market Volume (K Tons) Forecast, by Application 2019 & 2032
- Table 93: Italy Vitamin E Market Revenue (Million) Forecast, by Application 2019 & 2032
- Table 94: Italy Vitamin E Market Volume (K Tons) Forecast, by Application 2019 & 2032
- Table 95: Rest of Europe Vitamin E Market Revenue (Million) Forecast, by Application 2019 & 2032
- Table 96: Rest of Europe Vitamin E Market Volume (K Tons) Forecast, by Application 2019 & 2032
- Table 97: Global Vitamin E Market Revenue Million Forecast, by Product Type 2019 & 2032
- Table 98: Global Vitamin E Market Volume K Tons Forecast, by Product Type 2019 & 2032
- Table 99: Global Vitamin E Market Revenue Million Forecast, by Application 2019 & 2032
- Table 100: Global Vitamin E Market Volume K Tons Forecast, by Application 2019 & 2032
- Table 101: Global Vitamin E Market Revenue Million Forecast, by Country 2019 & 2032
- Table 102: Global Vitamin E Market Volume K Tons Forecast, by Country 2019 & 2032
- Table 103: India Vitamin E Market Revenue (Million) Forecast, by Application 2019 & 2032
- Table 104: India Vitamin E Market Volume (K Tons) Forecast, by Application 2019 & 2032
- Table 105: China Vitamin E Market Revenue (Million) Forecast, by Application 2019 & 2032
- Table 106: China Vitamin E Market Volume (K Tons) Forecast, by Application 2019 & 2032
- Table 107: Japan Vitamin E Market Revenue (Million) Forecast, by Application 2019 & 2032
- Table 108: Japan Vitamin E Market Volume (K Tons) Forecast, by Application 2019 & 2032
- Table 109: Australia Vitamin E Market Revenue (Million) Forecast, by Application 2019 & 2032
- Table 110: Australia Vitamin E Market Volume (K Tons) Forecast, by Application 2019 & 2032
- Table 111: Rest of Asia Pacific Vitamin E Market Revenue (Million) Forecast, by Application 2019 & 2032
- Table 112: Rest of Asia Pacific Vitamin E Market Volume (K Tons) Forecast, by Application 2019 & 2032
- Table 113: Global Vitamin E Market Revenue Million Forecast, by Product Type 2019 & 2032
- Table 114: Global Vitamin E Market Volume K Tons Forecast, by Product Type 2019 & 2032
- Table 115: Global Vitamin E Market Revenue Million Forecast, by Application 2019 & 2032
- Table 116: Global Vitamin E Market Volume K Tons Forecast, by Application 2019 & 2032
- Table 117: Global Vitamin E Market Revenue Million Forecast, by Country 2019 & 2032
- Table 118: Global Vitamin E Market Volume K Tons Forecast, by Country 2019 & 2032
- Table 119: Brazil Vitamin E Market Revenue (Million) Forecast, by Application 2019 & 2032
- Table 120: Brazil Vitamin E Market Volume (K Tons) Forecast, by Application 2019 & 2032
- Table 121: Argentina Vitamin E Market Revenue (Million) Forecast, by Application 2019 & 2032
- Table 122: Argentina Vitamin E Market Volume (K Tons) Forecast, by Application 2019 & 2032
- Table 123: Rest of South America Vitamin E Market Revenue (Million) Forecast, by Application 2019 & 2032
- Table 124: Rest of South America Vitamin E Market Volume (K Tons) Forecast, by Application 2019 & 2032
- Table 125: Global Vitamin E Market Revenue Million Forecast, by Product Type 2019 & 2032
- Table 126: Global Vitamin E Market Volume K Tons Forecast, by Product Type 2019 & 2032
- Table 127: Global Vitamin E Market Revenue Million Forecast, by Application 2019 & 2032
- Table 128: Global Vitamin E Market Volume K Tons Forecast, by Application 2019 & 2032
- Table 129: Global Vitamin E Market Revenue Million Forecast, by Country 2019 & 2032
- Table 130: Global Vitamin E Market Volume K Tons Forecast, by Country 2019 & 2032
- Table 131: South Africa Vitamin E Market Revenue (Million) Forecast, by Application 2019 & 2032
- Table 132: South Africa Vitamin E Market Volume (K Tons) Forecast, by Application 2019 & 2032
- Table 133: Saudi Arabia Vitamin E Market Revenue (Million) Forecast, by Application 2019 & 2032
- Table 134: Saudi Arabia Vitamin E Market Volume (K Tons) Forecast, by Application 2019 & 2032
- Table 135: Rest of Middle East and Africa Vitamin E Market Revenue (Million) Forecast, by Application 2019 & 2032
- Table 136: Rest of Middle East and Africa Vitamin E Market Volume (K Tons) Forecast, by Application 2019 & 2032
Frequently Asked Questions
1. What is the projected Compound Annual Growth Rate (CAGR) of the Vitamin E Market?
The projected CAGR is approximately 4.01%.
2. Which companies are prominent players in the Vitamin E Market?
Key companies in the market include Prinova Group LLC, Merck KGaA, Orah Nutrichem, Archer Daniels Midland Company, BASF SE, Aryan International, Koninklijke DSM NV, The Bountiful Company*List Not Exhaustive, Jilin Beisha Pharmaceutical Co Ltd, BTSA Biotecnologías Aplicadas SL.
3. What are the main segments of the Vitamin E Market?
The market segments include Product Type, Application.
4. Can you provide details about the market size?
The market size is estimated to be USD 3924.44 Million as of 2022.
5. What are some drivers contributing to market growth?
Awareness of Health Benefits Associated with Tocotrienol; Escalating Demand for Anti-Aging Products Containing Tocotrienol.
6. What are the notable trends driving market growth?
Increasing Demand for Vitamin E in Various Applications.
7. Are there any restraints impacting market growth?
Availability of Substitutes.
8. Can you provide examples of recent developments in the market?
December 2021: The Kensing company announced its partnership with Azelis for a better and more feasible distribution of vegetable oils, vitamins, and personal care products in Europe and the Middle East and Africa. Azelis has a strong distribution network across these regions in the B2B segment. The company mainly aims to distribute its mainstream products Covi-ox, Covitol, Copherol, and Generol.
9. What pricing options are available for accessing the report?
Pricing options include single-user, multi-user, and enterprise licenses priced at USD 4750, USD 5250, and USD 8750 respectively.
10. Is the market size provided in terms of value or volume?
The market size is provided in terms of value, measured in Million and volume, measured in K Tons.
11. Are there any specific market keywords associated with the report?
Yes, the market keyword associated with the report is "Vitamin E Market," which aids in identifying and referencing the specific market segment covered.
12. How do I determine which pricing option suits my needs best?
The pricing options vary based on user requirements and access needs. Individual users may opt for single-user licenses, while businesses requiring broader access may choose multi-user or enterprise licenses for cost-effective access to the report.
13. Are there any additional resources or data provided in the Vitamin E Market report?
While the report offers comprehensive insights, it's advisable to review the specific contents or supplementary materials provided to ascertain if additional resources or data are available.
14. How can I stay updated on further developments or reports in the Vitamin E Market?
To stay informed about further developments, trends, and reports in the Vitamin E Market, consider subscribing to industry newsletters, following relevant companies and organizations, or regularly checking reputable industry news sources and publications.
Methodology
Step 1 - Identification of Relevant Samples Size from Population Database


Step 2 - Approaches for Defining Global Market Size (Value, Volume* & Price*)

Note*: In applicable scenarios
Step 3 - Data Sources
Primary Research
- Web Analytics
- Survey Reports
- Research Institute
- Latest Research Reports
- Opinion Leaders
Secondary Research
- Annual Reports
- White Paper
- Latest Press Release
- Industry Association
- Paid Database
- Investor Presentations

Step 4 - Data Triangulation
Involves using different sources of information in order to increase the validity of a study
These sources are likely to be stakeholders in a program - participants, other researchers, program staff, other community members, and so on.
Then we put all data in single framework & apply various statistical tools to find out the dynamic on the market.
During the analysis stage, feedback from the stakeholder groups would be compared to determine areas of agreement as well as areas of divergence


