
Key Insights
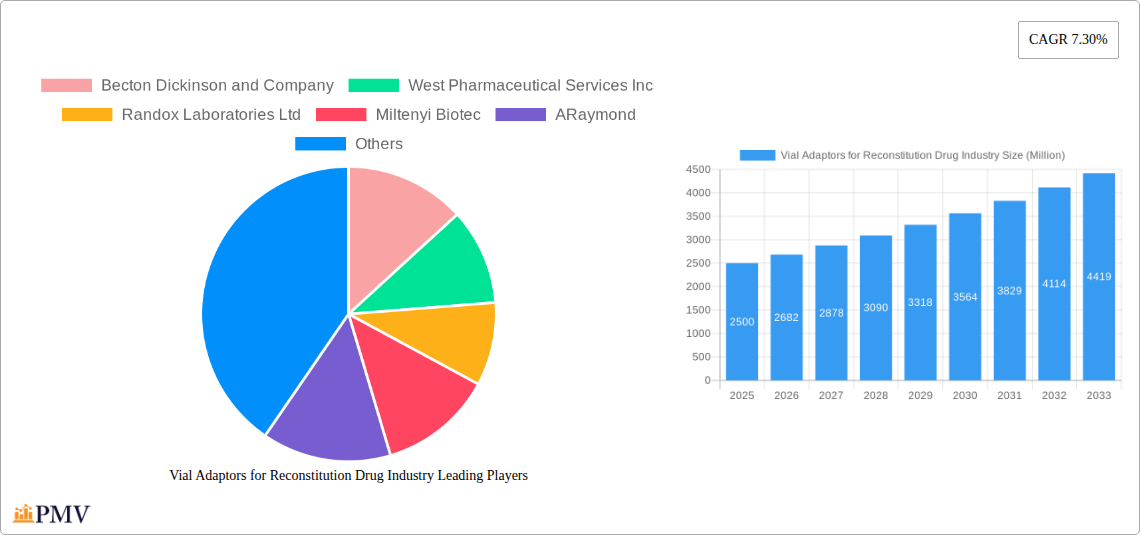
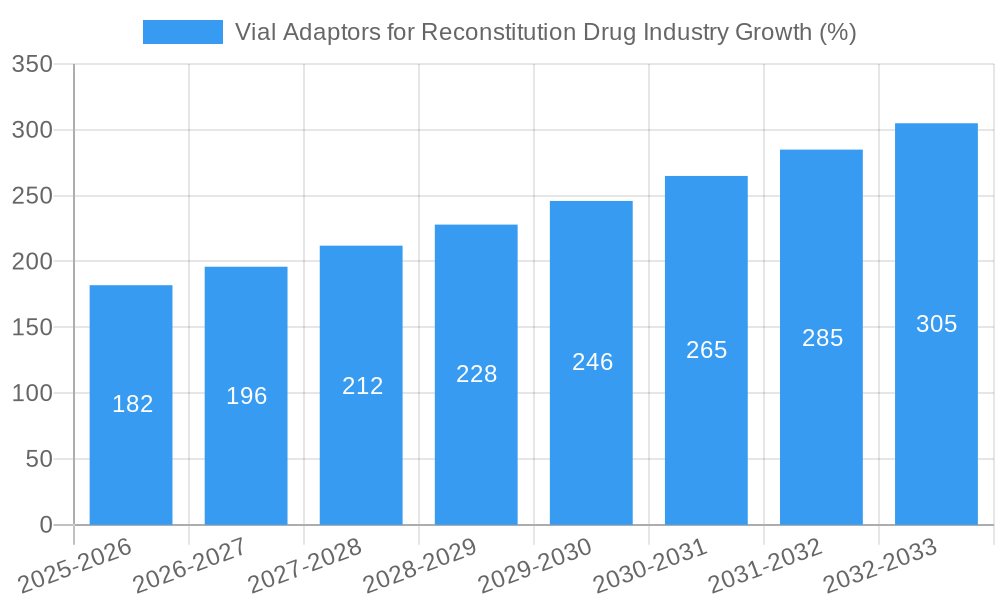
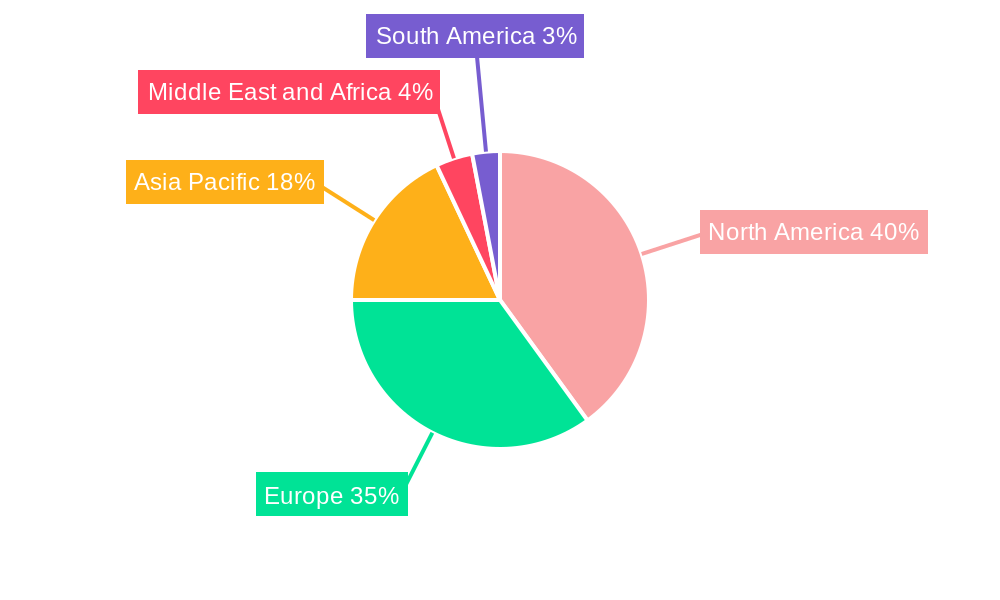
The global vial adaptors for reconstitution drug market is experiencing robust growth, driven by the increasing demand for injectable drugs and the rising prevalence of chronic diseases requiring reconstitution. The market, valued at approximately $2.5 billion in 2025, is projected to exhibit a Compound Annual Growth Rate (CAGR) of 7.3% from 2025 to 2033, reaching an estimated $4.2 billion by 2033. This growth is fueled by several factors, including the increasing adoption of pre-filled syringes and the development of more sophisticated drug delivery systems demanding specialized adaptors. The market is segmented by material (polycarbonate, silicon, polyethylene, and others), reflecting the diverse material properties needed for compatibility with various drug formulations and sterility requirements. Therapeutic areas such as autoimmune diseases, infectious diseases, and metabolic conditions are significant drivers, given the high volume of injectable medications used in their treatment. Geographic distribution shows a concentration of market share in North America and Europe, due to established healthcare infrastructure and higher drug consumption rates. However, Asia-Pacific is expected to witness the fastest growth, propelled by expanding healthcare access and a rising middle class with increased disposable income for healthcare spending. Leading players like Becton Dickinson, West Pharmaceutical Services, and others, are investing significantly in R&D and strategic partnerships to further enhance product innovation and market penetration.
Continued growth within the vial adaptors market hinges on several factors. The increasing focus on improving patient safety and reducing medication errors through user-friendly adaptors plays a crucial role. Moreover, regulatory changes promoting the use of sterile and efficient drug delivery systems will continue to boost demand. However, potential restraints include price sensitivity in certain emerging markets and the potential for supply chain disruptions. The ongoing innovation in materials and designs, coupled with the growing trend of personalized medicine, will shape the future trajectory of the vial adaptors market, leading to further specialization and differentiation of products in the years to come. Further analysis suggests the market's evolution towards single-use adaptors designed for improved hygiene and reduced cross-contamination risk, solidifying its importance in the pharmaceutical landscape.
Vial Adaptors for Reconstitution Drug Industry: A Comprehensive Market Report (2019-2033)
This comprehensive report provides a detailed analysis of the global Vial Adaptors for Reconstitution Drug Industry market, offering invaluable insights for stakeholders across the pharmaceutical and life sciences sectors. The study period spans from 2019 to 2033, with 2025 serving as the base and estimated year. The report projects market trends until 2033, offering a robust forecast for informed decision-making. The report encompasses a market valued at $XX Million in 2025, expected to reach $XX Million by 2033, exhibiting a CAGR of XX%.
Vial Adaptors for Reconstitution Drug Industry Market Structure & Competitive Dynamics
The Vial Adaptors for Reconstitution Drug Industry is characterized by a moderately concentrated market structure. Key players such as Becton Dickinson and Company, West Pharmaceutical Services Inc, Randox Laboratories Ltd, Miltenyi Biotec, ARaymond, Stevanato Group, Sartorius AG, Baxter International Inc, B Braun SE, Thermo Fisher Scientific, Simplivia, and Agilent Technologies hold significant market share, driving innovation and shaping competitive dynamics. Market share data for 2025 indicates that the top 5 players collectively hold approximately XX% of the market, while the remaining players share the remaining percentage.
The industry witnesses frequent M&A activity, with deals primarily focused on expanding product portfolios, strengthening geographical presence, and acquiring specialized technologies. For instance, the total value of M&A deals in the sector between 2019 and 2024 was approximately $XX Million. Innovation is a crucial aspect of competition, with companies continuously developing novel vial adaptors to enhance usability, sterility, and compatibility with various drug formulations. Regulatory frameworks, primarily overseen by agencies like the FDA and EMA, heavily influence product development and market entry. The industry observes evolving end-user trends towards automation and single-use systems, which impacts the demand for specific types of vial adaptors. Product substitutes, such as pre-filled syringes, pose a competitive challenge, though the demand for vial adaptors remains strong due to their cost-effectiveness and adaptability to various reconstitution needs.
Vial Adaptors for Reconstitution Drug Industry Industry Trends & Insights
The global Vial Adaptors for Reconstitution Drug Industry market exhibits substantial growth, fueled by factors such as the rising prevalence of chronic diseases necessitating injectable therapies, increasing demand for ready-to-use injectables, and the growing adoption of advanced drug delivery systems. The market is witnessing a shift toward automation and single-use technologies to improve efficiency and reduce contamination risks in the reconstitution process. This trend contributes significantly to the overall market expansion. Technological advancements in material science are leading to the development of more durable, biocompatible, and leak-proof vial adaptors. This drives product innovation and fuels market growth. Consumer preferences are increasingly focused on user-friendly designs, improved sterility, and reduced risk of medication errors. These aspects influence product development strategies. Competitive dynamics are marked by ongoing innovation, strategic partnerships, and M&A activities. Companies are investing heavily in R&D to develop novel designs, materials, and functionalities in vial adaptors. The market is also characterized by increasing regional variations in demand, driven by factors such as healthcare infrastructure, regulatory landscape, and disease prevalence. This necessitates a region-specific analysis to better grasp the market dynamics.
Dominant Markets & Segments in Vial Adaptors for Reconstitution Drug Industry
The North American region dominates the global Vial Adaptors for Reconstitution Drug Industry market, driven by factors such as high healthcare expenditure, advanced healthcare infrastructure, and a substantial pipeline of novel drug formulations. Europe holds the second-largest market share and contributes to considerable market growth. Asia Pacific is exhibiting a high growth trajectory, fueled by rising healthcare spending, growing awareness about chronic diseases, and increasing adoption of advanced medical technologies in several economies.
Material Segmentation: Polycarbonate vial adaptors hold the largest market share due to their cost-effectiveness and robust nature. Silicon adaptors command a significant portion due to their biocompatibility. Polyethylene adaptors find specific niche applications. Other materials, including specialized polymers, are gaining traction due to their specific functionalities.
Therapeutic Area Segmentation: Infectious diseases represent a substantial segment due to the widespread need for injectable antibiotics and antiviral medications. Autoimmune diseases and metabolic conditions also drive significant demand for vial adaptors owing to the prevalent need for injectable therapies for managing these conditions.
Vial Adaptors for Reconstitution Drug Industry Product Innovations
Recent innovations in vial adaptors include the development of single-use, pre-assembled adaptors that minimize the risk of contamination during reconstitution. Integrated safety features, such as needle-shield mechanisms, further enhance safety. The incorporation of advanced materials results in improved biocompatibility and reduced leaching effects. Technological trends include the integration of sensors and smart technologies for real-time monitoring and tracking of drug reconstitution. The market fit of these innovations is strong, driven by the rising demand for safe, efficient, and user-friendly reconstitution systems.
Report Segmentation & Scope
This report provides a detailed segmentation of the Vial Adaptors for Reconstitution Drug Industry market based on material (Polycarbonate, Silicon, Polyethylene, Other Materials) and therapeutic area (Autoimmune Diseases, Infectious Diseases, Metabolic Conditions, Other Therapeutic Areas). Each segment is analyzed in terms of market size, growth projections, and competitive dynamics. The report projects robust growth across all segments, with particular emphasis on the continued growth of the Polycarbonate and Silicon material segments, driven by their cost-effectiveness and biocompatibility. The Infectious Diseases therapeutic area segment is expected to maintain its dominant position owing to the continuous development of new injectable therapies.
Key Drivers of Vial Adaptors for Reconstitution Drug Industry Growth
The growth of the Vial Adaptors for Reconstitution Drug Industry is primarily driven by the increasing prevalence of chronic diseases, the growing demand for ready-to-use injectable drugs, and advancements in drug delivery systems. Technological advancements in material science and automation are also key drivers. The rising adoption of single-use systems in pharmaceutical manufacturing contributes significantly to this growth. Favorable regulatory frameworks in key regions further stimulate market expansion.
Challenges in the Vial Adaptors for Reconstitution Drug Industry Sector
The industry faces challenges such as stringent regulatory requirements for medical devices, which necessitate significant investment in compliance. Supply chain disruptions and price fluctuations of raw materials can impact profitability. The intense competition from established players and emerging market entrants presents a continuous challenge. Furthermore, the growing popularity of pre-filled syringes creates competitive pressure, albeit a niche pressure. These factors collectively influence market dynamics and shape the competitive landscape.
Leading Players in the Vial Adaptors for Reconstitution Drug Industry Market
- Becton Dickinson and Company
- West Pharmaceutical Services Inc
- Randox Laboratories Ltd
- Miltenyi Biotec
- ARaymond
- Stevanato Group
- Sartorius AG
- Baxter International Inc
- B Braun SE
- Thermo Fisher Scientific
- Simplivia
- Agilent Technologies
Key Developments in Vial Adaptors for Reconstitution Drug Industry Sector
- Dec 2022: Sartorius and BICO Group announced a comprehensive technology, sales, and marketing cooperation, expected to enhance the development and market reach of advanced vial adaptors.
- Dec 2021: Miltenyi Biotec expanded its production capacity with a new plant in Germany, signifying increased production capacity and market presence for vial adaptors.
Strategic Vial Adaptors for Reconstitution Drug Industry Market Outlook
The Vial Adaptors for Reconstitution Drug Industry is poised for continued growth, driven by advancements in drug delivery technologies, the increasing prevalence of chronic diseases, and the rising demand for ready-to-use injectable medications. Strategic opportunities exist in developing innovative, cost-effective, and user-friendly vial adaptors that address the evolving needs of the pharmaceutical industry. Companies focusing on sustainable, biocompatible materials and incorporating advanced automation and safety features are likely to gain a competitive advantage in this rapidly expanding market.
Vial Adaptors for Reconstitution Drug Industry Segmentation
-
1. Material
- 1.1. Polycarbonate
- 1.2. Silicon
- 1.3. Polyethylene
- 1.4. Other Materials
-
2. Therapeutic Area
- 2.1. Autoimmune Diseases
- 2.2. Infectious Diseases
- 2.3. Metabolic Conditions
- 2.4. Other Therapeutic Areas
Vial Adaptors for Reconstitution Drug Industry Segmentation By Geography
-
1. North America
- 1.1. United States
- 1.2. Canada
- 1.3. Mexico
-
2. Europe
- 2.1. Germany
- 2.2. United Kingdom
- 2.3. France
- 2.4. Italy
- 2.5. Spain
- 2.6. Rest of Europe
-
3. Asia Pacific
- 3.1. China
- 3.2. Japan
- 3.3. India
- 3.4. Australia
- 3.5. South Korea
- 3.6. Rest of Asia Pacific
-
4. Middle East and Africa
- 4.1. GCC
- 4.2. South Africa
- 4.3. Rest of Middle East and Africa
-
5. South America
- 5.1. Brazil
- 5.2. Argentina
- 5.3. Rest of South America
Vial Adaptors for Reconstitution Drug Industry REPORT HIGHLIGHTS
| Aspects | Details |
|---|---|
| Study Period | 2019-2033 |
| Base Year | 2024 |
| Estimated Year | 2025 |
| Forecast Period | 2025-2033 |
| Historical Period | 2019-2024 |
| Growth Rate | CAGR of 7.30% from 2019-2033 |
| Segmentation |
|
Table of Contents
- 1. Introduction
- 1.1. Research Scope
- 1.2. Market Segmentation
- 1.3. Research Methodology
- 1.4. Definitions and Assumptions
- 2. Executive Summary
- 2.1. Introduction
- 3. Market Dynamics
- 3.1. Introduction
- 3.2. Market Drivers
- 3.2.1. Increasing Prevalence of Infectious Diseases; Rising Geriatric Population; Increasing Awareness of the Advantages of the Vial Adaptors
- 3.3. Market Restrains
- 3.3.1. Availability of Substitutes
- 3.4. Market Trends
- 3.4.1. Infectious Diseases Segment is Expected to Hold a Significant Market Share Over the Forecast Period
- 4. Market Factor Analysis
- 4.1. Porters Five Forces
- 4.2. Supply/Value Chain
- 4.3. PESTEL analysis
- 4.4. Market Entropy
- 4.5. Patent/Trademark Analysis
- 5. Global Vial Adaptors for Reconstitution Drug Industry Analysis, Insights and Forecast, 2019-2031
- 5.1. Market Analysis, Insights and Forecast - by Material
- 5.1.1. Polycarbonate
- 5.1.2. Silicon
- 5.1.3. Polyethylene
- 5.1.4. Other Materials
- 5.2. Market Analysis, Insights and Forecast - by Therapeutic Area
- 5.2.1. Autoimmune Diseases
- 5.2.2. Infectious Diseases
- 5.2.3. Metabolic Conditions
- 5.2.4. Other Therapeutic Areas
- 5.3. Market Analysis, Insights and Forecast - by Region
- 5.3.1. North America
- 5.3.2. Europe
- 5.3.3. Asia Pacific
- 5.3.4. Middle East and Africa
- 5.3.5. South America
- 5.1. Market Analysis, Insights and Forecast - by Material
- 6. North America Vial Adaptors for Reconstitution Drug Industry Analysis, Insights and Forecast, 2019-2031
- 6.1. Market Analysis, Insights and Forecast - by Material
- 6.1.1. Polycarbonate
- 6.1.2. Silicon
- 6.1.3. Polyethylene
- 6.1.4. Other Materials
- 6.2. Market Analysis, Insights and Forecast - by Therapeutic Area
- 6.2.1. Autoimmune Diseases
- 6.2.2. Infectious Diseases
- 6.2.3. Metabolic Conditions
- 6.2.4. Other Therapeutic Areas
- 6.1. Market Analysis, Insights and Forecast - by Material
- 7. Europe Vial Adaptors for Reconstitution Drug Industry Analysis, Insights and Forecast, 2019-2031
- 7.1. Market Analysis, Insights and Forecast - by Material
- 7.1.1. Polycarbonate
- 7.1.2. Silicon
- 7.1.3. Polyethylene
- 7.1.4. Other Materials
- 7.2. Market Analysis, Insights and Forecast - by Therapeutic Area
- 7.2.1. Autoimmune Diseases
- 7.2.2. Infectious Diseases
- 7.2.3. Metabolic Conditions
- 7.2.4. Other Therapeutic Areas
- 7.1. Market Analysis, Insights and Forecast - by Material
- 8. Asia Pacific Vial Adaptors for Reconstitution Drug Industry Analysis, Insights and Forecast, 2019-2031
- 8.1. Market Analysis, Insights and Forecast - by Material
- 8.1.1. Polycarbonate
- 8.1.2. Silicon
- 8.1.3. Polyethylene
- 8.1.4. Other Materials
- 8.2. Market Analysis, Insights and Forecast - by Therapeutic Area
- 8.2.1. Autoimmune Diseases
- 8.2.2. Infectious Diseases
- 8.2.3. Metabolic Conditions
- 8.2.4. Other Therapeutic Areas
- 8.1. Market Analysis, Insights and Forecast - by Material
- 9. Middle East and Africa Vial Adaptors for Reconstitution Drug Industry Analysis, Insights and Forecast, 2019-2031
- 9.1. Market Analysis, Insights and Forecast - by Material
- 9.1.1. Polycarbonate
- 9.1.2. Silicon
- 9.1.3. Polyethylene
- 9.1.4. Other Materials
- 9.2. Market Analysis, Insights and Forecast - by Therapeutic Area
- 9.2.1. Autoimmune Diseases
- 9.2.2. Infectious Diseases
- 9.2.3. Metabolic Conditions
- 9.2.4. Other Therapeutic Areas
- 9.1. Market Analysis, Insights and Forecast - by Material
- 10. South America Vial Adaptors for Reconstitution Drug Industry Analysis, Insights and Forecast, 2019-2031
- 10.1. Market Analysis, Insights and Forecast - by Material
- 10.1.1. Polycarbonate
- 10.1.2. Silicon
- 10.1.3. Polyethylene
- 10.1.4. Other Materials
- 10.2. Market Analysis, Insights and Forecast - by Therapeutic Area
- 10.2.1. Autoimmune Diseases
- 10.2.2. Infectious Diseases
- 10.2.3. Metabolic Conditions
- 10.2.4. Other Therapeutic Areas
- 10.1. Market Analysis, Insights and Forecast - by Material
- 11. North America Vial Adaptors for Reconstitution Drug Industry Analysis, Insights and Forecast, 2019-2031
- 11.1. Market Analysis, Insights and Forecast - By Country/Sub-region
- 11.1.1 United States
- 11.1.2 Canada
- 11.1.3 Mexico
- 12. Europe Vial Adaptors for Reconstitution Drug Industry Analysis, Insights and Forecast, 2019-2031
- 12.1. Market Analysis, Insights and Forecast - By Country/Sub-region
- 12.1.1 Germany
- 12.1.2 United Kingdom
- 12.1.3 France
- 12.1.4 Italy
- 12.1.5 Spain
- 12.1.6 Rest of Europe
- 13. Asia Pacific Vial Adaptors for Reconstitution Drug Industry Analysis, Insights and Forecast, 2019-2031
- 13.1. Market Analysis, Insights and Forecast - By Country/Sub-region
- 13.1.1 China
- 13.1.2 Japan
- 13.1.3 India
- 13.1.4 Australia
- 13.1.5 South Korea
- 13.1.6 Rest of Asia Pacific
- 14. Middle East and Africa Vial Adaptors for Reconstitution Drug Industry Analysis, Insights and Forecast, 2019-2031
- 14.1. Market Analysis, Insights and Forecast - By Country/Sub-region
- 14.1.1 GCC
- 14.1.2 South Africa
- 14.1.3 Rest of Middle East and Africa
- 15. South America Vial Adaptors for Reconstitution Drug Industry Analysis, Insights and Forecast, 2019-2031
- 15.1. Market Analysis, Insights and Forecast - By Country/Sub-region
- 15.1.1 Brazil
- 15.1.2 Argentina
- 15.1.3 Rest of South America
- 16. Competitive Analysis
- 16.1. Global Market Share Analysis 2024
- 16.2. Company Profiles
- 16.2.1 Becton Dickinson and Company
- 16.2.1.1. Overview
- 16.2.1.2. Products
- 16.2.1.3. SWOT Analysis
- 16.2.1.4. Recent Developments
- 16.2.1.5. Financials (Based on Availability)
- 16.2.2 West Pharmaceutical Services Inc
- 16.2.2.1. Overview
- 16.2.2.2. Products
- 16.2.2.3. SWOT Analysis
- 16.2.2.4. Recent Developments
- 16.2.2.5. Financials (Based on Availability)
- 16.2.3 Randox Laboratories Ltd
- 16.2.3.1. Overview
- 16.2.3.2. Products
- 16.2.3.3. SWOT Analysis
- 16.2.3.4. Recent Developments
- 16.2.3.5. Financials (Based on Availability)
- 16.2.4 Miltenyi Biotec
- 16.2.4.1. Overview
- 16.2.4.2. Products
- 16.2.4.3. SWOT Analysis
- 16.2.4.4. Recent Developments
- 16.2.4.5. Financials (Based on Availability)
- 16.2.5 ARaymond
- 16.2.5.1. Overview
- 16.2.5.2. Products
- 16.2.5.3. SWOT Analysis
- 16.2.5.4. Recent Developments
- 16.2.5.5. Financials (Based on Availability)
- 16.2.6 Stevanato Group
- 16.2.6.1. Overview
- 16.2.6.2. Products
- 16.2.6.3. SWOT Analysis
- 16.2.6.4. Recent Developments
- 16.2.6.5. Financials (Based on Availability)
- 16.2.7 Sartorious AG
- 16.2.7.1. Overview
- 16.2.7.2. Products
- 16.2.7.3. SWOT Analysis
- 16.2.7.4. Recent Developments
- 16.2.7.5. Financials (Based on Availability)
- 16.2.8 Baxter International Inc
- 16.2.8.1. Overview
- 16.2.8.2. Products
- 16.2.8.3. SWOT Analysis
- 16.2.8.4. Recent Developments
- 16.2.8.5. Financials (Based on Availability)
- 16.2.9 B Braun SE
- 16.2.9.1. Overview
- 16.2.9.2. Products
- 16.2.9.3. SWOT Analysis
- 16.2.9.4. Recent Developments
- 16.2.9.5. Financials (Based on Availability)
- 16.2.10 Thermo Fisher Scientific
- 16.2.10.1. Overview
- 16.2.10.2. Products
- 16.2.10.3. SWOT Analysis
- 16.2.10.4. Recent Developments
- 16.2.10.5. Financials (Based on Availability)
- 16.2.11 Simplivia
- 16.2.11.1. Overview
- 16.2.11.2. Products
- 16.2.11.3. SWOT Analysis
- 16.2.11.4. Recent Developments
- 16.2.11.5. Financials (Based on Availability)
- 16.2.12 Agilent Technologies
- 16.2.12.1. Overview
- 16.2.12.2. Products
- 16.2.12.3. SWOT Analysis
- 16.2.12.4. Recent Developments
- 16.2.12.5. Financials (Based on Availability)
- 16.2.1 Becton Dickinson and Company
List of Figures
- Figure 1: Global Vial Adaptors for Reconstitution Drug Industry Revenue Breakdown (Million, %) by Region 2024 & 2032
- Figure 2: Global Vial Adaptors for Reconstitution Drug Industry Volume Breakdown (K Unit, %) by Region 2024 & 2032
- Figure 3: North America Vial Adaptors for Reconstitution Drug Industry Revenue (Million), by Country 2024 & 2032
- Figure 4: North America Vial Adaptors for Reconstitution Drug Industry Volume (K Unit), by Country 2024 & 2032
- Figure 5: North America Vial Adaptors for Reconstitution Drug Industry Revenue Share (%), by Country 2024 & 2032
- Figure 6: North America Vial Adaptors for Reconstitution Drug Industry Volume Share (%), by Country 2024 & 2032
- Figure 7: Europe Vial Adaptors for Reconstitution Drug Industry Revenue (Million), by Country 2024 & 2032
- Figure 8: Europe Vial Adaptors for Reconstitution Drug Industry Volume (K Unit), by Country 2024 & 2032
- Figure 9: Europe Vial Adaptors for Reconstitution Drug Industry Revenue Share (%), by Country 2024 & 2032
- Figure 10: Europe Vial Adaptors for Reconstitution Drug Industry Volume Share (%), by Country 2024 & 2032
- Figure 11: Asia Pacific Vial Adaptors for Reconstitution Drug Industry Revenue (Million), by Country 2024 & 2032
- Figure 12: Asia Pacific Vial Adaptors for Reconstitution Drug Industry Volume (K Unit), by Country 2024 & 2032
- Figure 13: Asia Pacific Vial Adaptors for Reconstitution Drug Industry Revenue Share (%), by Country 2024 & 2032
- Figure 14: Asia Pacific Vial Adaptors for Reconstitution Drug Industry Volume Share (%), by Country 2024 & 2032
- Figure 15: Middle East and Africa Vial Adaptors for Reconstitution Drug Industry Revenue (Million), by Country 2024 & 2032
- Figure 16: Middle East and Africa Vial Adaptors for Reconstitution Drug Industry Volume (K Unit), by Country 2024 & 2032
- Figure 17: Middle East and Africa Vial Adaptors for Reconstitution Drug Industry Revenue Share (%), by Country 2024 & 2032
- Figure 18: Middle East and Africa Vial Adaptors for Reconstitution Drug Industry Volume Share (%), by Country 2024 & 2032
- Figure 19: South America Vial Adaptors for Reconstitution Drug Industry Revenue (Million), by Country 2024 & 2032
- Figure 20: South America Vial Adaptors for Reconstitution Drug Industry Volume (K Unit), by Country 2024 & 2032
- Figure 21: South America Vial Adaptors for Reconstitution Drug Industry Revenue Share (%), by Country 2024 & 2032
- Figure 22: South America Vial Adaptors for Reconstitution Drug Industry Volume Share (%), by Country 2024 & 2032
- Figure 23: North America Vial Adaptors for Reconstitution Drug Industry Revenue (Million), by Material 2024 & 2032
- Figure 24: North America Vial Adaptors for Reconstitution Drug Industry Volume (K Unit), by Material 2024 & 2032
- Figure 25: North America Vial Adaptors for Reconstitution Drug Industry Revenue Share (%), by Material 2024 & 2032
- Figure 26: North America Vial Adaptors for Reconstitution Drug Industry Volume Share (%), by Material 2024 & 2032
- Figure 27: North America Vial Adaptors for Reconstitution Drug Industry Revenue (Million), by Therapeutic Area 2024 & 2032
- Figure 28: North America Vial Adaptors for Reconstitution Drug Industry Volume (K Unit), by Therapeutic Area 2024 & 2032
- Figure 29: North America Vial Adaptors for Reconstitution Drug Industry Revenue Share (%), by Therapeutic Area 2024 & 2032
- Figure 30: North America Vial Adaptors for Reconstitution Drug Industry Volume Share (%), by Therapeutic Area 2024 & 2032
- Figure 31: North America Vial Adaptors for Reconstitution Drug Industry Revenue (Million), by Country 2024 & 2032
- Figure 32: North America Vial Adaptors for Reconstitution Drug Industry Volume (K Unit), by Country 2024 & 2032
- Figure 33: North America Vial Adaptors for Reconstitution Drug Industry Revenue Share (%), by Country 2024 & 2032
- Figure 34: North America Vial Adaptors for Reconstitution Drug Industry Volume Share (%), by Country 2024 & 2032
- Figure 35: Europe Vial Adaptors for Reconstitution Drug Industry Revenue (Million), by Material 2024 & 2032
- Figure 36: Europe Vial Adaptors for Reconstitution Drug Industry Volume (K Unit), by Material 2024 & 2032
- Figure 37: Europe Vial Adaptors for Reconstitution Drug Industry Revenue Share (%), by Material 2024 & 2032
- Figure 38: Europe Vial Adaptors for Reconstitution Drug Industry Volume Share (%), by Material 2024 & 2032
- Figure 39: Europe Vial Adaptors for Reconstitution Drug Industry Revenue (Million), by Therapeutic Area 2024 & 2032
- Figure 40: Europe Vial Adaptors for Reconstitution Drug Industry Volume (K Unit), by Therapeutic Area 2024 & 2032
- Figure 41: Europe Vial Adaptors for Reconstitution Drug Industry Revenue Share (%), by Therapeutic Area 2024 & 2032
- Figure 42: Europe Vial Adaptors for Reconstitution Drug Industry Volume Share (%), by Therapeutic Area 2024 & 2032
- Figure 43: Europe Vial Adaptors for Reconstitution Drug Industry Revenue (Million), by Country 2024 & 2032
- Figure 44: Europe Vial Adaptors for Reconstitution Drug Industry Volume (K Unit), by Country 2024 & 2032
- Figure 45: Europe Vial Adaptors for Reconstitution Drug Industry Revenue Share (%), by Country 2024 & 2032
- Figure 46: Europe Vial Adaptors for Reconstitution Drug Industry Volume Share (%), by Country 2024 & 2032
- Figure 47: Asia Pacific Vial Adaptors for Reconstitution Drug Industry Revenue (Million), by Material 2024 & 2032
- Figure 48: Asia Pacific Vial Adaptors for Reconstitution Drug Industry Volume (K Unit), by Material 2024 & 2032
- Figure 49: Asia Pacific Vial Adaptors for Reconstitution Drug Industry Revenue Share (%), by Material 2024 & 2032
- Figure 50: Asia Pacific Vial Adaptors for Reconstitution Drug Industry Volume Share (%), by Material 2024 & 2032
- Figure 51: Asia Pacific Vial Adaptors for Reconstitution Drug Industry Revenue (Million), by Therapeutic Area 2024 & 2032
- Figure 52: Asia Pacific Vial Adaptors for Reconstitution Drug Industry Volume (K Unit), by Therapeutic Area 2024 & 2032
- Figure 53: Asia Pacific Vial Adaptors for Reconstitution Drug Industry Revenue Share (%), by Therapeutic Area 2024 & 2032
- Figure 54: Asia Pacific Vial Adaptors for Reconstitution Drug Industry Volume Share (%), by Therapeutic Area 2024 & 2032
- Figure 55: Asia Pacific Vial Adaptors for Reconstitution Drug Industry Revenue (Million), by Country 2024 & 2032
- Figure 56: Asia Pacific Vial Adaptors for Reconstitution Drug Industry Volume (K Unit), by Country 2024 & 2032
- Figure 57: Asia Pacific Vial Adaptors for Reconstitution Drug Industry Revenue Share (%), by Country 2024 & 2032
- Figure 58: Asia Pacific Vial Adaptors for Reconstitution Drug Industry Volume Share (%), by Country 2024 & 2032
- Figure 59: Middle East and Africa Vial Adaptors for Reconstitution Drug Industry Revenue (Million), by Material 2024 & 2032
- Figure 60: Middle East and Africa Vial Adaptors for Reconstitution Drug Industry Volume (K Unit), by Material 2024 & 2032
- Figure 61: Middle East and Africa Vial Adaptors for Reconstitution Drug Industry Revenue Share (%), by Material 2024 & 2032
- Figure 62: Middle East and Africa Vial Adaptors for Reconstitution Drug Industry Volume Share (%), by Material 2024 & 2032
- Figure 63: Middle East and Africa Vial Adaptors for Reconstitution Drug Industry Revenue (Million), by Therapeutic Area 2024 & 2032
- Figure 64: Middle East and Africa Vial Adaptors for Reconstitution Drug Industry Volume (K Unit), by Therapeutic Area 2024 & 2032
- Figure 65: Middle East and Africa Vial Adaptors for Reconstitution Drug Industry Revenue Share (%), by Therapeutic Area 2024 & 2032
- Figure 66: Middle East and Africa Vial Adaptors for Reconstitution Drug Industry Volume Share (%), by Therapeutic Area 2024 & 2032
- Figure 67: Middle East and Africa Vial Adaptors for Reconstitution Drug Industry Revenue (Million), by Country 2024 & 2032
- Figure 68: Middle East and Africa Vial Adaptors for Reconstitution Drug Industry Volume (K Unit), by Country 2024 & 2032
- Figure 69: Middle East and Africa Vial Adaptors for Reconstitution Drug Industry Revenue Share (%), by Country 2024 & 2032
- Figure 70: Middle East and Africa Vial Adaptors for Reconstitution Drug Industry Volume Share (%), by Country 2024 & 2032
- Figure 71: South America Vial Adaptors for Reconstitution Drug Industry Revenue (Million), by Material 2024 & 2032
- Figure 72: South America Vial Adaptors for Reconstitution Drug Industry Volume (K Unit), by Material 2024 & 2032
- Figure 73: South America Vial Adaptors for Reconstitution Drug Industry Revenue Share (%), by Material 2024 & 2032
- Figure 74: South America Vial Adaptors for Reconstitution Drug Industry Volume Share (%), by Material 2024 & 2032
- Figure 75: South America Vial Adaptors for Reconstitution Drug Industry Revenue (Million), by Therapeutic Area 2024 & 2032
- Figure 76: South America Vial Adaptors for Reconstitution Drug Industry Volume (K Unit), by Therapeutic Area 2024 & 2032
- Figure 77: South America Vial Adaptors for Reconstitution Drug Industry Revenue Share (%), by Therapeutic Area 2024 & 2032
- Figure 78: South America Vial Adaptors for Reconstitution Drug Industry Volume Share (%), by Therapeutic Area 2024 & 2032
- Figure 79: South America Vial Adaptors for Reconstitution Drug Industry Revenue (Million), by Country 2024 & 2032
- Figure 80: South America Vial Adaptors for Reconstitution Drug Industry Volume (K Unit), by Country 2024 & 2032
- Figure 81: South America Vial Adaptors for Reconstitution Drug Industry Revenue Share (%), by Country 2024 & 2032
- Figure 82: South America Vial Adaptors for Reconstitution Drug Industry Volume Share (%), by Country 2024 & 2032
List of Tables
- Table 1: Global Vial Adaptors for Reconstitution Drug Industry Revenue Million Forecast, by Region 2019 & 2032
- Table 2: Global Vial Adaptors for Reconstitution Drug Industry Volume K Unit Forecast, by Region 2019 & 2032
- Table 3: Global Vial Adaptors for Reconstitution Drug Industry Revenue Million Forecast, by Material 2019 & 2032
- Table 4: Global Vial Adaptors for Reconstitution Drug Industry Volume K Unit Forecast, by Material 2019 & 2032
- Table 5: Global Vial Adaptors for Reconstitution Drug Industry Revenue Million Forecast, by Therapeutic Area 2019 & 2032
- Table 6: Global Vial Adaptors for Reconstitution Drug Industry Volume K Unit Forecast, by Therapeutic Area 2019 & 2032
- Table 7: Global Vial Adaptors for Reconstitution Drug Industry Revenue Million Forecast, by Region 2019 & 2032
- Table 8: Global Vial Adaptors for Reconstitution Drug Industry Volume K Unit Forecast, by Region 2019 & 2032
- Table 9: Global Vial Adaptors for Reconstitution Drug Industry Revenue Million Forecast, by Country 2019 & 2032
- Table 10: Global Vial Adaptors for Reconstitution Drug Industry Volume K Unit Forecast, by Country 2019 & 2032
- Table 11: United States Vial Adaptors for Reconstitution Drug Industry Revenue (Million) Forecast, by Application 2019 & 2032
- Table 12: United States Vial Adaptors for Reconstitution Drug Industry Volume (K Unit) Forecast, by Application 2019 & 2032
- Table 13: Canada Vial Adaptors for Reconstitution Drug Industry Revenue (Million) Forecast, by Application 2019 & 2032
- Table 14: Canada Vial Adaptors for Reconstitution Drug Industry Volume (K Unit) Forecast, by Application 2019 & 2032
- Table 15: Mexico Vial Adaptors for Reconstitution Drug Industry Revenue (Million) Forecast, by Application 2019 & 2032
- Table 16: Mexico Vial Adaptors for Reconstitution Drug Industry Volume (K Unit) Forecast, by Application 2019 & 2032
- Table 17: Global Vial Adaptors for Reconstitution Drug Industry Revenue Million Forecast, by Country 2019 & 2032
- Table 18: Global Vial Adaptors for Reconstitution Drug Industry Volume K Unit Forecast, by Country 2019 & 2032
- Table 19: Germany Vial Adaptors for Reconstitution Drug Industry Revenue (Million) Forecast, by Application 2019 & 2032
- Table 20: Germany Vial Adaptors for Reconstitution Drug Industry Volume (K Unit) Forecast, by Application 2019 & 2032
- Table 21: United Kingdom Vial Adaptors for Reconstitution Drug Industry Revenue (Million) Forecast, by Application 2019 & 2032
- Table 22: United Kingdom Vial Adaptors for Reconstitution Drug Industry Volume (K Unit) Forecast, by Application 2019 & 2032
- Table 23: France Vial Adaptors for Reconstitution Drug Industry Revenue (Million) Forecast, by Application 2019 & 2032
- Table 24: France Vial Adaptors for Reconstitution Drug Industry Volume (K Unit) Forecast, by Application 2019 & 2032
- Table 25: Italy Vial Adaptors for Reconstitution Drug Industry Revenue (Million) Forecast, by Application 2019 & 2032
- Table 26: Italy Vial Adaptors for Reconstitution Drug Industry Volume (K Unit) Forecast, by Application 2019 & 2032
- Table 27: Spain Vial Adaptors for Reconstitution Drug Industry Revenue (Million) Forecast, by Application 2019 & 2032
- Table 28: Spain Vial Adaptors for Reconstitution Drug Industry Volume (K Unit) Forecast, by Application 2019 & 2032
- Table 29: Rest of Europe Vial Adaptors for Reconstitution Drug Industry Revenue (Million) Forecast, by Application 2019 & 2032
- Table 30: Rest of Europe Vial Adaptors for Reconstitution Drug Industry Volume (K Unit) Forecast, by Application 2019 & 2032
- Table 31: Global Vial Adaptors for Reconstitution Drug Industry Revenue Million Forecast, by Country 2019 & 2032
- Table 32: Global Vial Adaptors for Reconstitution Drug Industry Volume K Unit Forecast, by Country 2019 & 2032
- Table 33: China Vial Adaptors for Reconstitution Drug Industry Revenue (Million) Forecast, by Application 2019 & 2032
- Table 34: China Vial Adaptors for Reconstitution Drug Industry Volume (K Unit) Forecast, by Application 2019 & 2032
- Table 35: Japan Vial Adaptors for Reconstitution Drug Industry Revenue (Million) Forecast, by Application 2019 & 2032
- Table 36: Japan Vial Adaptors for Reconstitution Drug Industry Volume (K Unit) Forecast, by Application 2019 & 2032
- Table 37: India Vial Adaptors for Reconstitution Drug Industry Revenue (Million) Forecast, by Application 2019 & 2032
- Table 38: India Vial Adaptors for Reconstitution Drug Industry Volume (K Unit) Forecast, by Application 2019 & 2032
- Table 39: Australia Vial Adaptors for Reconstitution Drug Industry Revenue (Million) Forecast, by Application 2019 & 2032
- Table 40: Australia Vial Adaptors for Reconstitution Drug Industry Volume (K Unit) Forecast, by Application 2019 & 2032
- Table 41: South Korea Vial Adaptors for Reconstitution Drug Industry Revenue (Million) Forecast, by Application 2019 & 2032
- Table 42: South Korea Vial Adaptors for Reconstitution Drug Industry Volume (K Unit) Forecast, by Application 2019 & 2032
- Table 43: Rest of Asia Pacific Vial Adaptors for Reconstitution Drug Industry Revenue (Million) Forecast, by Application 2019 & 2032
- Table 44: Rest of Asia Pacific Vial Adaptors for Reconstitution Drug Industry Volume (K Unit) Forecast, by Application 2019 & 2032
- Table 45: Global Vial Adaptors for Reconstitution Drug Industry Revenue Million Forecast, by Country 2019 & 2032
- Table 46: Global Vial Adaptors for Reconstitution Drug Industry Volume K Unit Forecast, by Country 2019 & 2032
- Table 47: GCC Vial Adaptors for Reconstitution Drug Industry Revenue (Million) Forecast, by Application 2019 & 2032
- Table 48: GCC Vial Adaptors for Reconstitution Drug Industry Volume (K Unit) Forecast, by Application 2019 & 2032
- Table 49: South Africa Vial Adaptors for Reconstitution Drug Industry Revenue (Million) Forecast, by Application 2019 & 2032
- Table 50: South Africa Vial Adaptors for Reconstitution Drug Industry Volume (K Unit) Forecast, by Application 2019 & 2032
- Table 51: Rest of Middle East and Africa Vial Adaptors for Reconstitution Drug Industry Revenue (Million) Forecast, by Application 2019 & 2032
- Table 52: Rest of Middle East and Africa Vial Adaptors for Reconstitution Drug Industry Volume (K Unit) Forecast, by Application 2019 & 2032
- Table 53: Global Vial Adaptors for Reconstitution Drug Industry Revenue Million Forecast, by Country 2019 & 2032
- Table 54: Global Vial Adaptors for Reconstitution Drug Industry Volume K Unit Forecast, by Country 2019 & 2032
- Table 55: Brazil Vial Adaptors for Reconstitution Drug Industry Revenue (Million) Forecast, by Application 2019 & 2032
- Table 56: Brazil Vial Adaptors for Reconstitution Drug Industry Volume (K Unit) Forecast, by Application 2019 & 2032
- Table 57: Argentina Vial Adaptors for Reconstitution Drug Industry Revenue (Million) Forecast, by Application 2019 & 2032
- Table 58: Argentina Vial Adaptors for Reconstitution Drug Industry Volume (K Unit) Forecast, by Application 2019 & 2032
- Table 59: Rest of South America Vial Adaptors for Reconstitution Drug Industry Revenue (Million) Forecast, by Application 2019 & 2032
- Table 60: Rest of South America Vial Adaptors for Reconstitution Drug Industry Volume (K Unit) Forecast, by Application 2019 & 2032
- Table 61: Global Vial Adaptors for Reconstitution Drug Industry Revenue Million Forecast, by Material 2019 & 2032
- Table 62: Global Vial Adaptors for Reconstitution Drug Industry Volume K Unit Forecast, by Material 2019 & 2032
- Table 63: Global Vial Adaptors for Reconstitution Drug Industry Revenue Million Forecast, by Therapeutic Area 2019 & 2032
- Table 64: Global Vial Adaptors for Reconstitution Drug Industry Volume K Unit Forecast, by Therapeutic Area 2019 & 2032
- Table 65: Global Vial Adaptors for Reconstitution Drug Industry Revenue Million Forecast, by Country 2019 & 2032
- Table 66: Global Vial Adaptors for Reconstitution Drug Industry Volume K Unit Forecast, by Country 2019 & 2032
- Table 67: United States Vial Adaptors for Reconstitution Drug Industry Revenue (Million) Forecast, by Application 2019 & 2032
- Table 68: United States Vial Adaptors for Reconstitution Drug Industry Volume (K Unit) Forecast, by Application 2019 & 2032
- Table 69: Canada Vial Adaptors for Reconstitution Drug Industry Revenue (Million) Forecast, by Application 2019 & 2032
- Table 70: Canada Vial Adaptors for Reconstitution Drug Industry Volume (K Unit) Forecast, by Application 2019 & 2032
- Table 71: Mexico Vial Adaptors for Reconstitution Drug Industry Revenue (Million) Forecast, by Application 2019 & 2032
- Table 72: Mexico Vial Adaptors for Reconstitution Drug Industry Volume (K Unit) Forecast, by Application 2019 & 2032
- Table 73: Global Vial Adaptors for Reconstitution Drug Industry Revenue Million Forecast, by Material 2019 & 2032
- Table 74: Global Vial Adaptors for Reconstitution Drug Industry Volume K Unit Forecast, by Material 2019 & 2032
- Table 75: Global Vial Adaptors for Reconstitution Drug Industry Revenue Million Forecast, by Therapeutic Area 2019 & 2032
- Table 76: Global Vial Adaptors for Reconstitution Drug Industry Volume K Unit Forecast, by Therapeutic Area 2019 & 2032
- Table 77: Global Vial Adaptors for Reconstitution Drug Industry Revenue Million Forecast, by Country 2019 & 2032
- Table 78: Global Vial Adaptors for Reconstitution Drug Industry Volume K Unit Forecast, by Country 2019 & 2032
- Table 79: Germany Vial Adaptors for Reconstitution Drug Industry Revenue (Million) Forecast, by Application 2019 & 2032
- Table 80: Germany Vial Adaptors for Reconstitution Drug Industry Volume (K Unit) Forecast, by Application 2019 & 2032
- Table 81: United Kingdom Vial Adaptors for Reconstitution Drug Industry Revenue (Million) Forecast, by Application 2019 & 2032
- Table 82: United Kingdom Vial Adaptors for Reconstitution Drug Industry Volume (K Unit) Forecast, by Application 2019 & 2032
- Table 83: France Vial Adaptors for Reconstitution Drug Industry Revenue (Million) Forecast, by Application 2019 & 2032
- Table 84: France Vial Adaptors for Reconstitution Drug Industry Volume (K Unit) Forecast, by Application 2019 & 2032
- Table 85: Italy Vial Adaptors for Reconstitution Drug Industry Revenue (Million) Forecast, by Application 2019 & 2032
- Table 86: Italy Vial Adaptors for Reconstitution Drug Industry Volume (K Unit) Forecast, by Application 2019 & 2032
- Table 87: Spain Vial Adaptors for Reconstitution Drug Industry Revenue (Million) Forecast, by Application 2019 & 2032
- Table 88: Spain Vial Adaptors for Reconstitution Drug Industry Volume (K Unit) Forecast, by Application 2019 & 2032
- Table 89: Rest of Europe Vial Adaptors for Reconstitution Drug Industry Revenue (Million) Forecast, by Application 2019 & 2032
- Table 90: Rest of Europe Vial Adaptors for Reconstitution Drug Industry Volume (K Unit) Forecast, by Application 2019 & 2032
- Table 91: Global Vial Adaptors for Reconstitution Drug Industry Revenue Million Forecast, by Material 2019 & 2032
- Table 92: Global Vial Adaptors for Reconstitution Drug Industry Volume K Unit Forecast, by Material 2019 & 2032
- Table 93: Global Vial Adaptors for Reconstitution Drug Industry Revenue Million Forecast, by Therapeutic Area 2019 & 2032
- Table 94: Global Vial Adaptors for Reconstitution Drug Industry Volume K Unit Forecast, by Therapeutic Area 2019 & 2032
- Table 95: Global Vial Adaptors for Reconstitution Drug Industry Revenue Million Forecast, by Country 2019 & 2032
- Table 96: Global Vial Adaptors for Reconstitution Drug Industry Volume K Unit Forecast, by Country 2019 & 2032
- Table 97: China Vial Adaptors for Reconstitution Drug Industry Revenue (Million) Forecast, by Application 2019 & 2032
- Table 98: China Vial Adaptors for Reconstitution Drug Industry Volume (K Unit) Forecast, by Application 2019 & 2032
- Table 99: Japan Vial Adaptors for Reconstitution Drug Industry Revenue (Million) Forecast, by Application 2019 & 2032
- Table 100: Japan Vial Adaptors for Reconstitution Drug Industry Volume (K Unit) Forecast, by Application 2019 & 2032
- Table 101: India Vial Adaptors for Reconstitution Drug Industry Revenue (Million) Forecast, by Application 2019 & 2032
- Table 102: India Vial Adaptors for Reconstitution Drug Industry Volume (K Unit) Forecast, by Application 2019 & 2032
- Table 103: Australia Vial Adaptors for Reconstitution Drug Industry Revenue (Million) Forecast, by Application 2019 & 2032
- Table 104: Australia Vial Adaptors for Reconstitution Drug Industry Volume (K Unit) Forecast, by Application 2019 & 2032
- Table 105: South Korea Vial Adaptors for Reconstitution Drug Industry Revenue (Million) Forecast, by Application 2019 & 2032
- Table 106: South Korea Vial Adaptors for Reconstitution Drug Industry Volume (K Unit) Forecast, by Application 2019 & 2032
- Table 107: Rest of Asia Pacific Vial Adaptors for Reconstitution Drug Industry Revenue (Million) Forecast, by Application 2019 & 2032
- Table 108: Rest of Asia Pacific Vial Adaptors for Reconstitution Drug Industry Volume (K Unit) Forecast, by Application 2019 & 2032
- Table 109: Global Vial Adaptors for Reconstitution Drug Industry Revenue Million Forecast, by Material 2019 & 2032
- Table 110: Global Vial Adaptors for Reconstitution Drug Industry Volume K Unit Forecast, by Material 2019 & 2032
- Table 111: Global Vial Adaptors for Reconstitution Drug Industry Revenue Million Forecast, by Therapeutic Area 2019 & 2032
- Table 112: Global Vial Adaptors for Reconstitution Drug Industry Volume K Unit Forecast, by Therapeutic Area 2019 & 2032
- Table 113: Global Vial Adaptors for Reconstitution Drug Industry Revenue Million Forecast, by Country 2019 & 2032
- Table 114: Global Vial Adaptors for Reconstitution Drug Industry Volume K Unit Forecast, by Country 2019 & 2032
- Table 115: GCC Vial Adaptors for Reconstitution Drug Industry Revenue (Million) Forecast, by Application 2019 & 2032
- Table 116: GCC Vial Adaptors for Reconstitution Drug Industry Volume (K Unit) Forecast, by Application 2019 & 2032
- Table 117: South Africa Vial Adaptors for Reconstitution Drug Industry Revenue (Million) Forecast, by Application 2019 & 2032
- Table 118: South Africa Vial Adaptors for Reconstitution Drug Industry Volume (K Unit) Forecast, by Application 2019 & 2032
- Table 119: Rest of Middle East and Africa Vial Adaptors for Reconstitution Drug Industry Revenue (Million) Forecast, by Application 2019 & 2032
- Table 120: Rest of Middle East and Africa Vial Adaptors for Reconstitution Drug Industry Volume (K Unit) Forecast, by Application 2019 & 2032
- Table 121: Global Vial Adaptors for Reconstitution Drug Industry Revenue Million Forecast, by Material 2019 & 2032
- Table 122: Global Vial Adaptors for Reconstitution Drug Industry Volume K Unit Forecast, by Material 2019 & 2032
- Table 123: Global Vial Adaptors for Reconstitution Drug Industry Revenue Million Forecast, by Therapeutic Area 2019 & 2032
- Table 124: Global Vial Adaptors for Reconstitution Drug Industry Volume K Unit Forecast, by Therapeutic Area 2019 & 2032
- Table 125: Global Vial Adaptors for Reconstitution Drug Industry Revenue Million Forecast, by Country 2019 & 2032
- Table 126: Global Vial Adaptors for Reconstitution Drug Industry Volume K Unit Forecast, by Country 2019 & 2032
- Table 127: Brazil Vial Adaptors for Reconstitution Drug Industry Revenue (Million) Forecast, by Application 2019 & 2032
- Table 128: Brazil Vial Adaptors for Reconstitution Drug Industry Volume (K Unit) Forecast, by Application 2019 & 2032
- Table 129: Argentina Vial Adaptors for Reconstitution Drug Industry Revenue (Million) Forecast, by Application 2019 & 2032
- Table 130: Argentina Vial Adaptors for Reconstitution Drug Industry Volume (K Unit) Forecast, by Application 2019 & 2032
- Table 131: Rest of South America Vial Adaptors for Reconstitution Drug Industry Revenue (Million) Forecast, by Application 2019 & 2032
- Table 132: Rest of South America Vial Adaptors for Reconstitution Drug Industry Volume (K Unit) Forecast, by Application 2019 & 2032
Frequently Asked Questions
1. What is the projected Compound Annual Growth Rate (CAGR) of the Vial Adaptors for Reconstitution Drug Industry?
The projected CAGR is approximately 7.30%.
2. Which companies are prominent players in the Vial Adaptors for Reconstitution Drug Industry?
Key companies in the market include Becton Dickinson and Company, West Pharmaceutical Services Inc , Randox Laboratories Ltd, Miltenyi Biotec, ARaymond, Stevanato Group, Sartorious AG, Baxter International Inc, B Braun SE, Thermo Fisher Scientific, Simplivia, Agilent Technologies.
3. What are the main segments of the Vial Adaptors for Reconstitution Drug Industry?
The market segments include Material, Therapeutic Area.
4. Can you provide details about the market size?
The market size is estimated to be USD XX Million as of 2022.
5. What are some drivers contributing to market growth?
Increasing Prevalence of Infectious Diseases; Rising Geriatric Population; Increasing Awareness of the Advantages of the Vial Adaptors.
6. What are the notable trends driving market growth?
Infectious Diseases Segment is Expected to Hold a Significant Market Share Over the Forecast Period.
7. Are there any restraints impacting market growth?
Availability of Substitutes.
8. Can you provide examples of recent developments in the market?
Dec 2022: The life science group Sartorius and Sweden-based BICO Group, a provider of instruments and consumables for bioprinting, bioscience, and automation applications, agreed on a comprehensive technology as well as sales and marketing cooperation.
9. What pricing options are available for accessing the report?
Pricing options include single-user, multi-user, and enterprise licenses priced at USD 4750, USD 5250, and USD 8750 respectively.
10. Is the market size provided in terms of value or volume?
The market size is provided in terms of value, measured in Million and volume, measured in K Unit.
11. Are there any specific market keywords associated with the report?
Yes, the market keyword associated with the report is "Vial Adaptors for Reconstitution Drug Industry," which aids in identifying and referencing the specific market segment covered.
12. How do I determine which pricing option suits my needs best?
The pricing options vary based on user requirements and access needs. Individual users may opt for single-user licenses, while businesses requiring broader access may choose multi-user or enterprise licenses for cost-effective access to the report.
13. Are there any additional resources or data provided in the Vial Adaptors for Reconstitution Drug Industry report?
While the report offers comprehensive insights, it's advisable to review the specific contents or supplementary materials provided to ascertain if additional resources or data are available.
14. How can I stay updated on further developments or reports in the Vial Adaptors for Reconstitution Drug Industry?
To stay informed about further developments, trends, and reports in the Vial Adaptors for Reconstitution Drug Industry, consider subscribing to industry newsletters, following relevant companies and organizations, or regularly checking reputable industry news sources and publications.
Methodology
Step 1 - Identification of Relevant Samples Size from Population Database


Step 2 - Approaches for Defining Global Market Size (Value, Volume* & Price*)

Note*: In applicable scenarios
Step 3 - Data Sources
Primary Research
- Web Analytics
- Survey Reports
- Research Institute
- Latest Research Reports
- Opinion Leaders
Secondary Research
- Annual Reports
- White Paper
- Latest Press Release
- Industry Association
- Paid Database
- Investor Presentations

Step 4 - Data Triangulation
Involves using different sources of information in order to increase the validity of a study
These sources are likely to be stakeholders in a program - participants, other researchers, program staff, other community members, and so on.
Then we put all data in single framework & apply various statistical tools to find out the dynamic on the market.
During the analysis stage, feedback from the stakeholder groups would be compared to determine areas of agreement as well as areas of divergence


