
Key Insights
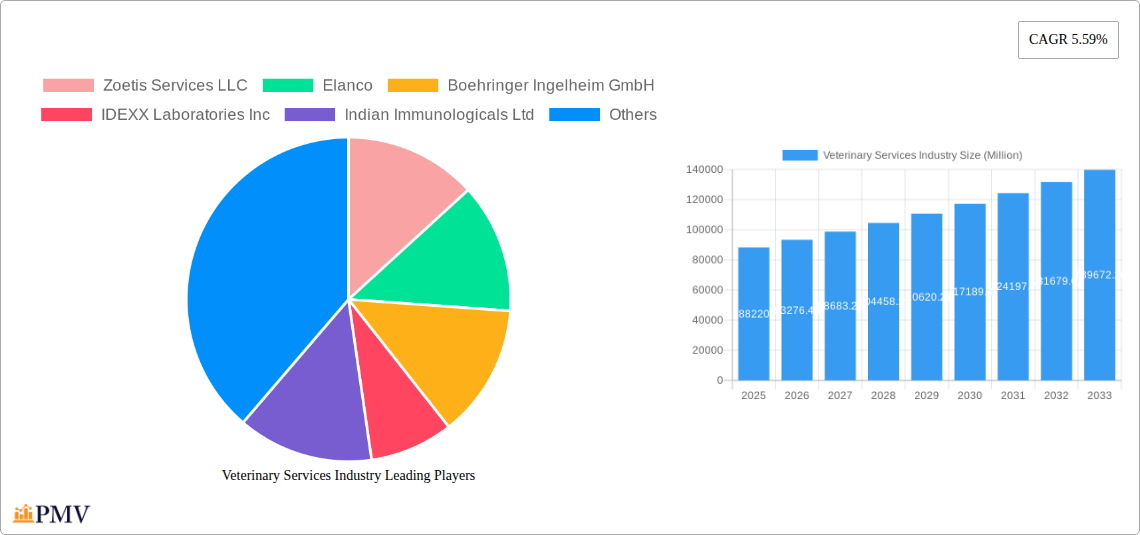
The global veterinary services market, valued at $88.22 billion in 2025, is projected to experience robust growth, driven by several key factors. Increasing pet ownership worldwide, coupled with rising humanization of pets and a greater willingness to invest in their healthcare, significantly fuels market expansion. Technological advancements, such as advanced diagnostic imaging and minimally invasive surgical techniques, are enhancing the quality and efficiency of veterinary care, further boosting market growth. The increasing prevalence of chronic diseases in animals, necessitating ongoing veterinary attention, also contributes significantly. Furthermore, the growing awareness of animal welfare and preventative healthcare among pet owners is driving demand for regular check-ups and vaccinations. The market is segmented by animal type (companion animals driving the majority of revenue, followed by production animals) and type of care (primary care holding the largest share, followed by emergency, critical, and specialty services). This segmentation reflects diverse needs and spending patterns across the industry.
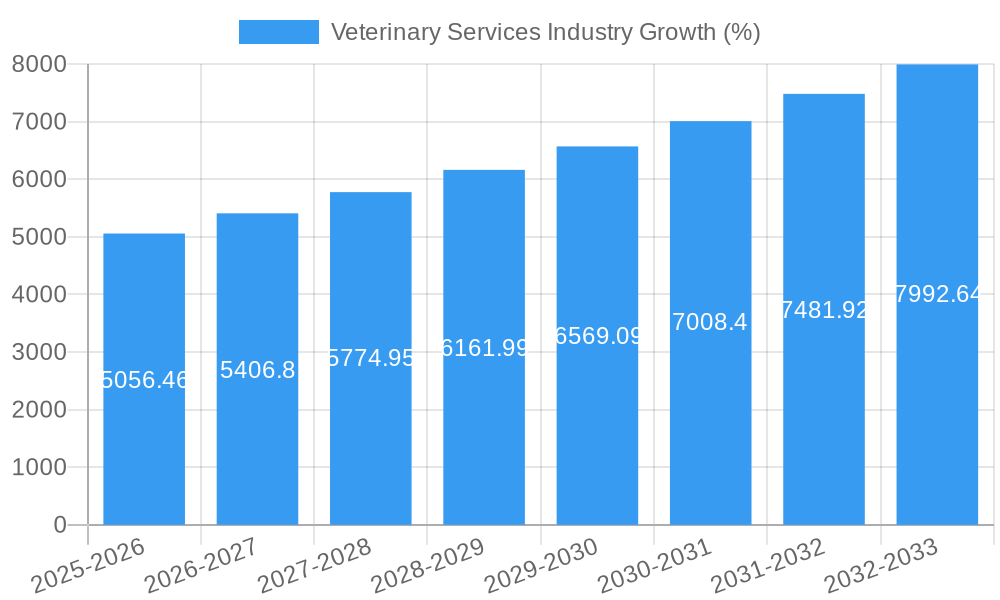
Competition in the veterinary services market is intense, with major players like Zoetis, Elanco, Boehringer Ingelheim, and IDEXX Laboratories, alongside several regional players, vying for market share. Growth opportunities exist in expanding access to veterinary services in developing countries, particularly through mobile clinics and telemedicine initiatives. The market faces certain constraints, including high costs associated with advanced veterinary treatments and procedures, access limitations in remote areas, and potential shortages of qualified veterinary professionals. However, the overall outlook remains positive, with a projected Compound Annual Growth Rate (CAGR) of 5.59% from 2025 to 2033, indicating a considerable expansion of this vital sector in the coming years. Strategic partnerships, technological integration, and expansion into underserved markets will be crucial for success in this dynamic landscape.
Veterinary Services Industry: A Comprehensive Market Report (2019-2033)
This detailed report provides a comprehensive analysis of the global veterinary services market, projecting a market value exceeding $XX Million by 2033. The study period covers 2019-2033, with 2025 as the base and estimated year. The report offers invaluable insights for investors, industry professionals, and strategic decision-makers seeking to navigate this dynamic and rapidly evolving sector. It leverages extensive primary and secondary research to deliver actionable intelligence on market size, segmentation, competitive landscape, and future growth trajectories.
Veterinary Services Industry Market Structure & Competitive Dynamics
The global veterinary services market exhibits a moderately concentrated structure, with a few dominant players commanding significant market share. Zoetis Services LLC, Elanco, Boehringer Ingelheim GmbH, and IDEXX Laboratories Inc. are key players, holding a combined market share estimated at XX%. The industry is characterized by intense competition, driven by innovation in diagnostic technologies, therapeutics, and service offerings. The regulatory landscape, varying significantly across geographies, plays a crucial role in shaping market dynamics. Product substitution, particularly in pharmaceuticals, is a notable factor, with generic and biosimilar products increasingly challenging the dominance of branded medications. End-user trends, notably the rising pet ownership and humanization of pets in developed nations, significantly fuel market growth.
The M&A landscape in the veterinary services sector is active, with substantial deal values recorded in recent years. For example, the acquisition of [Company Name] by [Acquiring Company] in [Year] was valued at approximately $XX Million, indicating the strategic importance of consolidation and expansion within the industry. Key factors influencing M&A activities include the pursuit of economies of scale, expansion into new geographical markets, and access to innovative technologies.
Veterinary Services Industry Industry Trends & Insights
The veterinary services market is experiencing robust growth, driven by several key factors. Rising pet ownership, particularly in emerging economies, is a primary driver, coupled with increasing pet healthcare expenditure. The humanization of pets, leading to higher demand for advanced diagnostic and treatment services, further propels market expansion. Technological advancements, such as the introduction of point-of-care diagnostics, telemedicine, and personalized medicine, are transforming the delivery of veterinary care, improving efficiency and accuracy. This technological disruption is also enabling the rise of specialized veterinary services.
The market is characterized by a Compound Annual Growth Rate (CAGR) of XX% during the forecast period (2025-2033). Market penetration of advanced diagnostic tools and specialized treatments is increasing, particularly in developed markets, highlighting the shift toward more comprehensive and sophisticated animal healthcare. Competitive dynamics are intense, with companies investing heavily in R&D and strategic partnerships to maintain market share and expand their product portfolios.
Dominant Markets & Segments in Veterinary Services Industry
The companion animal segment dominates the veterinary services market globally, accounting for approximately XX% of the total market value in 2025. This dominance is primarily attributed to the increasing humanization of pets and rising pet ownership rates in developed nations, coupled with higher disposable incomes.
- Key Drivers for Companion Animal Segment Dominance:
- High pet ownership rates in North America and Europe.
- Increasing willingness to spend on pet healthcare.
- Growing demand for specialized veterinary services, such as dermatology and oncology.
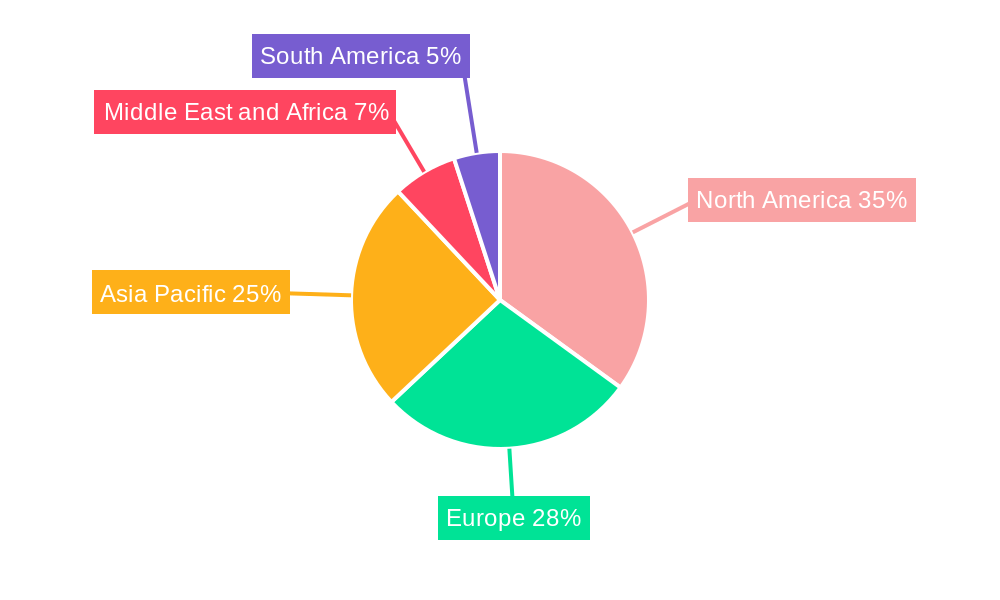
The North American region currently holds the largest market share, driven by factors such as advanced healthcare infrastructure, high pet ownership, and strong regulatory support for animal health.
- Key Drivers for North American Market Dominance:
- High disposable incomes and pet ownership rates.
- Well-established veterinary healthcare infrastructure.
- Advanced diagnostic and treatment technologies.
- Favorable regulatory environment.
Within the "By Type of Care" segmentation, primary care services constitute the largest segment, followed by emergency and specialty services. Growth in specialty services is notably faster, reflecting the increasing demand for advanced treatments.
Veterinary Services Industry Product Innovations
Recent product innovations focus on improving diagnostic accuracy, enhancing treatment efficacy, and providing more convenient and personalized care. The introduction of point-of-care diagnostics, rapid diagnostic tests, and advanced imaging technologies has significantly improved the speed and accuracy of diagnosis. New therapeutic agents, such as targeted therapies and biologics, offer more effective treatment options for a wider range of animal diseases. These innovations align with the broader industry trend towards precision medicine and personalized care, optimizing treatment outcomes and improving animal welfare.
Report Segmentation & Scope
The report comprehensively segments the veterinary services market based on animal type (companion animal, production animal) and type of care (primary, emergency, critical, specialty services, others). The companion animal segment shows the highest growth projection, driven by increased pet ownership and willingness to invest in pet healthcare. The production animal segment, although smaller, exhibits steady growth due to the increasing demand for high-quality animal products and the focus on animal welfare in livestock farming. Growth projections for each segment are detailed within the full report, including market sizes and competitive landscapes.
Key Drivers of Veterinary Services Industry Growth
Several key factors drive the growth of the veterinary services industry: rising pet ownership globally; increasing disposable incomes enabling higher pet healthcare spending; technological advancements resulting in better diagnostic tools and treatments; stricter regulations for animal welfare, promoting a more proactive approach to animal health; and increasing awareness among pet owners regarding preventive healthcare.
Challenges in the Veterinary Services Industry Sector
The veterinary services sector faces several challenges, including the high cost of advanced diagnostic and treatment technologies, which can limit accessibility; shortages of qualified veterinary professionals in many regions; the complexity of regulatory frameworks, varying significantly across countries; and intense competition among established players and emerging companies. These factors impact market growth and require strategic adaptation by industry stakeholders.
Leading Players in the Veterinary Services Industry Market
- Zoetis Services LLC
- Elanco
- Boehringer Ingelheim GmbH
- IDEXX Laboratories Inc
- Indian Immunologicals Ltd
- Vetoquinol S A
- Hester Bioscience
- Heska Corp
- Ceva Sant Animale
- Phibro Animal Health
- Virbac
- Merck Animal Health
Key Developments in Veterinary Services Industry Sector
April 2022: Animalcare launched Plaqtiv+, a range of dental care products for cats and dogs designed to reduce calculus formation. This launch expands the company's product portfolio in the growing companion animal care market.
April 2022: Aurena Laboratories AB (Aurena) entered a collaboration with Swedish start-up Emollivet to become their manufacturing partner for its innovative animal healthcare products based on Lipitor AKVANO technology in spray form. This partnership signifies the growing interest in innovative delivery systems for animal healthcare products.
Strategic Veterinary Services Industry Market Outlook
The veterinary services market exhibits substantial future growth potential, driven by continuous technological advancements, rising pet ownership, and increasing awareness of preventative healthcare. Strategic opportunities exist in developing innovative diagnostic tools, personalized therapies, and telemedicine solutions. Companies that invest in R&D, build strong distribution networks, and effectively address the evolving needs of pet owners are poised to capture significant market share in the coming years. The market is expected to witness further consolidation through mergers and acquisitions, leading to a more concentrated landscape.
Veterinary Services Industry Segmentation
-
1. Animal Type
- 1.1. Companion Animal
- 1.2. Production Animal
-
2. Type of Care
- 2.1. Primary
- 2.2. Emergency
- 2.3. Critical
- 2.4. Specialty Services
- 2.5. Others S
Veterinary Services Industry Segmentation By Geography
-
1. North America
- 1.1. United States
- 1.2. Canada
- 1.3. Mexico
-
2. Europe
- 2.1. Germany
- 2.2. United Kingdom
- 2.3. France
- 2.4. Italy
- 2.5. Spain
- 2.6. Rest of Europe
-
3. Asia Pacific
- 3.1. China
- 3.2. Japan
- 3.3. India
- 3.4. Australia
- 3.5. South Korea
- 3.6. Rest of Asia Pacific
-
4. Middle East and Africa
- 4.1. GCC
- 4.2. South Africa
- 4.3. Rest of Middle East and Africa
-
5. South America
- 5.1. Brazil
- 5.2. Argentina
- 5.3. Rest of South America
Veterinary Services Industry REPORT HIGHLIGHTS
| Aspects | Details |
|---|---|
| Study Period | 2019-2033 |
| Base Year | 2024 |
| Estimated Year | 2025 |
| Forecast Period | 2025-2033 |
| Historical Period | 2019-2024 |
| Growth Rate | CAGR of 5.59% from 2019-2033 |
| Segmentation |
|
Table of Contents
- 1. Introduction
- 1.1. Research Scope
- 1.2. Market Segmentation
- 1.3. Research Methodology
- 1.4. Definitions and Assumptions
- 2. Executive Summary
- 2.1. Introduction
- 3. Market Dynamics
- 3.1. Introduction
- 3.2. Market Drivers
- 3.2.1. Rising Chronic Diseases and Awareness Regarding Veterinary Care; Increasing Initiatives by Governments and Animal Welfare Associations in Different Countries
- 3.3. Market Restrains
- 3.3.1. Increasing Costs of Animal Care Product and Veterinary Services
- 3.4. Market Trends
- 3.4.1. Companion Animal Segment is Expected to Hold Significant Market Share in the Market Over the Forecast Period
- 4. Market Factor Analysis
- 4.1. Porters Five Forces
- 4.2. Supply/Value Chain
- 4.3. PESTEL analysis
- 4.4. Market Entropy
- 4.5. Patent/Trademark Analysis
- 5. Global Veterinary Services Industry Analysis, Insights and Forecast, 2019-2031
- 5.1. Market Analysis, Insights and Forecast - by Animal Type
- 5.1.1. Companion Animal
- 5.1.2. Production Animal
- 5.2. Market Analysis, Insights and Forecast - by Type of Care
- 5.2.1. Primary
- 5.2.2. Emergency
- 5.2.3. Critical
- 5.2.4. Specialty Services
- 5.2.5. Others S
- 5.3. Market Analysis, Insights and Forecast - by Region
- 5.3.1. North America
- 5.3.2. Europe
- 5.3.3. Asia Pacific
- 5.3.4. Middle East and Africa
- 5.3.5. South America
- 5.1. Market Analysis, Insights and Forecast - by Animal Type
- 6. North America Veterinary Services Industry Analysis, Insights and Forecast, 2019-2031
- 6.1. Market Analysis, Insights and Forecast - by Animal Type
- 6.1.1. Companion Animal
- 6.1.2. Production Animal
- 6.2. Market Analysis, Insights and Forecast - by Type of Care
- 6.2.1. Primary
- 6.2.2. Emergency
- 6.2.3. Critical
- 6.2.4. Specialty Services
- 6.2.5. Others S
- 6.1. Market Analysis, Insights and Forecast - by Animal Type
- 7. Europe Veterinary Services Industry Analysis, Insights and Forecast, 2019-2031
- 7.1. Market Analysis, Insights and Forecast - by Animal Type
- 7.1.1. Companion Animal
- 7.1.2. Production Animal
- 7.2. Market Analysis, Insights and Forecast - by Type of Care
- 7.2.1. Primary
- 7.2.2. Emergency
- 7.2.3. Critical
- 7.2.4. Specialty Services
- 7.2.5. Others S
- 7.1. Market Analysis, Insights and Forecast - by Animal Type
- 8. Asia Pacific Veterinary Services Industry Analysis, Insights and Forecast, 2019-2031
- 8.1. Market Analysis, Insights and Forecast - by Animal Type
- 8.1.1. Companion Animal
- 8.1.2. Production Animal
- 8.2. Market Analysis, Insights and Forecast - by Type of Care
- 8.2.1. Primary
- 8.2.2. Emergency
- 8.2.3. Critical
- 8.2.4. Specialty Services
- 8.2.5. Others S
- 8.1. Market Analysis, Insights and Forecast - by Animal Type
- 9. Middle East and Africa Veterinary Services Industry Analysis, Insights and Forecast, 2019-2031
- 9.1. Market Analysis, Insights and Forecast - by Animal Type
- 9.1.1. Companion Animal
- 9.1.2. Production Animal
- 9.2. Market Analysis, Insights and Forecast - by Type of Care
- 9.2.1. Primary
- 9.2.2. Emergency
- 9.2.3. Critical
- 9.2.4. Specialty Services
- 9.2.5. Others S
- 9.1. Market Analysis, Insights and Forecast - by Animal Type
- 10. South America Veterinary Services Industry Analysis, Insights and Forecast, 2019-2031
- 10.1. Market Analysis, Insights and Forecast - by Animal Type
- 10.1.1. Companion Animal
- 10.1.2. Production Animal
- 10.2. Market Analysis, Insights and Forecast - by Type of Care
- 10.2.1. Primary
- 10.2.2. Emergency
- 10.2.3. Critical
- 10.2.4. Specialty Services
- 10.2.5. Others S
- 10.1. Market Analysis, Insights and Forecast - by Animal Type
- 11. North America Veterinary Services Industry Analysis, Insights and Forecast, 2019-2031
- 11.1. Market Analysis, Insights and Forecast - By Country/Sub-region
- 11.1.1 United States
- 11.1.2 Canada
- 11.1.3 Mexico
- 12. Europe Veterinary Services Industry Analysis, Insights and Forecast, 2019-2031
- 12.1. Market Analysis, Insights and Forecast - By Country/Sub-region
- 12.1.1 Germany
- 12.1.2 United Kingdom
- 12.1.3 France
- 12.1.4 Italy
- 12.1.5 Spain
- 12.1.6 Rest of Europe
- 13. Asia Pacific Veterinary Services Industry Analysis, Insights and Forecast, 2019-2031
- 13.1. Market Analysis, Insights and Forecast - By Country/Sub-region
- 13.1.1 China
- 13.1.2 Japan
- 13.1.3 India
- 13.1.4 Australia
- 13.1.5 South Korea
- 13.1.6 Rest of Asia Pacific
- 14. Middle East and Africa Veterinary Services Industry Analysis, Insights and Forecast, 2019-2031
- 14.1. Market Analysis, Insights and Forecast - By Country/Sub-region
- 14.1.1 GCC
- 14.1.2 South Africa
- 14.1.3 Rest of Middle East and Africa
- 15. South America Veterinary Services Industry Analysis, Insights and Forecast, 2019-2031
- 15.1. Market Analysis, Insights and Forecast - By Country/Sub-region
- 15.1.1 Brazil
- 15.1.2 Argentina
- 15.1.3 Rest of South America
- 16. Competitive Analysis
- 16.1. Global Market Share Analysis 2024
- 16.2. Company Profiles
- 16.2.1 Zoetis Services LLC
- 16.2.1.1. Overview
- 16.2.1.2. Products
- 16.2.1.3. SWOT Analysis
- 16.2.1.4. Recent Developments
- 16.2.1.5. Financials (Based on Availability)
- 16.2.2 Elanco
- 16.2.2.1. Overview
- 16.2.2.2. Products
- 16.2.2.3. SWOT Analysis
- 16.2.2.4. Recent Developments
- 16.2.2.5. Financials (Based on Availability)
- 16.2.3 Boehringer Ingelheim GmbH
- 16.2.3.1. Overview
- 16.2.3.2. Products
- 16.2.3.3. SWOT Analysis
- 16.2.3.4. Recent Developments
- 16.2.3.5. Financials (Based on Availability)
- 16.2.4 IDEXX Laboratories Inc
- 16.2.4.1. Overview
- 16.2.4.2. Products
- 16.2.4.3. SWOT Analysis
- 16.2.4.4. Recent Developments
- 16.2.4.5. Financials (Based on Availability)
- 16.2.5 Indian Immunologicals Ltd
- 16.2.5.1. Overview
- 16.2.5.2. Products
- 16.2.5.3. SWOT Analysis
- 16.2.5.4. Recent Developments
- 16.2.5.5. Financials (Based on Availability)
- 16.2.6 Vetoquinol S A
- 16.2.6.1. Overview
- 16.2.6.2. Products
- 16.2.6.3. SWOT Analysis
- 16.2.6.4. Recent Developments
- 16.2.6.5. Financials (Based on Availability)
- 16.2.7 Hester Bioscience
- 16.2.7.1. Overview
- 16.2.7.2. Products
- 16.2.7.3. SWOT Analysis
- 16.2.7.4. Recent Developments
- 16.2.7.5. Financials (Based on Availability)
- 16.2.8 Heska Corp
- 16.2.8.1. Overview
- 16.2.8.2. Products
- 16.2.8.3. SWOT Analysis
- 16.2.8.4. Recent Developments
- 16.2.8.5. Financials (Based on Availability)
- 16.2.9 Ceva Sant Animale
- 16.2.9.1. Overview
- 16.2.9.2. Products
- 16.2.9.3. SWOT Analysis
- 16.2.9.4. Recent Developments
- 16.2.9.5. Financials (Based on Availability)
- 16.2.10 Phibro Animal Health
- 16.2.10.1. Overview
- 16.2.10.2. Products
- 16.2.10.3. SWOT Analysis
- 16.2.10.4. Recent Developments
- 16.2.10.5. Financials (Based on Availability)
- 16.2.11 Virbac
- 16.2.11.1. Overview
- 16.2.11.2. Products
- 16.2.11.3. SWOT Analysis
- 16.2.11.4. Recent Developments
- 16.2.11.5. Financials (Based on Availability)
- 16.2.12 Merck Animal Health
- 16.2.12.1. Overview
- 16.2.12.2. Products
- 16.2.12.3. SWOT Analysis
- 16.2.12.4. Recent Developments
- 16.2.12.5. Financials (Based on Availability)
- 16.2.1 Zoetis Services LLC
List of Figures
- Figure 1: Global Veterinary Services Industry Revenue Breakdown (Million, %) by Region 2024 & 2032
- Figure 2: Global Veterinary Services Industry Volume Breakdown (K Unit, %) by Region 2024 & 2032
- Figure 3: North America Veterinary Services Industry Revenue (Million), by Country 2024 & 2032
- Figure 4: North America Veterinary Services Industry Volume (K Unit), by Country 2024 & 2032
- Figure 5: North America Veterinary Services Industry Revenue Share (%), by Country 2024 & 2032
- Figure 6: North America Veterinary Services Industry Volume Share (%), by Country 2024 & 2032
- Figure 7: Europe Veterinary Services Industry Revenue (Million), by Country 2024 & 2032
- Figure 8: Europe Veterinary Services Industry Volume (K Unit), by Country 2024 & 2032
- Figure 9: Europe Veterinary Services Industry Revenue Share (%), by Country 2024 & 2032
- Figure 10: Europe Veterinary Services Industry Volume Share (%), by Country 2024 & 2032
- Figure 11: Asia Pacific Veterinary Services Industry Revenue (Million), by Country 2024 & 2032
- Figure 12: Asia Pacific Veterinary Services Industry Volume (K Unit), by Country 2024 & 2032
- Figure 13: Asia Pacific Veterinary Services Industry Revenue Share (%), by Country 2024 & 2032
- Figure 14: Asia Pacific Veterinary Services Industry Volume Share (%), by Country 2024 & 2032
- Figure 15: Middle East and Africa Veterinary Services Industry Revenue (Million), by Country 2024 & 2032
- Figure 16: Middle East and Africa Veterinary Services Industry Volume (K Unit), by Country 2024 & 2032
- Figure 17: Middle East and Africa Veterinary Services Industry Revenue Share (%), by Country 2024 & 2032
- Figure 18: Middle East and Africa Veterinary Services Industry Volume Share (%), by Country 2024 & 2032
- Figure 19: South America Veterinary Services Industry Revenue (Million), by Country 2024 & 2032
- Figure 20: South America Veterinary Services Industry Volume (K Unit), by Country 2024 & 2032
- Figure 21: South America Veterinary Services Industry Revenue Share (%), by Country 2024 & 2032
- Figure 22: South America Veterinary Services Industry Volume Share (%), by Country 2024 & 2032
- Figure 23: North America Veterinary Services Industry Revenue (Million), by Animal Type 2024 & 2032
- Figure 24: North America Veterinary Services Industry Volume (K Unit), by Animal Type 2024 & 2032
- Figure 25: North America Veterinary Services Industry Revenue Share (%), by Animal Type 2024 & 2032
- Figure 26: North America Veterinary Services Industry Volume Share (%), by Animal Type 2024 & 2032
- Figure 27: North America Veterinary Services Industry Revenue (Million), by Type of Care 2024 & 2032
- Figure 28: North America Veterinary Services Industry Volume (K Unit), by Type of Care 2024 & 2032
- Figure 29: North America Veterinary Services Industry Revenue Share (%), by Type of Care 2024 & 2032
- Figure 30: North America Veterinary Services Industry Volume Share (%), by Type of Care 2024 & 2032
- Figure 31: North America Veterinary Services Industry Revenue (Million), by Country 2024 & 2032
- Figure 32: North America Veterinary Services Industry Volume (K Unit), by Country 2024 & 2032
- Figure 33: North America Veterinary Services Industry Revenue Share (%), by Country 2024 & 2032
- Figure 34: North America Veterinary Services Industry Volume Share (%), by Country 2024 & 2032
- Figure 35: Europe Veterinary Services Industry Revenue (Million), by Animal Type 2024 & 2032
- Figure 36: Europe Veterinary Services Industry Volume (K Unit), by Animal Type 2024 & 2032
- Figure 37: Europe Veterinary Services Industry Revenue Share (%), by Animal Type 2024 & 2032
- Figure 38: Europe Veterinary Services Industry Volume Share (%), by Animal Type 2024 & 2032
- Figure 39: Europe Veterinary Services Industry Revenue (Million), by Type of Care 2024 & 2032
- Figure 40: Europe Veterinary Services Industry Volume (K Unit), by Type of Care 2024 & 2032
- Figure 41: Europe Veterinary Services Industry Revenue Share (%), by Type of Care 2024 & 2032
- Figure 42: Europe Veterinary Services Industry Volume Share (%), by Type of Care 2024 & 2032
- Figure 43: Europe Veterinary Services Industry Revenue (Million), by Country 2024 & 2032
- Figure 44: Europe Veterinary Services Industry Volume (K Unit), by Country 2024 & 2032
- Figure 45: Europe Veterinary Services Industry Revenue Share (%), by Country 2024 & 2032
- Figure 46: Europe Veterinary Services Industry Volume Share (%), by Country 2024 & 2032
- Figure 47: Asia Pacific Veterinary Services Industry Revenue (Million), by Animal Type 2024 & 2032
- Figure 48: Asia Pacific Veterinary Services Industry Volume (K Unit), by Animal Type 2024 & 2032
- Figure 49: Asia Pacific Veterinary Services Industry Revenue Share (%), by Animal Type 2024 & 2032
- Figure 50: Asia Pacific Veterinary Services Industry Volume Share (%), by Animal Type 2024 & 2032
- Figure 51: Asia Pacific Veterinary Services Industry Revenue (Million), by Type of Care 2024 & 2032
- Figure 52: Asia Pacific Veterinary Services Industry Volume (K Unit), by Type of Care 2024 & 2032
- Figure 53: Asia Pacific Veterinary Services Industry Revenue Share (%), by Type of Care 2024 & 2032
- Figure 54: Asia Pacific Veterinary Services Industry Volume Share (%), by Type of Care 2024 & 2032
- Figure 55: Asia Pacific Veterinary Services Industry Revenue (Million), by Country 2024 & 2032
- Figure 56: Asia Pacific Veterinary Services Industry Volume (K Unit), by Country 2024 & 2032
- Figure 57: Asia Pacific Veterinary Services Industry Revenue Share (%), by Country 2024 & 2032
- Figure 58: Asia Pacific Veterinary Services Industry Volume Share (%), by Country 2024 & 2032
- Figure 59: Middle East and Africa Veterinary Services Industry Revenue (Million), by Animal Type 2024 & 2032
- Figure 60: Middle East and Africa Veterinary Services Industry Volume (K Unit), by Animal Type 2024 & 2032
- Figure 61: Middle East and Africa Veterinary Services Industry Revenue Share (%), by Animal Type 2024 & 2032
- Figure 62: Middle East and Africa Veterinary Services Industry Volume Share (%), by Animal Type 2024 & 2032
- Figure 63: Middle East and Africa Veterinary Services Industry Revenue (Million), by Type of Care 2024 & 2032
- Figure 64: Middle East and Africa Veterinary Services Industry Volume (K Unit), by Type of Care 2024 & 2032
- Figure 65: Middle East and Africa Veterinary Services Industry Revenue Share (%), by Type of Care 2024 & 2032
- Figure 66: Middle East and Africa Veterinary Services Industry Volume Share (%), by Type of Care 2024 & 2032
- Figure 67: Middle East and Africa Veterinary Services Industry Revenue (Million), by Country 2024 & 2032
- Figure 68: Middle East and Africa Veterinary Services Industry Volume (K Unit), by Country 2024 & 2032
- Figure 69: Middle East and Africa Veterinary Services Industry Revenue Share (%), by Country 2024 & 2032
- Figure 70: Middle East and Africa Veterinary Services Industry Volume Share (%), by Country 2024 & 2032
- Figure 71: South America Veterinary Services Industry Revenue (Million), by Animal Type 2024 & 2032
- Figure 72: South America Veterinary Services Industry Volume (K Unit), by Animal Type 2024 & 2032
- Figure 73: South America Veterinary Services Industry Revenue Share (%), by Animal Type 2024 & 2032
- Figure 74: South America Veterinary Services Industry Volume Share (%), by Animal Type 2024 & 2032
- Figure 75: South America Veterinary Services Industry Revenue (Million), by Type of Care 2024 & 2032
- Figure 76: South America Veterinary Services Industry Volume (K Unit), by Type of Care 2024 & 2032
- Figure 77: South America Veterinary Services Industry Revenue Share (%), by Type of Care 2024 & 2032
- Figure 78: South America Veterinary Services Industry Volume Share (%), by Type of Care 2024 & 2032
- Figure 79: South America Veterinary Services Industry Revenue (Million), by Country 2024 & 2032
- Figure 80: South America Veterinary Services Industry Volume (K Unit), by Country 2024 & 2032
- Figure 81: South America Veterinary Services Industry Revenue Share (%), by Country 2024 & 2032
- Figure 82: South America Veterinary Services Industry Volume Share (%), by Country 2024 & 2032
List of Tables
- Table 1: Global Veterinary Services Industry Revenue Million Forecast, by Region 2019 & 2032
- Table 2: Global Veterinary Services Industry Volume K Unit Forecast, by Region 2019 & 2032
- Table 3: Global Veterinary Services Industry Revenue Million Forecast, by Animal Type 2019 & 2032
- Table 4: Global Veterinary Services Industry Volume K Unit Forecast, by Animal Type 2019 & 2032
- Table 5: Global Veterinary Services Industry Revenue Million Forecast, by Type of Care 2019 & 2032
- Table 6: Global Veterinary Services Industry Volume K Unit Forecast, by Type of Care 2019 & 2032
- Table 7: Global Veterinary Services Industry Revenue Million Forecast, by Region 2019 & 2032
- Table 8: Global Veterinary Services Industry Volume K Unit Forecast, by Region 2019 & 2032
- Table 9: Global Veterinary Services Industry Revenue Million Forecast, by Country 2019 & 2032
- Table 10: Global Veterinary Services Industry Volume K Unit Forecast, by Country 2019 & 2032
- Table 11: United States Veterinary Services Industry Revenue (Million) Forecast, by Application 2019 & 2032
- Table 12: United States Veterinary Services Industry Volume (K Unit) Forecast, by Application 2019 & 2032
- Table 13: Canada Veterinary Services Industry Revenue (Million) Forecast, by Application 2019 & 2032
- Table 14: Canada Veterinary Services Industry Volume (K Unit) Forecast, by Application 2019 & 2032
- Table 15: Mexico Veterinary Services Industry Revenue (Million) Forecast, by Application 2019 & 2032
- Table 16: Mexico Veterinary Services Industry Volume (K Unit) Forecast, by Application 2019 & 2032
- Table 17: Global Veterinary Services Industry Revenue Million Forecast, by Country 2019 & 2032
- Table 18: Global Veterinary Services Industry Volume K Unit Forecast, by Country 2019 & 2032
- Table 19: Germany Veterinary Services Industry Revenue (Million) Forecast, by Application 2019 & 2032
- Table 20: Germany Veterinary Services Industry Volume (K Unit) Forecast, by Application 2019 & 2032
- Table 21: United Kingdom Veterinary Services Industry Revenue (Million) Forecast, by Application 2019 & 2032
- Table 22: United Kingdom Veterinary Services Industry Volume (K Unit) Forecast, by Application 2019 & 2032
- Table 23: France Veterinary Services Industry Revenue (Million) Forecast, by Application 2019 & 2032
- Table 24: France Veterinary Services Industry Volume (K Unit) Forecast, by Application 2019 & 2032
- Table 25: Italy Veterinary Services Industry Revenue (Million) Forecast, by Application 2019 & 2032
- Table 26: Italy Veterinary Services Industry Volume (K Unit) Forecast, by Application 2019 & 2032
- Table 27: Spain Veterinary Services Industry Revenue (Million) Forecast, by Application 2019 & 2032
- Table 28: Spain Veterinary Services Industry Volume (K Unit) Forecast, by Application 2019 & 2032
- Table 29: Rest of Europe Veterinary Services Industry Revenue (Million) Forecast, by Application 2019 & 2032
- Table 30: Rest of Europe Veterinary Services Industry Volume (K Unit) Forecast, by Application 2019 & 2032
- Table 31: Global Veterinary Services Industry Revenue Million Forecast, by Country 2019 & 2032
- Table 32: Global Veterinary Services Industry Volume K Unit Forecast, by Country 2019 & 2032
- Table 33: China Veterinary Services Industry Revenue (Million) Forecast, by Application 2019 & 2032
- Table 34: China Veterinary Services Industry Volume (K Unit) Forecast, by Application 2019 & 2032
- Table 35: Japan Veterinary Services Industry Revenue (Million) Forecast, by Application 2019 & 2032
- Table 36: Japan Veterinary Services Industry Volume (K Unit) Forecast, by Application 2019 & 2032
- Table 37: India Veterinary Services Industry Revenue (Million) Forecast, by Application 2019 & 2032
- Table 38: India Veterinary Services Industry Volume (K Unit) Forecast, by Application 2019 & 2032
- Table 39: Australia Veterinary Services Industry Revenue (Million) Forecast, by Application 2019 & 2032
- Table 40: Australia Veterinary Services Industry Volume (K Unit) Forecast, by Application 2019 & 2032
- Table 41: South Korea Veterinary Services Industry Revenue (Million) Forecast, by Application 2019 & 2032
- Table 42: South Korea Veterinary Services Industry Volume (K Unit) Forecast, by Application 2019 & 2032
- Table 43: Rest of Asia Pacific Veterinary Services Industry Revenue (Million) Forecast, by Application 2019 & 2032
- Table 44: Rest of Asia Pacific Veterinary Services Industry Volume (K Unit) Forecast, by Application 2019 & 2032
- Table 45: Global Veterinary Services Industry Revenue Million Forecast, by Country 2019 & 2032
- Table 46: Global Veterinary Services Industry Volume K Unit Forecast, by Country 2019 & 2032
- Table 47: GCC Veterinary Services Industry Revenue (Million) Forecast, by Application 2019 & 2032
- Table 48: GCC Veterinary Services Industry Volume (K Unit) Forecast, by Application 2019 & 2032
- Table 49: South Africa Veterinary Services Industry Revenue (Million) Forecast, by Application 2019 & 2032
- Table 50: South Africa Veterinary Services Industry Volume (K Unit) Forecast, by Application 2019 & 2032
- Table 51: Rest of Middle East and Africa Veterinary Services Industry Revenue (Million) Forecast, by Application 2019 & 2032
- Table 52: Rest of Middle East and Africa Veterinary Services Industry Volume (K Unit) Forecast, by Application 2019 & 2032
- Table 53: Global Veterinary Services Industry Revenue Million Forecast, by Country 2019 & 2032
- Table 54: Global Veterinary Services Industry Volume K Unit Forecast, by Country 2019 & 2032
- Table 55: Brazil Veterinary Services Industry Revenue (Million) Forecast, by Application 2019 & 2032
- Table 56: Brazil Veterinary Services Industry Volume (K Unit) Forecast, by Application 2019 & 2032
- Table 57: Argentina Veterinary Services Industry Revenue (Million) Forecast, by Application 2019 & 2032
- Table 58: Argentina Veterinary Services Industry Volume (K Unit) Forecast, by Application 2019 & 2032
- Table 59: Rest of South America Veterinary Services Industry Revenue (Million) Forecast, by Application 2019 & 2032
- Table 60: Rest of South America Veterinary Services Industry Volume (K Unit) Forecast, by Application 2019 & 2032
- Table 61: Global Veterinary Services Industry Revenue Million Forecast, by Animal Type 2019 & 2032
- Table 62: Global Veterinary Services Industry Volume K Unit Forecast, by Animal Type 2019 & 2032
- Table 63: Global Veterinary Services Industry Revenue Million Forecast, by Type of Care 2019 & 2032
- Table 64: Global Veterinary Services Industry Volume K Unit Forecast, by Type of Care 2019 & 2032
- Table 65: Global Veterinary Services Industry Revenue Million Forecast, by Country 2019 & 2032
- Table 66: Global Veterinary Services Industry Volume K Unit Forecast, by Country 2019 & 2032
- Table 67: United States Veterinary Services Industry Revenue (Million) Forecast, by Application 2019 & 2032
- Table 68: United States Veterinary Services Industry Volume (K Unit) Forecast, by Application 2019 & 2032
- Table 69: Canada Veterinary Services Industry Revenue (Million) Forecast, by Application 2019 & 2032
- Table 70: Canada Veterinary Services Industry Volume (K Unit) Forecast, by Application 2019 & 2032
- Table 71: Mexico Veterinary Services Industry Revenue (Million) Forecast, by Application 2019 & 2032
- Table 72: Mexico Veterinary Services Industry Volume (K Unit) Forecast, by Application 2019 & 2032
- Table 73: Global Veterinary Services Industry Revenue Million Forecast, by Animal Type 2019 & 2032
- Table 74: Global Veterinary Services Industry Volume K Unit Forecast, by Animal Type 2019 & 2032
- Table 75: Global Veterinary Services Industry Revenue Million Forecast, by Type of Care 2019 & 2032
- Table 76: Global Veterinary Services Industry Volume K Unit Forecast, by Type of Care 2019 & 2032
- Table 77: Global Veterinary Services Industry Revenue Million Forecast, by Country 2019 & 2032
- Table 78: Global Veterinary Services Industry Volume K Unit Forecast, by Country 2019 & 2032
- Table 79: Germany Veterinary Services Industry Revenue (Million) Forecast, by Application 2019 & 2032
- Table 80: Germany Veterinary Services Industry Volume (K Unit) Forecast, by Application 2019 & 2032
- Table 81: United Kingdom Veterinary Services Industry Revenue (Million) Forecast, by Application 2019 & 2032
- Table 82: United Kingdom Veterinary Services Industry Volume (K Unit) Forecast, by Application 2019 & 2032
- Table 83: France Veterinary Services Industry Revenue (Million) Forecast, by Application 2019 & 2032
- Table 84: France Veterinary Services Industry Volume (K Unit) Forecast, by Application 2019 & 2032
- Table 85: Italy Veterinary Services Industry Revenue (Million) Forecast, by Application 2019 & 2032
- Table 86: Italy Veterinary Services Industry Volume (K Unit) Forecast, by Application 2019 & 2032
- Table 87: Spain Veterinary Services Industry Revenue (Million) Forecast, by Application 2019 & 2032
- Table 88: Spain Veterinary Services Industry Volume (K Unit) Forecast, by Application 2019 & 2032
- Table 89: Rest of Europe Veterinary Services Industry Revenue (Million) Forecast, by Application 2019 & 2032
- Table 90: Rest of Europe Veterinary Services Industry Volume (K Unit) Forecast, by Application 2019 & 2032
- Table 91: Global Veterinary Services Industry Revenue Million Forecast, by Animal Type 2019 & 2032
- Table 92: Global Veterinary Services Industry Volume K Unit Forecast, by Animal Type 2019 & 2032
- Table 93: Global Veterinary Services Industry Revenue Million Forecast, by Type of Care 2019 & 2032
- Table 94: Global Veterinary Services Industry Volume K Unit Forecast, by Type of Care 2019 & 2032
- Table 95: Global Veterinary Services Industry Revenue Million Forecast, by Country 2019 & 2032
- Table 96: Global Veterinary Services Industry Volume K Unit Forecast, by Country 2019 & 2032
- Table 97: China Veterinary Services Industry Revenue (Million) Forecast, by Application 2019 & 2032
- Table 98: China Veterinary Services Industry Volume (K Unit) Forecast, by Application 2019 & 2032
- Table 99: Japan Veterinary Services Industry Revenue (Million) Forecast, by Application 2019 & 2032
- Table 100: Japan Veterinary Services Industry Volume (K Unit) Forecast, by Application 2019 & 2032
- Table 101: India Veterinary Services Industry Revenue (Million) Forecast, by Application 2019 & 2032
- Table 102: India Veterinary Services Industry Volume (K Unit) Forecast, by Application 2019 & 2032
- Table 103: Australia Veterinary Services Industry Revenue (Million) Forecast, by Application 2019 & 2032
- Table 104: Australia Veterinary Services Industry Volume (K Unit) Forecast, by Application 2019 & 2032
- Table 105: South Korea Veterinary Services Industry Revenue (Million) Forecast, by Application 2019 & 2032
- Table 106: South Korea Veterinary Services Industry Volume (K Unit) Forecast, by Application 2019 & 2032
- Table 107: Rest of Asia Pacific Veterinary Services Industry Revenue (Million) Forecast, by Application 2019 & 2032
- Table 108: Rest of Asia Pacific Veterinary Services Industry Volume (K Unit) Forecast, by Application 2019 & 2032
- Table 109: Global Veterinary Services Industry Revenue Million Forecast, by Animal Type 2019 & 2032
- Table 110: Global Veterinary Services Industry Volume K Unit Forecast, by Animal Type 2019 & 2032
- Table 111: Global Veterinary Services Industry Revenue Million Forecast, by Type of Care 2019 & 2032
- Table 112: Global Veterinary Services Industry Volume K Unit Forecast, by Type of Care 2019 & 2032
- Table 113: Global Veterinary Services Industry Revenue Million Forecast, by Country 2019 & 2032
- Table 114: Global Veterinary Services Industry Volume K Unit Forecast, by Country 2019 & 2032
- Table 115: GCC Veterinary Services Industry Revenue (Million) Forecast, by Application 2019 & 2032
- Table 116: GCC Veterinary Services Industry Volume (K Unit) Forecast, by Application 2019 & 2032
- Table 117: South Africa Veterinary Services Industry Revenue (Million) Forecast, by Application 2019 & 2032
- Table 118: South Africa Veterinary Services Industry Volume (K Unit) Forecast, by Application 2019 & 2032
- Table 119: Rest of Middle East and Africa Veterinary Services Industry Revenue (Million) Forecast, by Application 2019 & 2032
- Table 120: Rest of Middle East and Africa Veterinary Services Industry Volume (K Unit) Forecast, by Application 2019 & 2032
- Table 121: Global Veterinary Services Industry Revenue Million Forecast, by Animal Type 2019 & 2032
- Table 122: Global Veterinary Services Industry Volume K Unit Forecast, by Animal Type 2019 & 2032
- Table 123: Global Veterinary Services Industry Revenue Million Forecast, by Type of Care 2019 & 2032
- Table 124: Global Veterinary Services Industry Volume K Unit Forecast, by Type of Care 2019 & 2032
- Table 125: Global Veterinary Services Industry Revenue Million Forecast, by Country 2019 & 2032
- Table 126: Global Veterinary Services Industry Volume K Unit Forecast, by Country 2019 & 2032
- Table 127: Brazil Veterinary Services Industry Revenue (Million) Forecast, by Application 2019 & 2032
- Table 128: Brazil Veterinary Services Industry Volume (K Unit) Forecast, by Application 2019 & 2032
- Table 129: Argentina Veterinary Services Industry Revenue (Million) Forecast, by Application 2019 & 2032
- Table 130: Argentina Veterinary Services Industry Volume (K Unit) Forecast, by Application 2019 & 2032
- Table 131: Rest of South America Veterinary Services Industry Revenue (Million) Forecast, by Application 2019 & 2032
- Table 132: Rest of South America Veterinary Services Industry Volume (K Unit) Forecast, by Application 2019 & 2032
Frequently Asked Questions
1. What is the projected Compound Annual Growth Rate (CAGR) of the Veterinary Services Industry?
The projected CAGR is approximately 5.59%.
2. Which companies are prominent players in the Veterinary Services Industry?
Key companies in the market include Zoetis Services LLC, Elanco, Boehringer Ingelheim GmbH, IDEXX Laboratories Inc, Indian Immunologicals Ltd, Vetoquinol S A, Hester Bioscience, Heska Corp, Ceva Sant Animale, Phibro Animal Health, Virbac, Merck Animal Health.
3. What are the main segments of the Veterinary Services Industry?
The market segments include Animal Type, Type of Care.
4. Can you provide details about the market size?
The market size is estimated to be USD 88.22 Million as of 2022.
5. What are some drivers contributing to market growth?
Rising Chronic Diseases and Awareness Regarding Veterinary Care; Increasing Initiatives by Governments and Animal Welfare Associations in Different Countries.
6. What are the notable trends driving market growth?
Companion Animal Segment is Expected to Hold Significant Market Share in the Market Over the Forecast Period.
7. Are there any restraints impacting market growth?
Increasing Costs of Animal Care Product and Veterinary Services.
8. Can you provide examples of recent developments in the market?
April 2022: Animalcare launched Plaqtiv+, a range of dental care products for cats and dogs designed to reduce calculus formation.
9. What pricing options are available for accessing the report?
Pricing options include single-user, multi-user, and enterprise licenses priced at USD 4750, USD 5250, and USD 8750 respectively.
10. Is the market size provided in terms of value or volume?
The market size is provided in terms of value, measured in Million and volume, measured in K Unit.
11. Are there any specific market keywords associated with the report?
Yes, the market keyword associated with the report is "Veterinary Services Industry," which aids in identifying and referencing the specific market segment covered.
12. How do I determine which pricing option suits my needs best?
The pricing options vary based on user requirements and access needs. Individual users may opt for single-user licenses, while businesses requiring broader access may choose multi-user or enterprise licenses for cost-effective access to the report.
13. Are there any additional resources or data provided in the Veterinary Services Industry report?
While the report offers comprehensive insights, it's advisable to review the specific contents or supplementary materials provided to ascertain if additional resources or data are available.
14. How can I stay updated on further developments or reports in the Veterinary Services Industry?
To stay informed about further developments, trends, and reports in the Veterinary Services Industry, consider subscribing to industry newsletters, following relevant companies and organizations, or regularly checking reputable industry news sources and publications.
Methodology
Step 1 - Identification of Relevant Samples Size from Population Database


Step 2 - Approaches for Defining Global Market Size (Value, Volume* & Price*)

Note*: In applicable scenarios
Step 3 - Data Sources
Primary Research
- Web Analytics
- Survey Reports
- Research Institute
- Latest Research Reports
- Opinion Leaders
Secondary Research
- Annual Reports
- White Paper
- Latest Press Release
- Industry Association
- Paid Database
- Investor Presentations

Step 4 - Data Triangulation
Involves using different sources of information in order to increase the validity of a study
These sources are likely to be stakeholders in a program - participants, other researchers, program staff, other community members, and so on.
Then we put all data in single framework & apply various statistical tools to find out the dynamic on the market.
During the analysis stage, feedback from the stakeholder groups would be compared to determine areas of agreement as well as areas of divergence


