
Key Insights
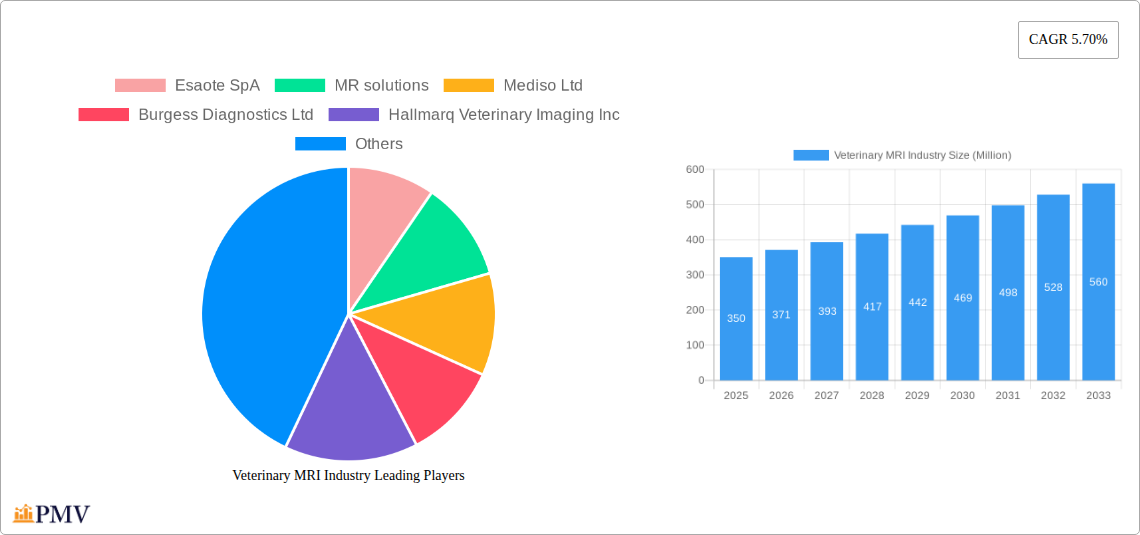
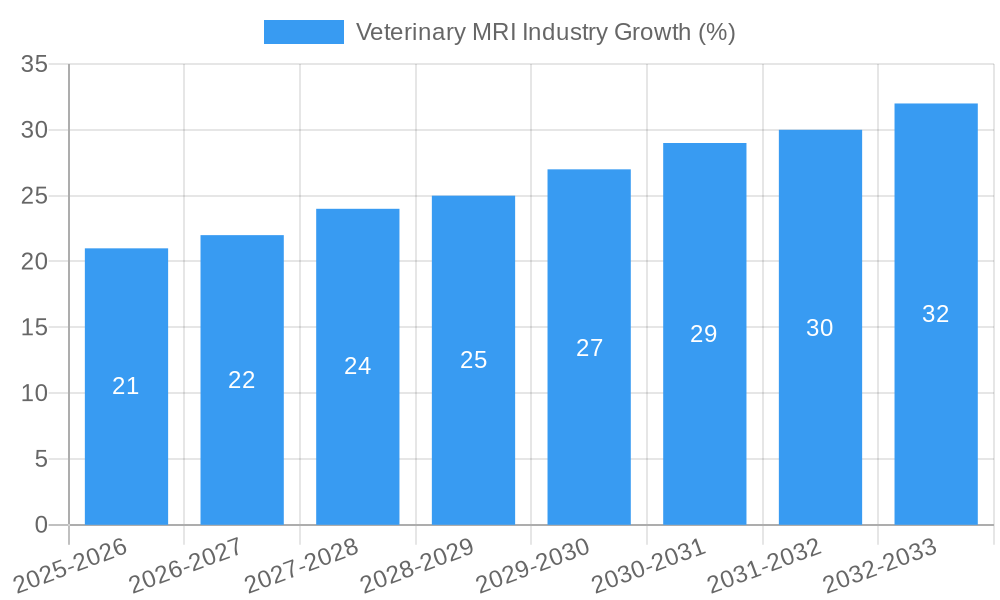
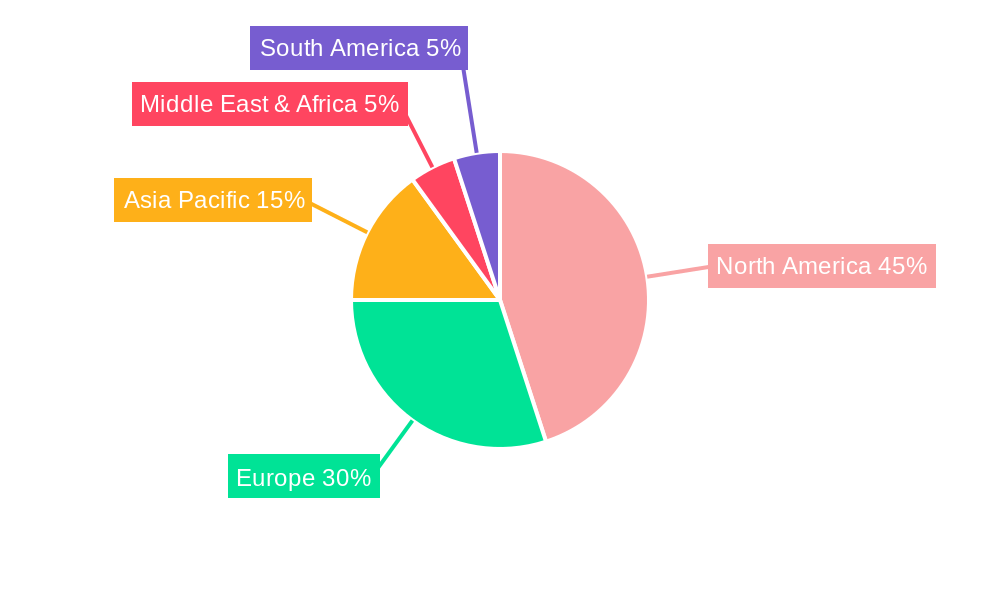
The veterinary MRI market is experiencing robust growth, driven by increasing pet ownership, rising pet healthcare expenditure, and advancements in MRI technology leading to improved diagnostic capabilities and reduced procedure times. The market's Compound Annual Growth Rate (CAGR) of 5.70% from 2019 to 2024 suggests a strong trajectory, projected to continue into the forecast period (2025-2033). While precise market size figures for 2025 aren't provided, considering the historical CAGR and assuming a continuation of this trend, a reasonable estimate for the 2025 market size could be in the range of $300-400 million USD. This growth is further fueled by the increasing demand for sophisticated diagnostic tools in veterinary medicine, particularly in specialized fields like cardiology, oncology, and neurology for both small and large animals. Technological advancements such as higher-field-strength magnets and improved software are further enhancing the quality and speed of image acquisition and analysis, driving market expansion. Segmentation within the market is diverse, with MRI systems themselves commanding the largest share, followed by imaging software and other ancillary products and services. Geographically, North America and Europe are currently leading the market due to higher veterinary healthcare spending and technological infrastructure, but the Asia-Pacific region is predicted to witness significant growth in the coming years fueled by rising disposable incomes and increased awareness of advanced veterinary care. However, high equipment costs and the need for specialized personnel remain key restraints to market penetration, particularly in developing regions.
The competitive landscape is dynamic, with a mix of established players like Esaote SpA, Mindray, and Bruker Corporation, alongside specialized veterinary imaging companies such as Hallmarq Veterinary Imaging. The ongoing competition promotes innovation and drives down costs, making veterinary MRI more accessible. Future growth will depend on factors like continued technological advancement, increased adoption of advanced imaging techniques by veterinary practitioners, and expansion into emerging markets. The development of portable and cost-effective MRI systems holds significant potential for increasing market reach and affordability. Further research into specific animal applications and the development of tailored imaging protocols will further contribute to market expansion.
Veterinary MRI Industry Market Report: 2019-2033
This comprehensive report provides an in-depth analysis of the Veterinary MRI industry, offering crucial insights for stakeholders seeking to navigate this dynamic market. The study period covers 2019-2033, with a base year of 2025 and a forecast period of 2025-2033. The report's analysis is grounded in historical data from 2019-2024, providing a robust foundation for future projections. The total market value is estimated at $XX Million in 2025 and is projected to reach $XX Million by 2033. This report is essential for investors, manufacturers, veterinary professionals, and anyone involved in this rapidly evolving sector.
Veterinary MRI Industry Market Structure & Competitive Dynamics
The veterinary MRI market exhibits a moderately concentrated structure, with key players like Esaote SpA, MR solutions, Mediso Ltd, Burgess Diagnostics Ltd, Hallmarq Veterinary Imaging Inc, Shenzhen Mindray Bio-Medical Electronics Co, Universal Medical Systems Inc, Imotek International Ltd, and Bruker Corporation holding significant market share. Market share data for 2024 suggests Esaote SpA holds approximately 15%, followed by Hallmarq Veterinary Imaging Inc at 12%, and MR solutions at 10%. The remaining market share is distributed among other players. Innovation ecosystems are primarily driven by advancements in MRI technology, including improved image quality, faster scan times, and more user-friendly interfaces. Regulatory frameworks vary across geographies, impacting market access and product approvals. Product substitutes, such as ultrasound and X-ray, continue to compete for market share. End-user trends show a growing preference for non-invasive diagnostic techniques, benefiting the adoption of veterinary MRI. M&A activity in the sector has been moderate, with deal values averaging $XX Million in recent years, primarily driven by strategic acquisitions aimed at expanding product portfolios and geographic reach. Several smaller acquisitions, valued at less than $5 Million individually, have also contributed to this landscape.
Veterinary MRI Industry Industry Trends & Insights
The veterinary MRI market is experiencing robust growth, driven by several factors. The increasing prevalence of chronic diseases in companion animals, coupled with rising pet ownership and disposable income, fuels demand for advanced diagnostic imaging. Technological advancements, particularly in MRI technology itself, have resulted in improved image quality, reduced scan times, and enhanced diagnostic capabilities. This has led to a substantial increase in market penetration. The compound annual growth rate (CAGR) is estimated at XX% during the forecast period (2025-2033). Consumer preferences are shifting toward minimally invasive procedures and higher-quality diagnostic imaging, further boosting the adoption of veterinary MRI. Competitive dynamics are characterized by ongoing innovation, strategic partnerships, and an increasing focus on providing comprehensive diagnostic solutions. The market is witnessing a growing trend towards specialized veterinary MRI systems catering to specific animal types (small and large animals) and applications (cardiology, oncology, etc.). This is also reflected in a shift towards cloud based reporting and remote monitoring of patients.
Dominant Markets & Segments in Veterinary MRI Industry
Leading Region: North America currently dominates the veterinary MRI market, driven by high pet ownership rates, advanced healthcare infrastructure, and high per capita income. Europe follows closely, although with slower growth.
Leading Country: The United States holds the largest share of the global market, followed by Germany and the United Kingdom.
Dominant Product Type: MRI Systems constitute the largest segment, holding over 70% of the total market value. Imaging software contributes a significant portion, while "others" includes associated services, consumables and maintenance.
Dominant Application: Oncology and orthopedics are major application segments due to the high incidence of these conditions in animals and the requirement for precise imaging.
Dominant Animal Type: Small animals (dogs and cats) represent a larger segment than large animals due to higher pet ownership and increased affordability of veterinary care.
Key Drivers:
- North America: Strong pet ownership rates, advanced healthcare infrastructure, high disposable income, and favorable regulatory environment.
- Europe: Growing pet humanization, increased pet insurance coverage, and rising veterinary healthcare expenditure.
The dominance of these segments is primarily attributed to a combination of factors, including the higher incidence of specific diseases in these animal types, the availability of specialized MRI systems, and the growing awareness among veterinarians regarding the benefits of MRI for improved diagnostics and treatment planning.
Veterinary MRI Industry Product Innovations
Recent innovations in veterinary MRI technology have focused on improving image quality, reducing scan times, and enhancing user-friendliness. Manufacturers are introducing systems with higher magnetic field strengths, advanced imaging sequences, and sophisticated image processing algorithms. These improvements lead to better diagnostic accuracy, which is reflected in higher market penetration and increased sales of higher-end systems. The integration of artificial intelligence (AI) and machine learning (ML) capabilities for automated image analysis is also gaining traction, potentially streamlining workflows and enhancing diagnostic efficiency. This trend facilitates greater efficiency and profitability for clinics whilst improving patient care.
Report Segmentation & Scope
This report segments the veterinary MRI market by:
Product Type: MRI Systems, Imaging Software, Others (consumables, services). MRI Systems are projected to maintain the highest CAGR due to technological advancements and demand. Imaging Software shows strong growth driven by data analytics and cloud integration.
Application: Cardiology, Oncology, Neurology, Orthopedics, Other Applications. Oncology and Orthopedics are expected to experience the fastest growth due to the increasing incidence of related diseases in animals.
Animal Type: Small Animals, Large Animals. Small animals will continue to be the largest segment due to higher pet ownership.
Each segment's growth projection, market size, and competitive dynamics are analyzed in detail within the report.
Key Drivers of Veterinary MRI Industry Growth
Several key factors drive the growth of the veterinary MRI industry: increasing pet ownership and expenditure on pet health, rising prevalence of chronic diseases requiring advanced diagnostics, technological advancements leading to improved image quality and reduced scan times, and growing acceptance of MRI as a gold standard imaging modality within veterinary practice. Further, government initiatives promoting animal welfare and advancements in veterinary medicine are key drivers.
Challenges in the Veterinary MRI Industry Sector
The veterinary MRI industry faces several challenges, including the high cost of MRI systems, which can limit access for smaller veterinary practices. Regulatory hurdles and varying approvals across different countries also pose a challenge. Supply chain disruptions, particularly in procuring specialized components and skilled technicians, can impact production and service delivery. Intense competition from established players and emerging technologies, like advanced ultrasound, presents a significant competitive pressure. These factors lead to fluctuating market prices and necessitate strategic pricing decisions within the sector.
Leading Players in the Veterinary MRI Industry Market
- Esaote SpA
- MR solutions
- Mediso Ltd
- Burgess Diagnostics Ltd
- Hallmarq Veterinary Imaging Inc
- Shenzhen Mindray Bio-Medical Electronics Co
- Universal Medical Systems Inc
- Imotek International Ltd
- Bruker Corporation
Key Developments in Veterinary MRI Industry Sector
- August 2021: National Veterinary Associates and Ethos Veterinary Health partnered, potentially influencing the adoption of advanced diagnostic tools within their combined network.
- April 2022: Launch of three new Veterinary Urgent Care Clinics in San Diego, indicating increased investment in veterinary healthcare infrastructure and potentially greater demand for diagnostic imaging services.
Strategic Veterinary MRI Industry Market Outlook
The veterinary MRI market is poised for continued growth, driven by ongoing technological advancements, expanding veterinary healthcare infrastructure, and increasing pet owner awareness. Strategic opportunities exist for companies focused on innovation, particularly in AI-powered image analysis and development of cost-effective MRI systems. Furthermore, partnerships with veterinary clinics and hospitals could enhance market penetration and drive adoption. Companies providing comprehensive solutions combining MRI with other diagnostic modalities will be well-positioned to capitalize on this market’s potential.
Veterinary MRI Industry Segmentation
-
1. Product Type
- 1.1. MRI Systems
- 1.2. Imaging Software
- 1.3. Others
-
2. Application
- 2.1. Cardiology
- 2.2. Oncology
- 2.3. Neurology
- 2.4. Orthopedics
- 2.5. Other Applications
-
3. Animal Type
- 3.1. Small Animals
- 3.2. Large Animals
Veterinary MRI Industry Segmentation By Geography
-
1. North America
- 1.1. United States
- 1.2. Canada
- 1.3. Mexico
-
2. Europe
- 2.1. United Kingdom
- 2.2. Germany
- 2.3. France
- 2.4. Italy
- 2.5. Spain
- 2.6. Rest of Europe
-
3. Asia Pacific
- 3.1. China
- 3.2. Japan
- 3.3. India
- 3.4. Australia
- 3.5. South Korea
- 3.6. Rest of Asia Pacific
-
4. Middle East and Africa
- 4.1. GCC
- 4.2. South Africa
- 4.3. Rest of Middle East and Africa
-
5. South America
- 5.1. Brazil
- 5.2. Argentina
- 5.3. Rest of South America
Veterinary MRI Industry REPORT HIGHLIGHTS
| Aspects | Details |
|---|---|
| Study Period | 2019-2033 |
| Base Year | 2024 |
| Estimated Year | 2025 |
| Forecast Period | 2025-2033 |
| Historical Period | 2019-2024 |
| Growth Rate | CAGR of 5.70% from 2019-2033 |
| Segmentation |
|
Table of Contents
- 1. Introduction
- 1.1. Research Scope
- 1.2. Market Segmentation
- 1.3. Research Methodology
- 1.4. Definitions and Assumptions
- 2. Executive Summary
- 2.1. Introduction
- 3. Market Dynamics
- 3.1. Introduction
- 3.2. Market Drivers
- 3.2.1. Increased Pet Ownership and Initiatives for Animal Health; Technological Advancements in Veterinary Imaging
- 3.3. Market Restrains
- 3.3.1. High Cost of MRI Systems; Lack of Skilled Veterinarians
- 3.4. Market Trends
- 3.4.1. Cardiology is Expected to Witness Healthy Growth in the Application Segment
- 4. Market Factor Analysis
- 4.1. Porters Five Forces
- 4.2. Supply/Value Chain
- 4.3. PESTEL analysis
- 4.4. Market Entropy
- 4.5. Patent/Trademark Analysis
- 5. Global Veterinary MRI Industry Analysis, Insights and Forecast, 2019-2031
- 5.1. Market Analysis, Insights and Forecast - by Product Type
- 5.1.1. MRI Systems
- 5.1.2. Imaging Software
- 5.1.3. Others
- 5.2. Market Analysis, Insights and Forecast - by Application
- 5.2.1. Cardiology
- 5.2.2. Oncology
- 5.2.3. Neurology
- 5.2.4. Orthopedics
- 5.2.5. Other Applications
- 5.3. Market Analysis, Insights and Forecast - by Animal Type
- 5.3.1. Small Animals
- 5.3.2. Large Animals
- 5.4. Market Analysis, Insights and Forecast - by Region
- 5.4.1. North America
- 5.4.2. Europe
- 5.4.3. Asia Pacific
- 5.4.4. Middle East and Africa
- 5.4.5. South America
- 5.1. Market Analysis, Insights and Forecast - by Product Type
- 6. North America Veterinary MRI Industry Analysis, Insights and Forecast, 2019-2031
- 6.1. Market Analysis, Insights and Forecast - by Product Type
- 6.1.1. MRI Systems
- 6.1.2. Imaging Software
- 6.1.3. Others
- 6.2. Market Analysis, Insights and Forecast - by Application
- 6.2.1. Cardiology
- 6.2.2. Oncology
- 6.2.3. Neurology
- 6.2.4. Orthopedics
- 6.2.5. Other Applications
- 6.3. Market Analysis, Insights and Forecast - by Animal Type
- 6.3.1. Small Animals
- 6.3.2. Large Animals
- 6.1. Market Analysis, Insights and Forecast - by Product Type
- 7. Europe Veterinary MRI Industry Analysis, Insights and Forecast, 2019-2031
- 7.1. Market Analysis, Insights and Forecast - by Product Type
- 7.1.1. MRI Systems
- 7.1.2. Imaging Software
- 7.1.3. Others
- 7.2. Market Analysis, Insights and Forecast - by Application
- 7.2.1. Cardiology
- 7.2.2. Oncology
- 7.2.3. Neurology
- 7.2.4. Orthopedics
- 7.2.5. Other Applications
- 7.3. Market Analysis, Insights and Forecast - by Animal Type
- 7.3.1. Small Animals
- 7.3.2. Large Animals
- 7.1. Market Analysis, Insights and Forecast - by Product Type
- 8. Asia Pacific Veterinary MRI Industry Analysis, Insights and Forecast, 2019-2031
- 8.1. Market Analysis, Insights and Forecast - by Product Type
- 8.1.1. MRI Systems
- 8.1.2. Imaging Software
- 8.1.3. Others
- 8.2. Market Analysis, Insights and Forecast - by Application
- 8.2.1. Cardiology
- 8.2.2. Oncology
- 8.2.3. Neurology
- 8.2.4. Orthopedics
- 8.2.5. Other Applications
- 8.3. Market Analysis, Insights and Forecast - by Animal Type
- 8.3.1. Small Animals
- 8.3.2. Large Animals
- 8.1. Market Analysis, Insights and Forecast - by Product Type
- 9. Middle East and Africa Veterinary MRI Industry Analysis, Insights and Forecast, 2019-2031
- 9.1. Market Analysis, Insights and Forecast - by Product Type
- 9.1.1. MRI Systems
- 9.1.2. Imaging Software
- 9.1.3. Others
- 9.2. Market Analysis, Insights and Forecast - by Application
- 9.2.1. Cardiology
- 9.2.2. Oncology
- 9.2.3. Neurology
- 9.2.4. Orthopedics
- 9.2.5. Other Applications
- 9.3. Market Analysis, Insights and Forecast - by Animal Type
- 9.3.1. Small Animals
- 9.3.2. Large Animals
- 9.1. Market Analysis, Insights and Forecast - by Product Type
- 10. South America Veterinary MRI Industry Analysis, Insights and Forecast, 2019-2031
- 10.1. Market Analysis, Insights and Forecast - by Product Type
- 10.1.1. MRI Systems
- 10.1.2. Imaging Software
- 10.1.3. Others
- 10.2. Market Analysis, Insights and Forecast - by Application
- 10.2.1. Cardiology
- 10.2.2. Oncology
- 10.2.3. Neurology
- 10.2.4. Orthopedics
- 10.2.5. Other Applications
- 10.3. Market Analysis, Insights and Forecast - by Animal Type
- 10.3.1. Small Animals
- 10.3.2. Large Animals
- 10.1. Market Analysis, Insights and Forecast - by Product Type
- 11. North America Veterinary MRI Industry Analysis, Insights and Forecast, 2019-2031
- 11.1. Market Analysis, Insights and Forecast - By Country/Sub-region
- 11.1.1 United States
- 11.1.2 Canada
- 11.1.3 Mexico
- 12. Europe Veterinary MRI Industry Analysis, Insights and Forecast, 2019-2031
- 12.1. Market Analysis, Insights and Forecast - By Country/Sub-region
- 12.1.1 United Kingdom
- 12.1.2 Germany
- 12.1.3 France
- 12.1.4 Italy
- 12.1.5 Spain
- 12.1.6 Rest of Europe
- 13. Asia Pacific Veterinary MRI Industry Analysis, Insights and Forecast, 2019-2031
- 13.1. Market Analysis, Insights and Forecast - By Country/Sub-region
- 13.1.1 China
- 13.1.2 Japan
- 13.1.3 India
- 13.1.4 Australia
- 13.1.5 South Korea
- 13.1.6 Rest of Asia Pacific
- 14. Middle East and Africa Veterinary MRI Industry Analysis, Insights and Forecast, 2019-2031
- 14.1. Market Analysis, Insights and Forecast - By Country/Sub-region
- 14.1.1 GCC
- 14.1.2 South Africa
- 14.1.3 Rest of Middle East and Africa
- 15. South America Veterinary MRI Industry Analysis, Insights and Forecast, 2019-2031
- 15.1. Market Analysis, Insights and Forecast - By Country/Sub-region
- 15.1.1 Brazil
- 15.1.2 Argentina
- 15.1.3 Rest of South America
- 16. Competitive Analysis
- 16.1. Global Market Share Analysis 2024
- 16.2. Company Profiles
- 16.2.1 Esaote SpA
- 16.2.1.1. Overview
- 16.2.1.2. Products
- 16.2.1.3. SWOT Analysis
- 16.2.1.4. Recent Developments
- 16.2.1.5. Financials (Based on Availability)
- 16.2.2 MR solutions
- 16.2.2.1. Overview
- 16.2.2.2. Products
- 16.2.2.3. SWOT Analysis
- 16.2.2.4. Recent Developments
- 16.2.2.5. Financials (Based on Availability)
- 16.2.3 Mediso Ltd
- 16.2.3.1. Overview
- 16.2.3.2. Products
- 16.2.3.3. SWOT Analysis
- 16.2.3.4. Recent Developments
- 16.2.3.5. Financials (Based on Availability)
- 16.2.4 Burgess Diagnostics Ltd
- 16.2.4.1. Overview
- 16.2.4.2. Products
- 16.2.4.3. SWOT Analysis
- 16.2.4.4. Recent Developments
- 16.2.4.5. Financials (Based on Availability)
- 16.2.5 Hallmarq Veterinary Imaging Inc
- 16.2.5.1. Overview
- 16.2.5.2. Products
- 16.2.5.3. SWOT Analysis
- 16.2.5.4. Recent Developments
- 16.2.5.5. Financials (Based on Availability)
- 16.2.6 Shenzhen Mindray Bio-Medical Electronics Co
- 16.2.6.1. Overview
- 16.2.6.2. Products
- 16.2.6.3. SWOT Analysis
- 16.2.6.4. Recent Developments
- 16.2.6.5. Financials (Based on Availability)
- 16.2.7 Universal Medical Systems Inc
- 16.2.7.1. Overview
- 16.2.7.2. Products
- 16.2.7.3. SWOT Analysis
- 16.2.7.4. Recent Developments
- 16.2.7.5. Financials (Based on Availability)
- 16.2.8 Imotek International Ltd
- 16.2.8.1. Overview
- 16.2.8.2. Products
- 16.2.8.3. SWOT Analysis
- 16.2.8.4. Recent Developments
- 16.2.8.5. Financials (Based on Availability)
- 16.2.9 Bruker Corporation
- 16.2.9.1. Overview
- 16.2.9.2. Products
- 16.2.9.3. SWOT Analysis
- 16.2.9.4. Recent Developments
- 16.2.9.5. Financials (Based on Availability)
- 16.2.1 Esaote SpA
List of Figures
- Figure 1: Global Veterinary MRI Industry Revenue Breakdown (Million, %) by Region 2024 & 2032
- Figure 2: North America Veterinary MRI Industry Revenue (Million), by Country 2024 & 2032
- Figure 3: North America Veterinary MRI Industry Revenue Share (%), by Country 2024 & 2032
- Figure 4: Europe Veterinary MRI Industry Revenue (Million), by Country 2024 & 2032
- Figure 5: Europe Veterinary MRI Industry Revenue Share (%), by Country 2024 & 2032
- Figure 6: Asia Pacific Veterinary MRI Industry Revenue (Million), by Country 2024 & 2032
- Figure 7: Asia Pacific Veterinary MRI Industry Revenue Share (%), by Country 2024 & 2032
- Figure 8: Middle East and Africa Veterinary MRI Industry Revenue (Million), by Country 2024 & 2032
- Figure 9: Middle East and Africa Veterinary MRI Industry Revenue Share (%), by Country 2024 & 2032
- Figure 10: South America Veterinary MRI Industry Revenue (Million), by Country 2024 & 2032
- Figure 11: South America Veterinary MRI Industry Revenue Share (%), by Country 2024 & 2032
- Figure 12: North America Veterinary MRI Industry Revenue (Million), by Product Type 2024 & 2032
- Figure 13: North America Veterinary MRI Industry Revenue Share (%), by Product Type 2024 & 2032
- Figure 14: North America Veterinary MRI Industry Revenue (Million), by Application 2024 & 2032
- Figure 15: North America Veterinary MRI Industry Revenue Share (%), by Application 2024 & 2032
- Figure 16: North America Veterinary MRI Industry Revenue (Million), by Animal Type 2024 & 2032
- Figure 17: North America Veterinary MRI Industry Revenue Share (%), by Animal Type 2024 & 2032
- Figure 18: North America Veterinary MRI Industry Revenue (Million), by Country 2024 & 2032
- Figure 19: North America Veterinary MRI Industry Revenue Share (%), by Country 2024 & 2032
- Figure 20: Europe Veterinary MRI Industry Revenue (Million), by Product Type 2024 & 2032
- Figure 21: Europe Veterinary MRI Industry Revenue Share (%), by Product Type 2024 & 2032
- Figure 22: Europe Veterinary MRI Industry Revenue (Million), by Application 2024 & 2032
- Figure 23: Europe Veterinary MRI Industry Revenue Share (%), by Application 2024 & 2032
- Figure 24: Europe Veterinary MRI Industry Revenue (Million), by Animal Type 2024 & 2032
- Figure 25: Europe Veterinary MRI Industry Revenue Share (%), by Animal Type 2024 & 2032
- Figure 26: Europe Veterinary MRI Industry Revenue (Million), by Country 2024 & 2032
- Figure 27: Europe Veterinary MRI Industry Revenue Share (%), by Country 2024 & 2032
- Figure 28: Asia Pacific Veterinary MRI Industry Revenue (Million), by Product Type 2024 & 2032
- Figure 29: Asia Pacific Veterinary MRI Industry Revenue Share (%), by Product Type 2024 & 2032
- Figure 30: Asia Pacific Veterinary MRI Industry Revenue (Million), by Application 2024 & 2032
- Figure 31: Asia Pacific Veterinary MRI Industry Revenue Share (%), by Application 2024 & 2032
- Figure 32: Asia Pacific Veterinary MRI Industry Revenue (Million), by Animal Type 2024 & 2032
- Figure 33: Asia Pacific Veterinary MRI Industry Revenue Share (%), by Animal Type 2024 & 2032
- Figure 34: Asia Pacific Veterinary MRI Industry Revenue (Million), by Country 2024 & 2032
- Figure 35: Asia Pacific Veterinary MRI Industry Revenue Share (%), by Country 2024 & 2032
- Figure 36: Middle East and Africa Veterinary MRI Industry Revenue (Million), by Product Type 2024 & 2032
- Figure 37: Middle East and Africa Veterinary MRI Industry Revenue Share (%), by Product Type 2024 & 2032
- Figure 38: Middle East and Africa Veterinary MRI Industry Revenue (Million), by Application 2024 & 2032
- Figure 39: Middle East and Africa Veterinary MRI Industry Revenue Share (%), by Application 2024 & 2032
- Figure 40: Middle East and Africa Veterinary MRI Industry Revenue (Million), by Animal Type 2024 & 2032
- Figure 41: Middle East and Africa Veterinary MRI Industry Revenue Share (%), by Animal Type 2024 & 2032
- Figure 42: Middle East and Africa Veterinary MRI Industry Revenue (Million), by Country 2024 & 2032
- Figure 43: Middle East and Africa Veterinary MRI Industry Revenue Share (%), by Country 2024 & 2032
- Figure 44: South America Veterinary MRI Industry Revenue (Million), by Product Type 2024 & 2032
- Figure 45: South America Veterinary MRI Industry Revenue Share (%), by Product Type 2024 & 2032
- Figure 46: South America Veterinary MRI Industry Revenue (Million), by Application 2024 & 2032
- Figure 47: South America Veterinary MRI Industry Revenue Share (%), by Application 2024 & 2032
- Figure 48: South America Veterinary MRI Industry Revenue (Million), by Animal Type 2024 & 2032
- Figure 49: South America Veterinary MRI Industry Revenue Share (%), by Animal Type 2024 & 2032
- Figure 50: South America Veterinary MRI Industry Revenue (Million), by Country 2024 & 2032
- Figure 51: South America Veterinary MRI Industry Revenue Share (%), by Country 2024 & 2032
List of Tables
- Table 1: Global Veterinary MRI Industry Revenue Million Forecast, by Region 2019 & 2032
- Table 2: Global Veterinary MRI Industry Revenue Million Forecast, by Product Type 2019 & 2032
- Table 3: Global Veterinary MRI Industry Revenue Million Forecast, by Application 2019 & 2032
- Table 4: Global Veterinary MRI Industry Revenue Million Forecast, by Animal Type 2019 & 2032
- Table 5: Global Veterinary MRI Industry Revenue Million Forecast, by Region 2019 & 2032
- Table 6: Global Veterinary MRI Industry Revenue Million Forecast, by Country 2019 & 2032
- Table 7: United States Veterinary MRI Industry Revenue (Million) Forecast, by Application 2019 & 2032
- Table 8: Canada Veterinary MRI Industry Revenue (Million) Forecast, by Application 2019 & 2032
- Table 9: Mexico Veterinary MRI Industry Revenue (Million) Forecast, by Application 2019 & 2032
- Table 10: Global Veterinary MRI Industry Revenue Million Forecast, by Country 2019 & 2032
- Table 11: United Kingdom Veterinary MRI Industry Revenue (Million) Forecast, by Application 2019 & 2032
- Table 12: Germany Veterinary MRI Industry Revenue (Million) Forecast, by Application 2019 & 2032
- Table 13: France Veterinary MRI Industry Revenue (Million) Forecast, by Application 2019 & 2032
- Table 14: Italy Veterinary MRI Industry Revenue (Million) Forecast, by Application 2019 & 2032
- Table 15: Spain Veterinary MRI Industry Revenue (Million) Forecast, by Application 2019 & 2032
- Table 16: Rest of Europe Veterinary MRI Industry Revenue (Million) Forecast, by Application 2019 & 2032
- Table 17: Global Veterinary MRI Industry Revenue Million Forecast, by Country 2019 & 2032
- Table 18: China Veterinary MRI Industry Revenue (Million) Forecast, by Application 2019 & 2032
- Table 19: Japan Veterinary MRI Industry Revenue (Million) Forecast, by Application 2019 & 2032
- Table 20: India Veterinary MRI Industry Revenue (Million) Forecast, by Application 2019 & 2032
- Table 21: Australia Veterinary MRI Industry Revenue (Million) Forecast, by Application 2019 & 2032
- Table 22: South Korea Veterinary MRI Industry Revenue (Million) Forecast, by Application 2019 & 2032
- Table 23: Rest of Asia Pacific Veterinary MRI Industry Revenue (Million) Forecast, by Application 2019 & 2032
- Table 24: Global Veterinary MRI Industry Revenue Million Forecast, by Country 2019 & 2032
- Table 25: GCC Veterinary MRI Industry Revenue (Million) Forecast, by Application 2019 & 2032
- Table 26: South Africa Veterinary MRI Industry Revenue (Million) Forecast, by Application 2019 & 2032
- Table 27: Rest of Middle East and Africa Veterinary MRI Industry Revenue (Million) Forecast, by Application 2019 & 2032
- Table 28: Global Veterinary MRI Industry Revenue Million Forecast, by Country 2019 & 2032
- Table 29: Brazil Veterinary MRI Industry Revenue (Million) Forecast, by Application 2019 & 2032
- Table 30: Argentina Veterinary MRI Industry Revenue (Million) Forecast, by Application 2019 & 2032
- Table 31: Rest of South America Veterinary MRI Industry Revenue (Million) Forecast, by Application 2019 & 2032
- Table 32: Global Veterinary MRI Industry Revenue Million Forecast, by Product Type 2019 & 2032
- Table 33: Global Veterinary MRI Industry Revenue Million Forecast, by Application 2019 & 2032
- Table 34: Global Veterinary MRI Industry Revenue Million Forecast, by Animal Type 2019 & 2032
- Table 35: Global Veterinary MRI Industry Revenue Million Forecast, by Country 2019 & 2032
- Table 36: United States Veterinary MRI Industry Revenue (Million) Forecast, by Application 2019 & 2032
- Table 37: Canada Veterinary MRI Industry Revenue (Million) Forecast, by Application 2019 & 2032
- Table 38: Mexico Veterinary MRI Industry Revenue (Million) Forecast, by Application 2019 & 2032
- Table 39: Global Veterinary MRI Industry Revenue Million Forecast, by Product Type 2019 & 2032
- Table 40: Global Veterinary MRI Industry Revenue Million Forecast, by Application 2019 & 2032
- Table 41: Global Veterinary MRI Industry Revenue Million Forecast, by Animal Type 2019 & 2032
- Table 42: Global Veterinary MRI Industry Revenue Million Forecast, by Country 2019 & 2032
- Table 43: United Kingdom Veterinary MRI Industry Revenue (Million) Forecast, by Application 2019 & 2032
- Table 44: Germany Veterinary MRI Industry Revenue (Million) Forecast, by Application 2019 & 2032
- Table 45: France Veterinary MRI Industry Revenue (Million) Forecast, by Application 2019 & 2032
- Table 46: Italy Veterinary MRI Industry Revenue (Million) Forecast, by Application 2019 & 2032
- Table 47: Spain Veterinary MRI Industry Revenue (Million) Forecast, by Application 2019 & 2032
- Table 48: Rest of Europe Veterinary MRI Industry Revenue (Million) Forecast, by Application 2019 & 2032
- Table 49: Global Veterinary MRI Industry Revenue Million Forecast, by Product Type 2019 & 2032
- Table 50: Global Veterinary MRI Industry Revenue Million Forecast, by Application 2019 & 2032
- Table 51: Global Veterinary MRI Industry Revenue Million Forecast, by Animal Type 2019 & 2032
- Table 52: Global Veterinary MRI Industry Revenue Million Forecast, by Country 2019 & 2032
- Table 53: China Veterinary MRI Industry Revenue (Million) Forecast, by Application 2019 & 2032
- Table 54: Japan Veterinary MRI Industry Revenue (Million) Forecast, by Application 2019 & 2032
- Table 55: India Veterinary MRI Industry Revenue (Million) Forecast, by Application 2019 & 2032
- Table 56: Australia Veterinary MRI Industry Revenue (Million) Forecast, by Application 2019 & 2032
- Table 57: South Korea Veterinary MRI Industry Revenue (Million) Forecast, by Application 2019 & 2032
- Table 58: Rest of Asia Pacific Veterinary MRI Industry Revenue (Million) Forecast, by Application 2019 & 2032
- Table 59: Global Veterinary MRI Industry Revenue Million Forecast, by Product Type 2019 & 2032
- Table 60: Global Veterinary MRI Industry Revenue Million Forecast, by Application 2019 & 2032
- Table 61: Global Veterinary MRI Industry Revenue Million Forecast, by Animal Type 2019 & 2032
- Table 62: Global Veterinary MRI Industry Revenue Million Forecast, by Country 2019 & 2032
- Table 63: GCC Veterinary MRI Industry Revenue (Million) Forecast, by Application 2019 & 2032
- Table 64: South Africa Veterinary MRI Industry Revenue (Million) Forecast, by Application 2019 & 2032
- Table 65: Rest of Middle East and Africa Veterinary MRI Industry Revenue (Million) Forecast, by Application 2019 & 2032
- Table 66: Global Veterinary MRI Industry Revenue Million Forecast, by Product Type 2019 & 2032
- Table 67: Global Veterinary MRI Industry Revenue Million Forecast, by Application 2019 & 2032
- Table 68: Global Veterinary MRI Industry Revenue Million Forecast, by Animal Type 2019 & 2032
- Table 69: Global Veterinary MRI Industry Revenue Million Forecast, by Country 2019 & 2032
- Table 70: Brazil Veterinary MRI Industry Revenue (Million) Forecast, by Application 2019 & 2032
- Table 71: Argentina Veterinary MRI Industry Revenue (Million) Forecast, by Application 2019 & 2032
- Table 72: Rest of South America Veterinary MRI Industry Revenue (Million) Forecast, by Application 2019 & 2032
Frequently Asked Questions
1. What is the projected Compound Annual Growth Rate (CAGR) of the Veterinary MRI Industry?
The projected CAGR is approximately 5.70%.
2. Which companies are prominent players in the Veterinary MRI Industry?
Key companies in the market include Esaote SpA, MR solutions, Mediso Ltd, Burgess Diagnostics Ltd, Hallmarq Veterinary Imaging Inc, Shenzhen Mindray Bio-Medical Electronics Co, Universal Medical Systems Inc, Imotek International Ltd, Bruker Corporation.
3. What are the main segments of the Veterinary MRI Industry?
The market segments include Product Type, Application, Animal Type.
4. Can you provide details about the market size?
The market size is estimated to be USD XX Million as of 2022.
5. What are some drivers contributing to market growth?
Increased Pet Ownership and Initiatives for Animal Health; Technological Advancements in Veterinary Imaging.
6. What are the notable trends driving market growth?
Cardiology is Expected to Witness Healthy Growth in the Application Segment.
7. Are there any restraints impacting market growth?
High Cost of MRI Systems; Lack of Skilled Veterinarians.
8. Can you provide examples of recent developments in the market?
In April 2022, three new purpose-built clinics Veterinary Urgent Care Clinics launched in San Diego in Rancho Peñasquitos, Oceanside, and Irvine in Orange County.
9. What pricing options are available for accessing the report?
Pricing options include single-user, multi-user, and enterprise licenses priced at USD 4750, USD 5250, and USD 8750 respectively.
10. Is the market size provided in terms of value or volume?
The market size is provided in terms of value, measured in Million.
11. Are there any specific market keywords associated with the report?
Yes, the market keyword associated with the report is "Veterinary MRI Industry," which aids in identifying and referencing the specific market segment covered.
12. How do I determine which pricing option suits my needs best?
The pricing options vary based on user requirements and access needs. Individual users may opt for single-user licenses, while businesses requiring broader access may choose multi-user or enterprise licenses for cost-effective access to the report.
13. Are there any additional resources or data provided in the Veterinary MRI Industry report?
While the report offers comprehensive insights, it's advisable to review the specific contents or supplementary materials provided to ascertain if additional resources or data are available.
14. How can I stay updated on further developments or reports in the Veterinary MRI Industry?
To stay informed about further developments, trends, and reports in the Veterinary MRI Industry, consider subscribing to industry newsletters, following relevant companies and organizations, or regularly checking reputable industry news sources and publications.
Methodology
Step 1 - Identification of Relevant Samples Size from Population Database


Step 2 - Approaches for Defining Global Market Size (Value, Volume* & Price*)

Note*: In applicable scenarios
Step 3 - Data Sources
Primary Research
- Web Analytics
- Survey Reports
- Research Institute
- Latest Research Reports
- Opinion Leaders
Secondary Research
- Annual Reports
- White Paper
- Latest Press Release
- Industry Association
- Paid Database
- Investor Presentations

Step 4 - Data Triangulation
Involves using different sources of information in order to increase the validity of a study
These sources are likely to be stakeholders in a program - participants, other researchers, program staff, other community members, and so on.
Then we put all data in single framework & apply various statistical tools to find out the dynamic on the market.
During the analysis stage, feedback from the stakeholder groups would be compared to determine areas of agreement as well as areas of divergence


