
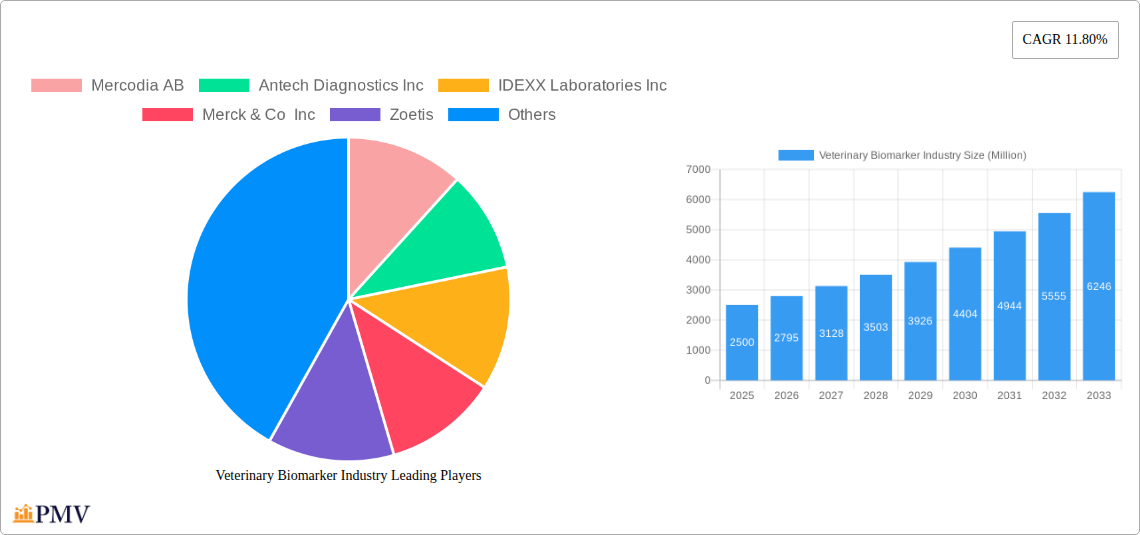
Key Insights
The veterinary biomarker market is experiencing robust growth, projected to reach a substantial size by 2033, driven by a compound annual growth rate (CAGR) of 11.80% from 2025 to 2033. This expansion is fueled by several key factors. Increasing pet ownership globally, coupled with rising pet healthcare expenditure, significantly contributes to market demand. Advancements in diagnostic technologies, specifically in biomarker detection and analysis, enable earlier and more accurate disease diagnosis in animals, leading to improved treatment outcomes and enhanced animal welfare. The development of sophisticated biomarker kits and reagents, simplifying testing procedures for veterinarians, further accelerates market growth. Furthermore, the growing adoption of personalized medicine approaches in veterinary care creates a demand for specific and sensitive biomarker assays tailored to individual animal needs and disease subtypes. Research focused on inflammatory and infectious diseases, cardiovascular conditions, and tumor detection is a significant driver within specific market segments.
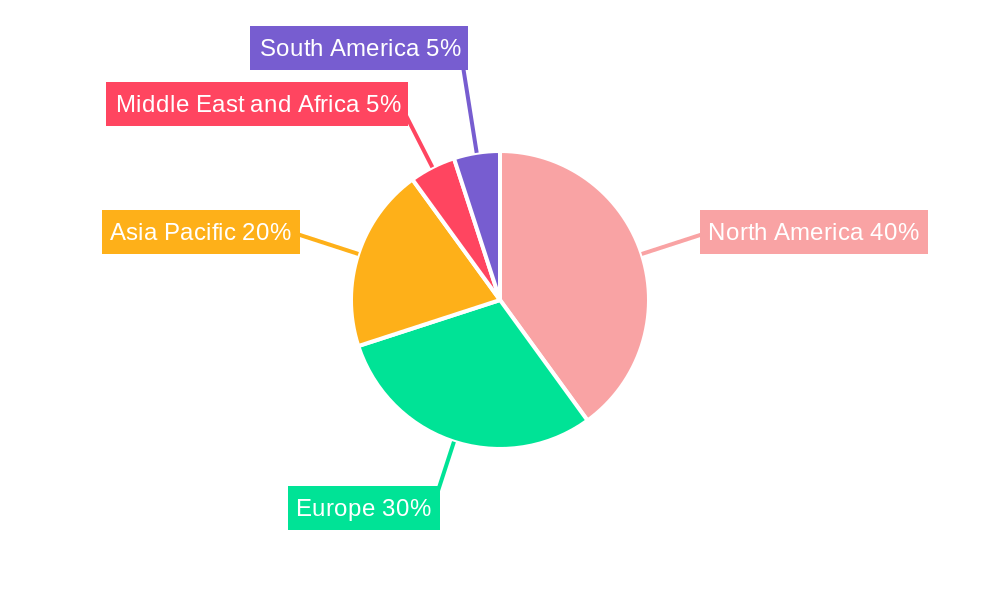
The market segmentation reveals a dynamic landscape. Disease diagnostics represent a substantial segment, reflecting the importance of early disease detection. Companion animals, particularly dogs and cats, constitute the largest animal type segment, driven by high owner willingness to invest in their pet's health. Biomarkers and associated kits and reagents are dominant product types, illustrating the core technology underpinning the market. Geographically, North America and Europe currently hold significant market share, owing to established veterinary infrastructure and high adoption rates of advanced diagnostic technologies. However, rapidly developing economies in the Asia-Pacific region present significant growth opportunities, fueled by increasing pet ownership and expanding veterinary services. While regulatory hurdles and high testing costs could pose some challenges, the overall market outlook remains highly positive, driven by a convergence of technological innovation, increasing awareness of animal health, and rising disposable incomes globally.
Veterinary Biomarker Industry Market Report: 2019-2033
This comprehensive report provides a detailed analysis of the Veterinary Biomarker Industry, offering invaluable insights for stakeholders, investors, and industry professionals. Covering the period from 2019 to 2033, with a focus on 2025, this report delivers actionable intelligence on market size, segmentation, competitive landscape, and future growth projections. The report leverages extensive data analysis and industry expertise to offer a robust understanding of this rapidly evolving sector. The global veterinary biomarker market is projected to reach xx Million by 2033.
Veterinary Biomarker Industry Market Structure & Competitive Dynamics
The veterinary biomarker market exhibits a moderately concentrated structure, with several key players holding significant market share. However, the presence of numerous smaller, specialized companies indicates a dynamic competitive landscape. Innovation is crucial, with companies investing heavily in R&D to develop novel biomarkers and diagnostic tools. Regulatory frameworks, varying across geographies, significantly influence market access and product approvals. Substitutes, such as traditional diagnostic methods, pose a competitive threat, albeit one that is gradually being overcome by the superior accuracy and speed offered by biomarker technologies. End-user trends, particularly the increasing adoption of companion animals and growing concerns about animal health, are major growth drivers. Mergers and acquisitions (M&A) activity is relatively frequent, with larger companies acquiring smaller firms to expand their product portfolios and market reach. The total value of M&A deals in the past five years is estimated at xx Million.
- Market Concentration: Moderately concentrated, with a few major players dominating specific segments.
- Innovation Ecosystems: Active, with significant R&D investment in novel biomarkers and diagnostic technologies.
- Regulatory Frameworks: Varying across geographies, impacting market access and product approvals.
- Product Substitutes: Traditional diagnostic methods pose a competitive threat, although this is diminishing.
- End-User Trends: Increasing companion animal ownership and rising awareness of animal health are major drivers.
- M&A Activity: Frequent, with larger companies acquiring smaller players to expand their portfolios. Deal values exceeding xx Million are observed in recent years.
Veterinary Biomarker Industry Industry Trends & Insights
The veterinary biomarker market is experiencing robust growth, driven by several key factors. The increasing prevalence of chronic diseases in animals is fueling demand for accurate and timely diagnostics. Technological advancements, particularly in molecular diagnostics and high-throughput screening, are enhancing the sensitivity and specificity of biomarker assays. Consumer preferences are shifting towards more sophisticated diagnostic tools and personalized medicine approaches for animals. Competitive dynamics are shaping the market, with companies continually innovating to differentiate their offerings. The market's compound annual growth rate (CAGR) during the forecast period (2025-2033) is projected to be xx%, driven by increasing market penetration of advanced biomarker technologies in veterinary diagnostics. The market penetration of biomarker-based diagnostics in the veterinary sector is estimated to be xx% in 2025, anticipated to rise to xx% by 2033.
Dominant Markets & Segments in Veterinary Biomarker Industry
The companion animal segment dominates the veterinary biomarker market, driven by higher owner willingness to spend on pet healthcare. Within disease types, inflammatory and infectious diseases represent the largest segment due to their high prevalence. Disease diagnostics is the primary application, although preclinical research is showing strong growth potential. Geographically, North America and Europe currently hold the largest market shares, fueled by advanced healthcare infrastructure and higher pet ownership rates.
- By Application: Disease diagnostics remains the largest segment, with preclinical research exhibiting rapid growth.
- By Disease Type: Inflammatory & Infectious diseases dominate, followed by tumors and cardiovascular diseases.
- By Animal Type: Companion animals are the largest market segment, followed by farm animals.
- By Product Type: Kits & Reagents currently hold the largest market share, although biomarker readers are expected to grow rapidly.
- Key Drivers: Advanced healthcare infrastructure, higher pet ownership rates (particularly in developed nations), and increasing veterinary spending are significant factors.
Veterinary Biomarker Industry Product Innovations
Recent innovations focus on developing more sensitive, specific, and cost-effective biomarker assays. Point-of-care diagnostics, leveraging portable devices, are gaining traction, enabling faster diagnosis and treatment in veterinary clinics. The integration of advanced technologies like AI and machine learning is enhancing diagnostic accuracy and facilitating data analysis. These innovations are improving the market fit by addressing the needs for faster, more accurate, and convenient veterinary diagnostics.
Report Segmentation & Scope
This report segments the veterinary biomarker market by application (Disease Diagnostics, Preclinical Research, Other Applications), disease type (Inflammatory & Infectious Diseases, Cardiovascular Diseases, Skeletal Muscle Diseases, Tumors, Other Disease Types), animal type (Companion Animals, Farm Animals), and product type (Biomarkers, Kits & Reagents, Biomarker Readers). Each segment’s growth projections, market size estimates (in Millions), and competitive dynamics are thoroughly analyzed within the report, covering the historical period (2019-2024), base year (2025), and forecast period (2025-2033).
Key Drivers of Veterinary Biomarker Industry Growth
Technological advancements in biomarker detection, increasing prevalence of chronic diseases in animals, rising pet ownership rates globally, and growing investments in veterinary research and development are key factors driving market growth. Furthermore, supportive regulatory frameworks and increasing demand for accurate and rapid diagnostics are propelling the expansion of this sector.
Challenges in the Veterinary Biomarker Industry Sector
High research and development costs associated with biomarker discovery and validation pose a significant challenge. Regulatory hurdles for approval of new diagnostic tools can be complex and time-consuming. The supply chain for specialized reagents and equipment can be vulnerable to disruptions. Moreover, intense competition from established players and the emergence of new entrants require companies to maintain innovation and competitiveness.
Leading Players in the Veterinary Biomarker Industry Market
- Mercodia AB
- Antech Diagnostics Inc
- IDEXX Laboratories Inc
- Merck & Co Inc
- Zoetis
- ACUVET BIOTECH
- Veterinary Biomarkers Inc
- MI:RNA Diagnostics Ltd
- Avacta Animal Health Limited
- Virbac
Key Developments in Veterinary Biomarker Industry Sector
- October 2022: Researchers from Boston University received a USD 4.6 Million grant for developing lung cancer biomarkers. This signifies a significant investment in biomarker research and potential future market expansion.
- October 2021: Zoetis Inc. expanded its manufacturing facility, enhancing veterinary monoclonal antibody production. This indicates increased capacity for biomarker-based diagnostic tools and potential market growth.
Strategic Veterinary Biomarker Industry Market Outlook
The veterinary biomarker market presents significant growth potential driven by continued technological advancements, increasing demand for advanced diagnostics, and expansion into emerging markets. Strategic opportunities exist in developing novel biomarkers for prevalent animal diseases, creating point-of-care diagnostic tools, and leveraging AI and machine learning for data analysis. Focusing on innovative product development and strategic partnerships will be crucial for capturing market share in this rapidly evolving sector.
Veterinary Biomarker Industry Segmentation
-
1. Animal Type
-
1.1. Companion Animals
- 1.1.1. Dogs
- 1.1.2. Cats
- 1.1.3. Other Companion Animals
-
1.2. Farm Animals
- 1.2.1. Cows
- 1.2.2. Pigs
- 1.2.3. Other Farm Animals
-
1.1. Companion Animals
-
2. Product Type
- 2.1. Biomarkers, Kits & Reagents
- 2.2. Biomarker Readers
-
3. Application
- 3.1. Disease Diagnostics
- 3.2. Preclinical Research
- 3.3. Other Applications
-
4. Disease Type
- 4.1. Inflammatory & Infectious Diseases
- 4.2. Cardiovascular Diseases
- 4.3. Skeletal Muscle Diseases
- 4.4. Tumors
- 4.5. Other Disease Types
Veterinary Biomarker Industry Segmentation By Geography
-
1. North America
- 1.1. United States
- 1.2. Canada
- 1.3. Mexico
-
2. Europe
- 2.1. Germany
- 2.2. United Kingdom
- 2.3. France
- 2.4. Italy
- 2.5. Spain
- 2.6. Rest of Europe
-
3. Asia Pacific
- 3.1. China
- 3.2. Japan
- 3.3. India
- 3.4. Australia
- 3.5. South Korea
- 3.6. Rest of Asia Pacific
-
4. Middle East and Africa
- 4.1. GCC
- 4.2. South Africa
- 4.3. Rest of Middle East and Africa
-
5. South America
- 5.1. Brazil
- 5.2. Argentina
- 5.3. Rest of South America
Veterinary Biomarker Industry REPORT HIGHLIGHTS
| Aspects | Details |
|---|---|
| Study Period | 2019-2033 |
| Base Year | 2024 |
| Estimated Year | 2025 |
| Forecast Period | 2025-2033 |
| Historical Period | 2019-2024 |
| Growth Rate | CAGR of 11.80% from 2019-2033 |
| Segmentation |
|
Table of Contents
- 1. Introduction
- 1.1. Research Scope
- 1.2. Market Segmentation
- 1.3. Research Methodology
- 1.4. Definitions and Assumptions
- 2. Executive Summary
- 2.1. Introduction
- 3. Market Dynamics
- 3.1. Introduction
- 3.2. Market Drivers
- 3.2.1. High Prevalence of Chronic Diseases in Animals; Implementation of Innovative R&D Strategies by Prominent Players; Rising Pet Adoption Rates
- 3.3. Market Restrains
- 3.3.1. Expanding Pet Care Costs
- 3.4. Market Trends
- 3.4.1 Biomarkers
- 3.4.2 Kits & Reagents Segment is Expected to Witness Significant Growth Over the Forecast Period
- 4. Market Factor Analysis
- 4.1. Porters Five Forces
- 4.2. Supply/Value Chain
- 4.3. PESTEL analysis
- 4.4. Market Entropy
- 4.5. Patent/Trademark Analysis
- 5. Global Veterinary Biomarker Industry Analysis, Insights and Forecast, 2019-2031
- 5.1. Market Analysis, Insights and Forecast - by Animal Type
- 5.1.1. Companion Animals
- 5.1.1.1. Dogs
- 5.1.1.2. Cats
- 5.1.1.3. Other Companion Animals
- 5.1.2. Farm Animals
- 5.1.2.1. Cows
- 5.1.2.2. Pigs
- 5.1.2.3. Other Farm Animals
- 5.1.1. Companion Animals
- 5.2. Market Analysis, Insights and Forecast - by Product Type
- 5.2.1. Biomarkers, Kits & Reagents
- 5.2.2. Biomarker Readers
- 5.3. Market Analysis, Insights and Forecast - by Application
- 5.3.1. Disease Diagnostics
- 5.3.2. Preclinical Research
- 5.3.3. Other Applications
- 5.4. Market Analysis, Insights and Forecast - by Disease Type
- 5.4.1. Inflammatory & Infectious Diseases
- 5.4.2. Cardiovascular Diseases
- 5.4.3. Skeletal Muscle Diseases
- 5.4.4. Tumors
- 5.4.5. Other Disease Types
- 5.5. Market Analysis, Insights and Forecast - by Region
- 5.5.1. North America
- 5.5.2. Europe
- 5.5.3. Asia Pacific
- 5.5.4. Middle East and Africa
- 5.5.5. South America
- 5.1. Market Analysis, Insights and Forecast - by Animal Type
- 6. North America Veterinary Biomarker Industry Analysis, Insights and Forecast, 2019-2031
- 6.1. Market Analysis, Insights and Forecast - by Animal Type
- 6.1.1. Companion Animals
- 6.1.1.1. Dogs
- 6.1.1.2. Cats
- 6.1.1.3. Other Companion Animals
- 6.1.2. Farm Animals
- 6.1.2.1. Cows
- 6.1.2.2. Pigs
- 6.1.2.3. Other Farm Animals
- 6.1.1. Companion Animals
- 6.2. Market Analysis, Insights and Forecast - by Product Type
- 6.2.1. Biomarkers, Kits & Reagents
- 6.2.2. Biomarker Readers
- 6.3. Market Analysis, Insights and Forecast - by Application
- 6.3.1. Disease Diagnostics
- 6.3.2. Preclinical Research
- 6.3.3. Other Applications
- 6.4. Market Analysis, Insights and Forecast - by Disease Type
- 6.4.1. Inflammatory & Infectious Diseases
- 6.4.2. Cardiovascular Diseases
- 6.4.3. Skeletal Muscle Diseases
- 6.4.4. Tumors
- 6.4.5. Other Disease Types
- 6.1. Market Analysis, Insights and Forecast - by Animal Type
- 7. Europe Veterinary Biomarker Industry Analysis, Insights and Forecast, 2019-2031
- 7.1. Market Analysis, Insights and Forecast - by Animal Type
- 7.1.1. Companion Animals
- 7.1.1.1. Dogs
- 7.1.1.2. Cats
- 7.1.1.3. Other Companion Animals
- 7.1.2. Farm Animals
- 7.1.2.1. Cows
- 7.1.2.2. Pigs
- 7.1.2.3. Other Farm Animals
- 7.1.1. Companion Animals
- 7.2. Market Analysis, Insights and Forecast - by Product Type
- 7.2.1. Biomarkers, Kits & Reagents
- 7.2.2. Biomarker Readers
- 7.3. Market Analysis, Insights and Forecast - by Application
- 7.3.1. Disease Diagnostics
- 7.3.2. Preclinical Research
- 7.3.3. Other Applications
- 7.4. Market Analysis, Insights and Forecast - by Disease Type
- 7.4.1. Inflammatory & Infectious Diseases
- 7.4.2. Cardiovascular Diseases
- 7.4.3. Skeletal Muscle Diseases
- 7.4.4. Tumors
- 7.4.5. Other Disease Types
- 7.1. Market Analysis, Insights and Forecast - by Animal Type
- 8. Asia Pacific Veterinary Biomarker Industry Analysis, Insights and Forecast, 2019-2031
- 8.1. Market Analysis, Insights and Forecast - by Animal Type
- 8.1.1. Companion Animals
- 8.1.1.1. Dogs
- 8.1.1.2. Cats
- 8.1.1.3. Other Companion Animals
- 8.1.2. Farm Animals
- 8.1.2.1. Cows
- 8.1.2.2. Pigs
- 8.1.2.3. Other Farm Animals
- 8.1.1. Companion Animals
- 8.2. Market Analysis, Insights and Forecast - by Product Type
- 8.2.1. Biomarkers, Kits & Reagents
- 8.2.2. Biomarker Readers
- 8.3. Market Analysis, Insights and Forecast - by Application
- 8.3.1. Disease Diagnostics
- 8.3.2. Preclinical Research
- 8.3.3. Other Applications
- 8.4. Market Analysis, Insights and Forecast - by Disease Type
- 8.4.1. Inflammatory & Infectious Diseases
- 8.4.2. Cardiovascular Diseases
- 8.4.3. Skeletal Muscle Diseases
- 8.4.4. Tumors
- 8.4.5. Other Disease Types
- 8.1. Market Analysis, Insights and Forecast - by Animal Type
- 9. Middle East and Africa Veterinary Biomarker Industry Analysis, Insights and Forecast, 2019-2031
- 9.1. Market Analysis, Insights and Forecast - by Animal Type
- 9.1.1. Companion Animals
- 9.1.1.1. Dogs
- 9.1.1.2. Cats
- 9.1.1.3. Other Companion Animals
- 9.1.2. Farm Animals
- 9.1.2.1. Cows
- 9.1.2.2. Pigs
- 9.1.2.3. Other Farm Animals
- 9.1.1. Companion Animals
- 9.2. Market Analysis, Insights and Forecast - by Product Type
- 9.2.1. Biomarkers, Kits & Reagents
- 9.2.2. Biomarker Readers
- 9.3. Market Analysis, Insights and Forecast - by Application
- 9.3.1. Disease Diagnostics
- 9.3.2. Preclinical Research
- 9.3.3. Other Applications
- 9.4. Market Analysis, Insights and Forecast - by Disease Type
- 9.4.1. Inflammatory & Infectious Diseases
- 9.4.2. Cardiovascular Diseases
- 9.4.3. Skeletal Muscle Diseases
- 9.4.4. Tumors
- 9.4.5. Other Disease Types
- 9.1. Market Analysis, Insights and Forecast - by Animal Type
- 10. South America Veterinary Biomarker Industry Analysis, Insights and Forecast, 2019-2031
- 10.1. Market Analysis, Insights and Forecast - by Animal Type
- 10.1.1. Companion Animals
- 10.1.1.1. Dogs
- 10.1.1.2. Cats
- 10.1.1.3. Other Companion Animals
- 10.1.2. Farm Animals
- 10.1.2.1. Cows
- 10.1.2.2. Pigs
- 10.1.2.3. Other Farm Animals
- 10.1.1. Companion Animals
- 10.2. Market Analysis, Insights and Forecast - by Product Type
- 10.2.1. Biomarkers, Kits & Reagents
- 10.2.2. Biomarker Readers
- 10.3. Market Analysis, Insights and Forecast - by Application
- 10.3.1. Disease Diagnostics
- 10.3.2. Preclinical Research
- 10.3.3. Other Applications
- 10.4. Market Analysis, Insights and Forecast - by Disease Type
- 10.4.1. Inflammatory & Infectious Diseases
- 10.4.2. Cardiovascular Diseases
- 10.4.3. Skeletal Muscle Diseases
- 10.4.4. Tumors
- 10.4.5. Other Disease Types
- 10.1. Market Analysis, Insights and Forecast - by Animal Type
- 11. North America Veterinary Biomarker Industry Analysis, Insights and Forecast, 2019-2031
- 11.1. Market Analysis, Insights and Forecast - By Country/Sub-region
- 11.1.1 United States
- 11.1.2 Canada
- 11.1.3 Mexico
- 12. Europe Veterinary Biomarker Industry Analysis, Insights and Forecast, 2019-2031
- 12.1. Market Analysis, Insights and Forecast - By Country/Sub-region
- 12.1.1 Germany
- 12.1.2 United Kingdom
- 12.1.3 France
- 12.1.4 Italy
- 12.1.5 Spain
- 12.1.6 Rest of Europe
- 13. Asia Pacific Veterinary Biomarker Industry Analysis, Insights and Forecast, 2019-2031
- 13.1. Market Analysis, Insights and Forecast - By Country/Sub-region
- 13.1.1 China
- 13.1.2 Japan
- 13.1.3 India
- 13.1.4 Australia
- 13.1.5 South Korea
- 13.1.6 Rest of Asia Pacific
- 14. Middle East and Africa Veterinary Biomarker Industry Analysis, Insights and Forecast, 2019-2031
- 14.1. Market Analysis, Insights and Forecast - By Country/Sub-region
- 14.1.1 GCC
- 14.1.2 South Africa
- 14.1.3 Rest of Middle East and Africa
- 15. South America Veterinary Biomarker Industry Analysis, Insights and Forecast, 2019-2031
- 15.1. Market Analysis, Insights and Forecast - By Country/Sub-region
- 15.1.1 Brazil
- 15.1.2 Argentina
- 15.1.3 Rest of South America
- 16. Competitive Analysis
- 16.1. Global Market Share Analysis 2024
- 16.2. Company Profiles
- 16.2.1 Mercodia AB
- 16.2.1.1. Overview
- 16.2.1.2. Products
- 16.2.1.3. SWOT Analysis
- 16.2.1.4. Recent Developments
- 16.2.1.5. Financials (Based on Availability)
- 16.2.2 Antech Diagnostics Inc
- 16.2.2.1. Overview
- 16.2.2.2. Products
- 16.2.2.3. SWOT Analysis
- 16.2.2.4. Recent Developments
- 16.2.2.5. Financials (Based on Availability)
- 16.2.3 IDEXX Laboratories Inc
- 16.2.3.1. Overview
- 16.2.3.2. Products
- 16.2.3.3. SWOT Analysis
- 16.2.3.4. Recent Developments
- 16.2.3.5. Financials (Based on Availability)
- 16.2.4 Merck & Co Inc
- 16.2.4.1. Overview
- 16.2.4.2. Products
- 16.2.4.3. SWOT Analysis
- 16.2.4.4. Recent Developments
- 16.2.4.5. Financials (Based on Availability)
- 16.2.5 Zoetis
- 16.2.5.1. Overview
- 16.2.5.2. Products
- 16.2.5.3. SWOT Analysis
- 16.2.5.4. Recent Developments
- 16.2.5.5. Financials (Based on Availability)
- 16.2.6 ACUVET BIOTECH
- 16.2.6.1. Overview
- 16.2.6.2. Products
- 16.2.6.3. SWOT Analysis
- 16.2.6.4. Recent Developments
- 16.2.6.5. Financials (Based on Availability)
- 16.2.7 Veterinary Biomarkers Inc
- 16.2.7.1. Overview
- 16.2.7.2. Products
- 16.2.7.3. SWOT Analysis
- 16.2.7.4. Recent Developments
- 16.2.7.5. Financials (Based on Availability)
- 16.2.8 MI
- 16.2.8.1. Overview
- 16.2.8.2. Products
- 16.2.8.3. SWOT Analysis
- 16.2.8.4. Recent Developments
- 16.2.8.5. Financials (Based on Availability)
- 16.2.1 Mercodia AB
List of Figures
- Figure 1: Global Veterinary Biomarker Industry Revenue Breakdown (Million, %) by Region 2024 & 2032
- Figure 2: North America Veterinary Biomarker Industry Revenue (Million), by Country 2024 & 2032
- Figure 3: North America Veterinary Biomarker Industry Revenue Share (%), by Country 2024 & 2032
- Figure 4: Europe Veterinary Biomarker Industry Revenue (Million), by Country 2024 & 2032
- Figure 5: Europe Veterinary Biomarker Industry Revenue Share (%), by Country 2024 & 2032
- Figure 6: Asia Pacific Veterinary Biomarker Industry Revenue (Million), by Country 2024 & 2032
- Figure 7: Asia Pacific Veterinary Biomarker Industry Revenue Share (%), by Country 2024 & 2032
- Figure 8: Middle East and Africa Veterinary Biomarker Industry Revenue (Million), by Country 2024 & 2032
- Figure 9: Middle East and Africa Veterinary Biomarker Industry Revenue Share (%), by Country 2024 & 2032
- Figure 10: South America Veterinary Biomarker Industry Revenue (Million), by Country 2024 & 2032
- Figure 11: South America Veterinary Biomarker Industry Revenue Share (%), by Country 2024 & 2032
- Figure 12: North America Veterinary Biomarker Industry Revenue (Million), by Animal Type 2024 & 2032
- Figure 13: North America Veterinary Biomarker Industry Revenue Share (%), by Animal Type 2024 & 2032
- Figure 14: North America Veterinary Biomarker Industry Revenue (Million), by Product Type 2024 & 2032
- Figure 15: North America Veterinary Biomarker Industry Revenue Share (%), by Product Type 2024 & 2032
- Figure 16: North America Veterinary Biomarker Industry Revenue (Million), by Application 2024 & 2032
- Figure 17: North America Veterinary Biomarker Industry Revenue Share (%), by Application 2024 & 2032
- Figure 18: North America Veterinary Biomarker Industry Revenue (Million), by Disease Type 2024 & 2032
- Figure 19: North America Veterinary Biomarker Industry Revenue Share (%), by Disease Type 2024 & 2032
- Figure 20: North America Veterinary Biomarker Industry Revenue (Million), by Country 2024 & 2032
- Figure 21: North America Veterinary Biomarker Industry Revenue Share (%), by Country 2024 & 2032
- Figure 22: Europe Veterinary Biomarker Industry Revenue (Million), by Animal Type 2024 & 2032
- Figure 23: Europe Veterinary Biomarker Industry Revenue Share (%), by Animal Type 2024 & 2032
- Figure 24: Europe Veterinary Biomarker Industry Revenue (Million), by Product Type 2024 & 2032
- Figure 25: Europe Veterinary Biomarker Industry Revenue Share (%), by Product Type 2024 & 2032
- Figure 26: Europe Veterinary Biomarker Industry Revenue (Million), by Application 2024 & 2032
- Figure 27: Europe Veterinary Biomarker Industry Revenue Share (%), by Application 2024 & 2032
- Figure 28: Europe Veterinary Biomarker Industry Revenue (Million), by Disease Type 2024 & 2032
- Figure 29: Europe Veterinary Biomarker Industry Revenue Share (%), by Disease Type 2024 & 2032
- Figure 30: Europe Veterinary Biomarker Industry Revenue (Million), by Country 2024 & 2032
- Figure 31: Europe Veterinary Biomarker Industry Revenue Share (%), by Country 2024 & 2032
- Figure 32: Asia Pacific Veterinary Biomarker Industry Revenue (Million), by Animal Type 2024 & 2032
- Figure 33: Asia Pacific Veterinary Biomarker Industry Revenue Share (%), by Animal Type 2024 & 2032
- Figure 34: Asia Pacific Veterinary Biomarker Industry Revenue (Million), by Product Type 2024 & 2032
- Figure 35: Asia Pacific Veterinary Biomarker Industry Revenue Share (%), by Product Type 2024 & 2032
- Figure 36: Asia Pacific Veterinary Biomarker Industry Revenue (Million), by Application 2024 & 2032
- Figure 37: Asia Pacific Veterinary Biomarker Industry Revenue Share (%), by Application 2024 & 2032
- Figure 38: Asia Pacific Veterinary Biomarker Industry Revenue (Million), by Disease Type 2024 & 2032
- Figure 39: Asia Pacific Veterinary Biomarker Industry Revenue Share (%), by Disease Type 2024 & 2032
- Figure 40: Asia Pacific Veterinary Biomarker Industry Revenue (Million), by Country 2024 & 2032
- Figure 41: Asia Pacific Veterinary Biomarker Industry Revenue Share (%), by Country 2024 & 2032
- Figure 42: Middle East and Africa Veterinary Biomarker Industry Revenue (Million), by Animal Type 2024 & 2032
- Figure 43: Middle East and Africa Veterinary Biomarker Industry Revenue Share (%), by Animal Type 2024 & 2032
- Figure 44: Middle East and Africa Veterinary Biomarker Industry Revenue (Million), by Product Type 2024 & 2032
- Figure 45: Middle East and Africa Veterinary Biomarker Industry Revenue Share (%), by Product Type 2024 & 2032
- Figure 46: Middle East and Africa Veterinary Biomarker Industry Revenue (Million), by Application 2024 & 2032
- Figure 47: Middle East and Africa Veterinary Biomarker Industry Revenue Share (%), by Application 2024 & 2032
- Figure 48: Middle East and Africa Veterinary Biomarker Industry Revenue (Million), by Disease Type 2024 & 2032
- Figure 49: Middle East and Africa Veterinary Biomarker Industry Revenue Share (%), by Disease Type 2024 & 2032
- Figure 50: Middle East and Africa Veterinary Biomarker Industry Revenue (Million), by Country 2024 & 2032
- Figure 51: Middle East and Africa Veterinary Biomarker Industry Revenue Share (%), by Country 2024 & 2032
- Figure 52: South America Veterinary Biomarker Industry Revenue (Million), by Animal Type 2024 & 2032
- Figure 53: South America Veterinary Biomarker Industry Revenue Share (%), by Animal Type 2024 & 2032
- Figure 54: South America Veterinary Biomarker Industry Revenue (Million), by Product Type 2024 & 2032
- Figure 55: South America Veterinary Biomarker Industry Revenue Share (%), by Product Type 2024 & 2032
- Figure 56: South America Veterinary Biomarker Industry Revenue (Million), by Application 2024 & 2032
- Figure 57: South America Veterinary Biomarker Industry Revenue Share (%), by Application 2024 & 2032
- Figure 58: South America Veterinary Biomarker Industry Revenue (Million), by Disease Type 2024 & 2032
- Figure 59: South America Veterinary Biomarker Industry Revenue Share (%), by Disease Type 2024 & 2032
- Figure 60: South America Veterinary Biomarker Industry Revenue (Million), by Country 2024 & 2032
- Figure 61: South America Veterinary Biomarker Industry Revenue Share (%), by Country 2024 & 2032
List of Tables
- Table 1: Global Veterinary Biomarker Industry Revenue Million Forecast, by Region 2019 & 2032
- Table 2: Global Veterinary Biomarker Industry Revenue Million Forecast, by Animal Type 2019 & 2032
- Table 3: Global Veterinary Biomarker Industry Revenue Million Forecast, by Product Type 2019 & 2032
- Table 4: Global Veterinary Biomarker Industry Revenue Million Forecast, by Application 2019 & 2032
- Table 5: Global Veterinary Biomarker Industry Revenue Million Forecast, by Disease Type 2019 & 2032
- Table 6: Global Veterinary Biomarker Industry Revenue Million Forecast, by Region 2019 & 2032
- Table 7: Global Veterinary Biomarker Industry Revenue Million Forecast, by Country 2019 & 2032
- Table 8: United States Veterinary Biomarker Industry Revenue (Million) Forecast, by Application 2019 & 2032
- Table 9: Canada Veterinary Biomarker Industry Revenue (Million) Forecast, by Application 2019 & 2032
- Table 10: Mexico Veterinary Biomarker Industry Revenue (Million) Forecast, by Application 2019 & 2032
- Table 11: Global Veterinary Biomarker Industry Revenue Million Forecast, by Country 2019 & 2032
- Table 12: Germany Veterinary Biomarker Industry Revenue (Million) Forecast, by Application 2019 & 2032
- Table 13: United Kingdom Veterinary Biomarker Industry Revenue (Million) Forecast, by Application 2019 & 2032
- Table 14: France Veterinary Biomarker Industry Revenue (Million) Forecast, by Application 2019 & 2032
- Table 15: Italy Veterinary Biomarker Industry Revenue (Million) Forecast, by Application 2019 & 2032
- Table 16: Spain Veterinary Biomarker Industry Revenue (Million) Forecast, by Application 2019 & 2032
- Table 17: Rest of Europe Veterinary Biomarker Industry Revenue (Million) Forecast, by Application 2019 & 2032
- Table 18: Global Veterinary Biomarker Industry Revenue Million Forecast, by Country 2019 & 2032
- Table 19: China Veterinary Biomarker Industry Revenue (Million) Forecast, by Application 2019 & 2032
- Table 20: Japan Veterinary Biomarker Industry Revenue (Million) Forecast, by Application 2019 & 2032
- Table 21: India Veterinary Biomarker Industry Revenue (Million) Forecast, by Application 2019 & 2032
- Table 22: Australia Veterinary Biomarker Industry Revenue (Million) Forecast, by Application 2019 & 2032
- Table 23: South Korea Veterinary Biomarker Industry Revenue (Million) Forecast, by Application 2019 & 2032
- Table 24: Rest of Asia Pacific Veterinary Biomarker Industry Revenue (Million) Forecast, by Application 2019 & 2032
- Table 25: Global Veterinary Biomarker Industry Revenue Million Forecast, by Country 2019 & 2032
- Table 26: GCC Veterinary Biomarker Industry Revenue (Million) Forecast, by Application 2019 & 2032
- Table 27: South Africa Veterinary Biomarker Industry Revenue (Million) Forecast, by Application 2019 & 2032
- Table 28: Rest of Middle East and Africa Veterinary Biomarker Industry Revenue (Million) Forecast, by Application 2019 & 2032
- Table 29: Global Veterinary Biomarker Industry Revenue Million Forecast, by Country 2019 & 2032
- Table 30: Brazil Veterinary Biomarker Industry Revenue (Million) Forecast, by Application 2019 & 2032
- Table 31: Argentina Veterinary Biomarker Industry Revenue (Million) Forecast, by Application 2019 & 2032
- Table 32: Rest of South America Veterinary Biomarker Industry Revenue (Million) Forecast, by Application 2019 & 2032
- Table 33: Global Veterinary Biomarker Industry Revenue Million Forecast, by Animal Type 2019 & 2032
- Table 34: Global Veterinary Biomarker Industry Revenue Million Forecast, by Product Type 2019 & 2032
- Table 35: Global Veterinary Biomarker Industry Revenue Million Forecast, by Application 2019 & 2032
- Table 36: Global Veterinary Biomarker Industry Revenue Million Forecast, by Disease Type 2019 & 2032
- Table 37: Global Veterinary Biomarker Industry Revenue Million Forecast, by Country 2019 & 2032
- Table 38: United States Veterinary Biomarker Industry Revenue (Million) Forecast, by Application 2019 & 2032
- Table 39: Canada Veterinary Biomarker Industry Revenue (Million) Forecast, by Application 2019 & 2032
- Table 40: Mexico Veterinary Biomarker Industry Revenue (Million) Forecast, by Application 2019 & 2032
- Table 41: Global Veterinary Biomarker Industry Revenue Million Forecast, by Animal Type 2019 & 2032
- Table 42: Global Veterinary Biomarker Industry Revenue Million Forecast, by Product Type 2019 & 2032
- Table 43: Global Veterinary Biomarker Industry Revenue Million Forecast, by Application 2019 & 2032
- Table 44: Global Veterinary Biomarker Industry Revenue Million Forecast, by Disease Type 2019 & 2032
- Table 45: Global Veterinary Biomarker Industry Revenue Million Forecast, by Country 2019 & 2032
- Table 46: Germany Veterinary Biomarker Industry Revenue (Million) Forecast, by Application 2019 & 2032
- Table 47: United Kingdom Veterinary Biomarker Industry Revenue (Million) Forecast, by Application 2019 & 2032
- Table 48: France Veterinary Biomarker Industry Revenue (Million) Forecast, by Application 2019 & 2032
- Table 49: Italy Veterinary Biomarker Industry Revenue (Million) Forecast, by Application 2019 & 2032
- Table 50: Spain Veterinary Biomarker Industry Revenue (Million) Forecast, by Application 2019 & 2032
- Table 51: Rest of Europe Veterinary Biomarker Industry Revenue (Million) Forecast, by Application 2019 & 2032
- Table 52: Global Veterinary Biomarker Industry Revenue Million Forecast, by Animal Type 2019 & 2032
- Table 53: Global Veterinary Biomarker Industry Revenue Million Forecast, by Product Type 2019 & 2032
- Table 54: Global Veterinary Biomarker Industry Revenue Million Forecast, by Application 2019 & 2032
- Table 55: Global Veterinary Biomarker Industry Revenue Million Forecast, by Disease Type 2019 & 2032
- Table 56: Global Veterinary Biomarker Industry Revenue Million Forecast, by Country 2019 & 2032
- Table 57: China Veterinary Biomarker Industry Revenue (Million) Forecast, by Application 2019 & 2032
- Table 58: Japan Veterinary Biomarker Industry Revenue (Million) Forecast, by Application 2019 & 2032
- Table 59: India Veterinary Biomarker Industry Revenue (Million) Forecast, by Application 2019 & 2032
- Table 60: Australia Veterinary Biomarker Industry Revenue (Million) Forecast, by Application 2019 & 2032
- Table 61: South Korea Veterinary Biomarker Industry Revenue (Million) Forecast, by Application 2019 & 2032
- Table 62: Rest of Asia Pacific Veterinary Biomarker Industry Revenue (Million) Forecast, by Application 2019 & 2032
- Table 63: Global Veterinary Biomarker Industry Revenue Million Forecast, by Animal Type 2019 & 2032
- Table 64: Global Veterinary Biomarker Industry Revenue Million Forecast, by Product Type 2019 & 2032
- Table 65: Global Veterinary Biomarker Industry Revenue Million Forecast, by Application 2019 & 2032
- Table 66: Global Veterinary Biomarker Industry Revenue Million Forecast, by Disease Type 2019 & 2032
- Table 67: Global Veterinary Biomarker Industry Revenue Million Forecast, by Country 2019 & 2032
- Table 68: GCC Veterinary Biomarker Industry Revenue (Million) Forecast, by Application 2019 & 2032
- Table 69: South Africa Veterinary Biomarker Industry Revenue (Million) Forecast, by Application 2019 & 2032
- Table 70: Rest of Middle East and Africa Veterinary Biomarker Industry Revenue (Million) Forecast, by Application 2019 & 2032
- Table 71: Global Veterinary Biomarker Industry Revenue Million Forecast, by Animal Type 2019 & 2032
- Table 72: Global Veterinary Biomarker Industry Revenue Million Forecast, by Product Type 2019 & 2032
- Table 73: Global Veterinary Biomarker Industry Revenue Million Forecast, by Application 2019 & 2032
- Table 74: Global Veterinary Biomarker Industry Revenue Million Forecast, by Disease Type 2019 & 2032
- Table 75: Global Veterinary Biomarker Industry Revenue Million Forecast, by Country 2019 & 2032
- Table 76: Brazil Veterinary Biomarker Industry Revenue (Million) Forecast, by Application 2019 & 2032
- Table 77: Argentina Veterinary Biomarker Industry Revenue (Million) Forecast, by Application 2019 & 2032
- Table 78: Rest of South America Veterinary Biomarker Industry Revenue (Million) Forecast, by Application 2019 & 2032
Frequently Asked Questions
1. What is the projected Compound Annual Growth Rate (CAGR) of the Veterinary Biomarker Industry?
The projected CAGR is approximately 11.80%.
2. Which companies are prominent players in the Veterinary Biomarker Industry?
Key companies in the market include Mercodia AB, Antech Diagnostics Inc, IDEXX Laboratories Inc, Merck & Co Inc, Zoetis, ACUVET BIOTECH, Veterinary Biomarkers Inc, MI:RNA Diagnostics Ltd, Avacta Animal Health Limited, Virbac.
3. What are the main segments of the Veterinary Biomarker Industry?
The market segments include Animal Type, Product Type, Application, Disease Type.
4. Can you provide details about the market size?
The market size is estimated to be USD XX Million as of 2022.
5. What are some drivers contributing to market growth?
High Prevalence of Chronic Diseases in Animals; Implementation of Innovative R&D Strategies by Prominent Players; Rising Pet Adoption Rates.
6. What are the notable trends driving market growth?
Biomarkers. Kits & Reagents Segment is Expected to Witness Significant Growth Over the Forecast Period.
7. Are there any restraints impacting market growth?
Expanding Pet Care Costs.
8. Can you provide examples of recent developments in the market?
In October 2022, researchers from Boston University Chobanian & Avedisian School of Medicine received USD 4.6 million grant from the National Institutes of Health for the development and validation of innovative biomarkers for lung cancer.
9. What pricing options are available for accessing the report?
Pricing options include single-user, multi-user, and enterprise licenses priced at USD 4750, USD 5250, and USD 8750 respectively.
10. Is the market size provided in terms of value or volume?
The market size is provided in terms of value, measured in Million.
11. Are there any specific market keywords associated with the report?
Yes, the market keyword associated with the report is "Veterinary Biomarker Industry," which aids in identifying and referencing the specific market segment covered.
12. How do I determine which pricing option suits my needs best?
The pricing options vary based on user requirements and access needs. Individual users may opt for single-user licenses, while businesses requiring broader access may choose multi-user or enterprise licenses for cost-effective access to the report.
13. Are there any additional resources or data provided in the Veterinary Biomarker Industry report?
While the report offers comprehensive insights, it's advisable to review the specific contents or supplementary materials provided to ascertain if additional resources or data are available.
14. How can I stay updated on further developments or reports in the Veterinary Biomarker Industry?
To stay informed about further developments, trends, and reports in the Veterinary Biomarker Industry, consider subscribing to industry newsletters, following relevant companies and organizations, or regularly checking reputable industry news sources and publications.
Methodology
Step 1 - Identification of Relevant Samples Size from Population Database


Step 2 - Approaches for Defining Global Market Size (Value, Volume* & Price*)

Note*: In applicable scenarios
Step 3 - Data Sources
Primary Research
- Web Analytics
- Survey Reports
- Research Institute
- Latest Research Reports
- Opinion Leaders
Secondary Research
- Annual Reports
- White Paper
- Latest Press Release
- Industry Association
- Paid Database
- Investor Presentations

Step 4 - Data Triangulation
Involves using different sources of information in order to increase the validity of a study
These sources are likely to be stakeholders in a program - participants, other researchers, program staff, other community members, and so on.
Then we put all data in single framework & apply various statistical tools to find out the dynamic on the market.
During the analysis stage, feedback from the stakeholder groups would be compared to determine areas of agreement as well as areas of divergence


