
Key Insights
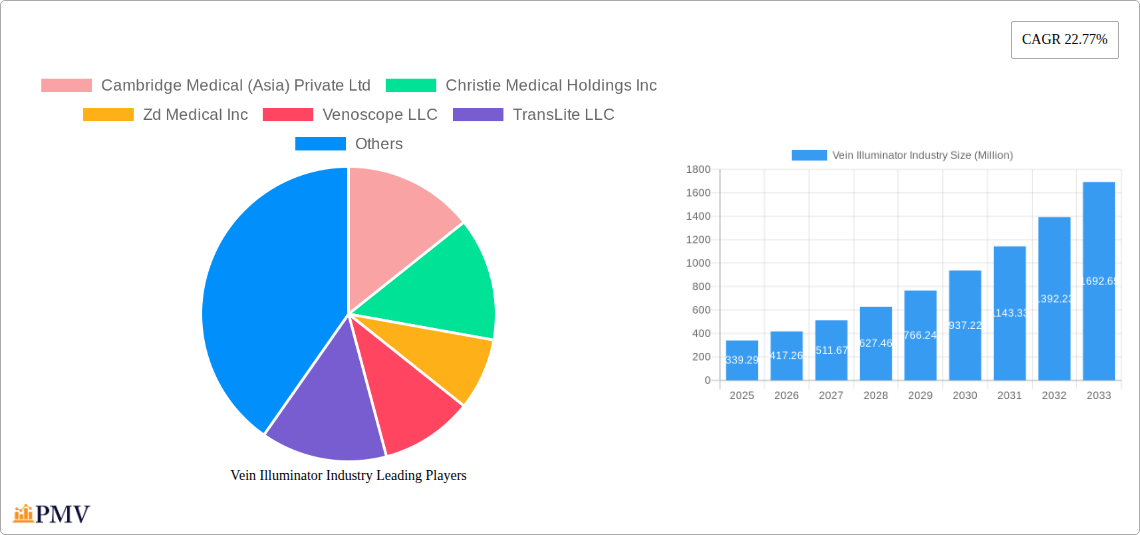
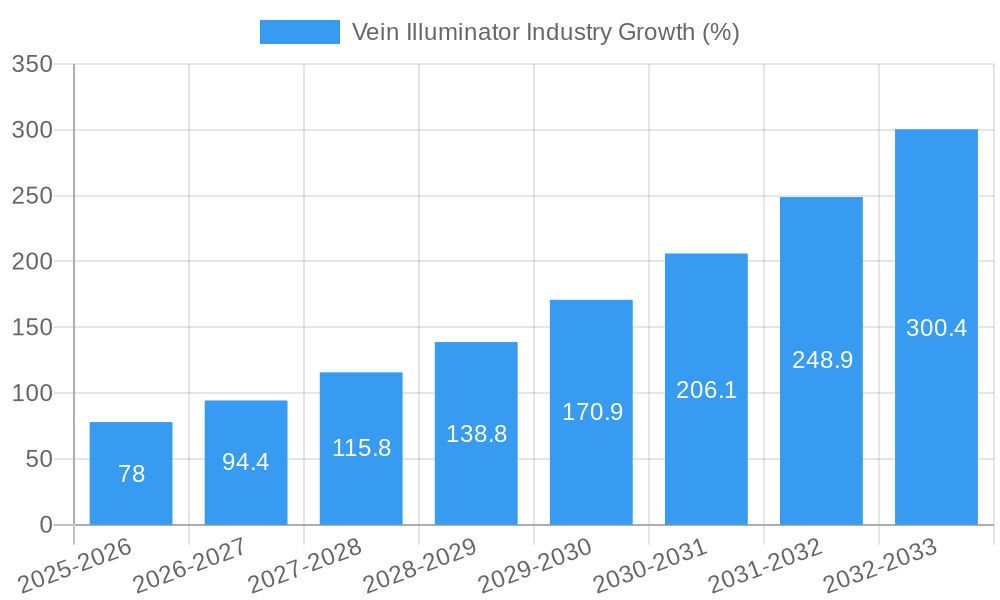
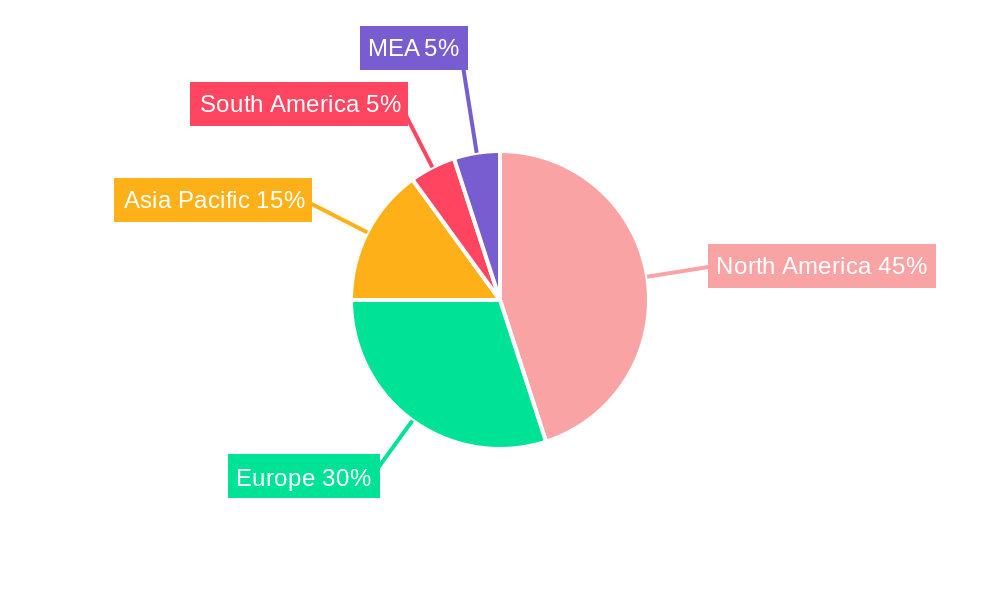
The vein illuminator market, valued at $339.29 million in 2025, is experiencing robust growth, projected to expand at a compound annual growth rate (CAGR) of 22.77% from 2025 to 2033. This significant expansion is driven by several key factors. The increasing prevalence of chronic diseases requiring frequent intravenous therapy, such as cancer and diabetes, fuels demand for accurate and efficient vein visualization. Technological advancements leading to more compact, portable, and user-friendly devices are also contributing to market growth. Furthermore, the rising adoption of minimally invasive procedures and the increasing focus on improving patient safety and reducing complications associated with venipuncture are bolstering market expansion. Growth is particularly strong in the hospital and blood bank segments due to high procedure volumes and the need for improved efficiency. North America currently dominates the market, owing to high healthcare expenditure and technological advancements, but the Asia-Pacific region is expected to witness substantial growth in the coming years due to rising healthcare infrastructure and increasing awareness of minimally invasive procedures.
The market segmentation reveals strong growth across various applications, with venipuncture assistance and IV access leading the way. The adoption of vein illuminators in sclerotherapy is also witnessing significant growth due to its ability to improve precision and reduce complications. While the market faces constraints such as high initial investment costs and the potential for device malfunction, ongoing technological innovation and the increasing awareness of the benefits of vein illuminators are expected to mitigate these challenges. Competitive landscape analysis shows several key players such as AccuVein Inc., Christie Medical Holdings Inc., and Cambridge Medical (Asia) Private Ltd. contributing to market innovation and expansion through product development and strategic partnerships. Future growth will be significantly impacted by the successful integration of advanced imaging technologies and further improvements in device usability and portability.
Vein Illuminator Industry Market Report: 2019-2033
This comprehensive report provides an in-depth analysis of the global Vein Illuminator industry, offering invaluable insights for stakeholders seeking to navigate this dynamic market. The report covers the period from 2019 to 2033, with 2025 as the base year and a forecast period spanning 2025-2033. The market is segmented by application (Venipuncture Assistance, IV Access, Sclerotherapy, Other Applications) and end-user (Hospital, Blood Camp, Rehabilitation, Academic Institution, Parademic Application, Other End Users). Key players analyzed include Cambridge Medical (Asia) Private Ltd, Christie Medical Holdings Inc, Zd Medical Inc, Venoscope LLC, TransLite LLC, VueTek Scientific LLC, AccuVein Inc, Sharn Anesthesia, and Near Infrared Imaging Inc. The report projects a market value exceeding XX Million by 2033.
Vein Illuminator Industry Market Structure & Competitive Dynamics
The Vein Illuminator market exhibits a moderately concentrated structure, with a few key players holding significant market share. AccuVein Inc and Christie Medical Holdings Inc currently command a leading position, while several smaller companies compete for niche segments. The industry’s innovation ecosystem is robust, characterized by ongoing research and development in areas like improved image quality, portability, and integration with Electronic Health Records (EHR). Regulatory frameworks vary across regions, influencing product approvals and market access. The primary substitute for vein illuminators is palpation, though its accuracy and efficiency limitations drive adoption of technological solutions. End-user trends reflect increasing demand for non-invasive procedures and improved patient experience. The past five years have seen limited M&A activity in the industry, with total deal values estimated at around XX Million. Future consolidations are likely, driven by the need for scale and enhanced technological capabilities.
- Market Concentration: Moderately concentrated, with AccuVein and Christie Medical holding significant shares.
- Innovation: Focus on image quality, portability, and EHR integration.
- Regulatory Framework: Varies regionally, impacting market access.
- Substitutes: Palpation; limited but presents a competitive challenge.
- M&A Activity (2019-2024): Estimated at approximately XX Million.
Vein Illuminator Industry Trends & Insights
The Vein Illuminator market is experiencing robust growth, driven by the rising prevalence of chronic diseases requiring frequent IV access and the increasing demand for minimally invasive procedures. The market is projected to achieve a Compound Annual Growth Rate (CAGR) of XX% during the forecast period (2025-2033). Technological advancements, such as improved near-infrared imaging technology, are enhancing the accuracy and ease of use of these devices, thereby increasing market penetration. Consumer preference leans towards portable, user-friendly devices that offer real-time visual guidance. Competitive dynamics are shaped by technological innovations, pricing strategies, and strategic partnerships. Market penetration, particularly in emerging economies, remains a significant growth opportunity. The development of wireless, portable devices is expected to drive further expansion. This growth, however, faces challenges such as high initial investment costs and limited reimbursement policies in certain healthcare settings.
Dominant Markets & Segments in Vein Illuminator Industry
The North American market currently dominates the Vein Illuminator landscape, fueled by high healthcare expenditure and advanced medical infrastructure. Within applications, Venipuncture Assistance holds the largest market share due to its widespread use in hospitals and blood banks. Hospitals remain the largest end-user segment, given their high volume of procedures requiring IV access and venipuncture.
- Dominant Region: North America
- Dominant Application: Venipuncture Assistance
- Dominant End-User: Hospitals
Key Drivers for North American Dominance:
- Advanced healthcare infrastructure
- High healthcare expenditure
- Favorable reimbursement policies
- Early adoption of new technologies
Key Drivers for Venipuncture Assistance Segment Dominance:
- High frequency of venipuncture procedures
- Improved patient experience and reduced complications
- Integration with existing workflows
Key Drivers for Hospital Segment Dominance:
- High volume of patients requiring IV access
- Availability of skilled medical personnel
- Investment in advanced medical technologies
Vein Illuminator Industry Product Innovations
Recent innovations in vein illuminators have focused on enhancing image quality, portability, and ease of use. Manufacturers are incorporating advanced near-infrared imaging technology and user-friendly interfaces to improve diagnostic accuracy and reduce procedure times. The integration of these devices with Electronic Health Records (EHR) systems is also gaining traction, streamlining workflows and enhancing data management. These developments improve the market fit by addressing key challenges of traditional methods, such as patient discomfort and increased risk of complications.
Report Segmentation & Scope
This report segments the Vein Illuminator market by application and end-user.
By Application:
Venipuncture Assistance: This segment is projected to witness substantial growth driven by increasing demand for accurate and efficient venipuncture procedures. Market size is expected to reach XX Million by 2033. Competitive dynamics are shaped by product innovation and pricing strategies.
IV Access: This segment exhibits steady growth, driven by the rising prevalence of chronic diseases requiring frequent IV access. Market size is predicted to be XX Million by 2033. Companies are focusing on developing devices with improved accuracy and ease of use.
Sclerotherapy: This segment shows moderate growth, primarily driven by the increasing use of sclerotherapy for treating varicose veins. Market size is estimated at XX Million by 2033.
Other Applications: This segment includes less common applications, which are expected to contribute a smaller but growing share of the market by 2033, reaching XX Million.
By End-User:
Hospital: This segment accounts for the largest share of the market due to high volume of procedures and focus on improving patient care. Market size is projected to reach XX Million by 2033.
Blood Camp: This segment shows consistent growth, driven by the need for efficient blood collection procedures. Market size is estimated to be XX Million by 2033.
Rehabilitation: This segment exhibits moderate growth, propelled by increasing demand for improved vascular access in rehabilitation settings. Market size by 2033 is expected to be XX Million.
Academic Institution: This segment displays modest growth, owing to its use in training and research activities. Market size is projected to be XX Million by 2033.
Parademic Application: This segment is experiencing growth driven by increasing demand for efficient vein access in emergency settings. Market size is estimated to be XX Million by 2033.
Other End Users: This segment encompasses other applications of vein illuminators and represents a smaller yet growing segment. Market size is expected to reach XX Million by 2033.
Key Drivers of Vein Illuminator Industry Growth
Several factors are driving the growth of the Vein Illuminator market. These include technological advancements resulting in improved accuracy and ease of use, the rising prevalence of chronic diseases requiring frequent IV access, and a growing preference for minimally invasive procedures among both patients and healthcare providers. Furthermore, favorable reimbursement policies in several regions are boosting market adoption. Government initiatives promoting advanced medical technologies also contribute to the overall growth.
Challenges in the Vein Illuminator Industry Sector
The Vein Illuminator industry faces challenges including high initial investment costs for advanced devices, stringent regulatory hurdles for product approvals, and potential supply chain disruptions. Competitive pressures from established players and emerging technologies also impact market dynamics. Furthermore, varying reimbursement policies across different healthcare systems create barriers to market entry and penetration in certain regions. These factors influence the overall growth trajectory of the industry.
Leading Players in the Vein Illuminator Industry Market
- AccuVein Inc
- Christie Medical Holdings Inc
- Zd Medical Inc
- Venoscope LLC
- TransLite LLC
- VueTek Scientific LLC
- Sharn Anesthesia
- Near Infrared Imaging Inc
- Cambridge Medical (Asia) Private Ltd
Key Developments in Vein Illuminator Industry Sector
- 2022 Q4: AccuVein Inc launched a new portable vein illuminator model.
- 2023 Q1: Christie Medical Holdings Inc announced a strategic partnership with a major hospital chain.
- 2023 Q3: Zd Medical Inc received FDA approval for a new vein illuminator technology. (Further developments would be added here as they occur)
Strategic Vein Illuminator Industry Market Outlook
The Vein Illuminator industry is poised for continued growth, driven by technological innovation, expanding applications, and favorable market dynamics. Strategic opportunities lie in developing advanced devices with improved image quality, portability, and integration with EHR systems. Expansion into emerging markets and strategic partnerships with key players in the healthcare sector will play a crucial role in shaping the future landscape. Focus on addressing regulatory challenges and improving accessibility will further accelerate market penetration and expansion.
Vein Illuminator Industry Segmentation
-
1. Application
- 1.1. Venipuncture Assistance
- 1.2. IV Access
- 1.3. Sclerotherapy
- 1.4. Other Applications
-
2. End User
- 2.1. Hospital
- 2.2. Blood Camp
- 2.3. Rehabilitation
- 2.4. Academic Institution
- 2.5. Parademic Application
- 2.6. Other End Users
Vein Illuminator Industry Segmentation By Geography
- 1. North America
- 2. Europe
- 3. Asia Pacific
- 4. Latin America
- 5. Middle East
Vein Illuminator Industry REPORT HIGHLIGHTS
| Aspects | Details |
|---|---|
| Study Period | 2019-2033 |
| Base Year | 2024 |
| Estimated Year | 2025 |
| Forecast Period | 2025-2033 |
| Historical Period | 2019-2024 |
| Growth Rate | CAGR of 22.77% from 2019-2033 |
| Segmentation |
|
Table of Contents
- 1. Introduction
- 1.1. Research Scope
- 1.2. Market Segmentation
- 1.3. Research Methodology
- 1.4. Definitions and Assumptions
- 2. Executive Summary
- 2.1. Introduction
- 3. Market Dynamics
- 3.1. Introduction
- 3.2. Market Drivers
- 3.2.1. ; Increased Success Rate of Blood Draw at First Attempt; Increased Patient Satisfaction
- 3.3. Market Restrains
- 3.3.1. ; Higher Costs
- 3.4. Market Trends
- 3.4.1. Growing Healthcare Spending and Equipment Market Expected to Drive the Market
- 4. Market Factor Analysis
- 4.1. Porters Five Forces
- 4.2. Supply/Value Chain
- 4.3. PESTEL analysis
- 4.4. Market Entropy
- 4.5. Patent/Trademark Analysis
- 5. Global Vein Illuminator Industry Analysis, Insights and Forecast, 2019-2031
- 5.1. Market Analysis, Insights and Forecast - by Application
- 5.1.1. Venipuncture Assistance
- 5.1.2. IV Access
- 5.1.3. Sclerotherapy
- 5.1.4. Other Applications
- 5.2. Market Analysis, Insights and Forecast - by End User
- 5.2.1. Hospital
- 5.2.2. Blood Camp
- 5.2.3. Rehabilitation
- 5.2.4. Academic Institution
- 5.2.5. Parademic Application
- 5.2.6. Other End Users
- 5.3. Market Analysis, Insights and Forecast - by Region
- 5.3.1. North America
- 5.3.2. Europe
- 5.3.3. Asia Pacific
- 5.3.4. Latin America
- 5.3.5. Middle East
- 5.1. Market Analysis, Insights and Forecast - by Application
- 6. North America Vein Illuminator Industry Analysis, Insights and Forecast, 2019-2031
- 6.1. Market Analysis, Insights and Forecast - by Application
- 6.1.1. Venipuncture Assistance
- 6.1.2. IV Access
- 6.1.3. Sclerotherapy
- 6.1.4. Other Applications
- 6.2. Market Analysis, Insights and Forecast - by End User
- 6.2.1. Hospital
- 6.2.2. Blood Camp
- 6.2.3. Rehabilitation
- 6.2.4. Academic Institution
- 6.2.5. Parademic Application
- 6.2.6. Other End Users
- 6.1. Market Analysis, Insights and Forecast - by Application
- 7. Europe Vein Illuminator Industry Analysis, Insights and Forecast, 2019-2031
- 7.1. Market Analysis, Insights and Forecast - by Application
- 7.1.1. Venipuncture Assistance
- 7.1.2. IV Access
- 7.1.3. Sclerotherapy
- 7.1.4. Other Applications
- 7.2. Market Analysis, Insights and Forecast - by End User
- 7.2.1. Hospital
- 7.2.2. Blood Camp
- 7.2.3. Rehabilitation
- 7.2.4. Academic Institution
- 7.2.5. Parademic Application
- 7.2.6. Other End Users
- 7.1. Market Analysis, Insights and Forecast - by Application
- 8. Asia Pacific Vein Illuminator Industry Analysis, Insights and Forecast, 2019-2031
- 8.1. Market Analysis, Insights and Forecast - by Application
- 8.1.1. Venipuncture Assistance
- 8.1.2. IV Access
- 8.1.3. Sclerotherapy
- 8.1.4. Other Applications
- 8.2. Market Analysis, Insights and Forecast - by End User
- 8.2.1. Hospital
- 8.2.2. Blood Camp
- 8.2.3. Rehabilitation
- 8.2.4. Academic Institution
- 8.2.5. Parademic Application
- 8.2.6. Other End Users
- 8.1. Market Analysis, Insights and Forecast - by Application
- 9. Latin America Vein Illuminator Industry Analysis, Insights and Forecast, 2019-2031
- 9.1. Market Analysis, Insights and Forecast - by Application
- 9.1.1. Venipuncture Assistance
- 9.1.2. IV Access
- 9.1.3. Sclerotherapy
- 9.1.4. Other Applications
- 9.2. Market Analysis, Insights and Forecast - by End User
- 9.2.1. Hospital
- 9.2.2. Blood Camp
- 9.2.3. Rehabilitation
- 9.2.4. Academic Institution
- 9.2.5. Parademic Application
- 9.2.6. Other End Users
- 9.1. Market Analysis, Insights and Forecast - by Application
- 10. Middle East Vein Illuminator Industry Analysis, Insights and Forecast, 2019-2031
- 10.1. Market Analysis, Insights and Forecast - by Application
- 10.1.1. Venipuncture Assistance
- 10.1.2. IV Access
- 10.1.3. Sclerotherapy
- 10.1.4. Other Applications
- 10.2. Market Analysis, Insights and Forecast - by End User
- 10.2.1. Hospital
- 10.2.2. Blood Camp
- 10.2.3. Rehabilitation
- 10.2.4. Academic Institution
- 10.2.5. Parademic Application
- 10.2.6. Other End Users
- 10.1. Market Analysis, Insights and Forecast - by Application
- 11. North America Vein Illuminator Industry Analysis, Insights and Forecast, 2019-2031
- 11.1. Market Analysis, Insights and Forecast - By Country/Sub-region
- 11.1.1 United States
- 11.1.2 Canada
- 11.1.3 Mexico
- 12. Europe Vein Illuminator Industry Analysis, Insights and Forecast, 2019-2031
- 12.1. Market Analysis, Insights and Forecast - By Country/Sub-region
- 12.1.1 Germany
- 12.1.2 United Kingdom
- 12.1.3 France
- 12.1.4 Spain
- 12.1.5 Italy
- 12.1.6 Spain
- 12.1.7 Belgium
- 12.1.8 Netherland
- 12.1.9 Nordics
- 12.1.10 Rest of Europe
- 13. Asia Pacific Vein Illuminator Industry Analysis, Insights and Forecast, 2019-2031
- 13.1. Market Analysis, Insights and Forecast - By Country/Sub-region
- 13.1.1 China
- 13.1.2 Japan
- 13.1.3 India
- 13.1.4 South Korea
- 13.1.5 Southeast Asia
- 13.1.6 Australia
- 13.1.7 Indonesia
- 13.1.8 Phillipes
- 13.1.9 Singapore
- 13.1.10 Thailandc
- 13.1.11 Rest of Asia Pacific
- 14. South America Vein Illuminator Industry Analysis, Insights and Forecast, 2019-2031
- 14.1. Market Analysis, Insights and Forecast - By Country/Sub-region
- 14.1.1 Brazil
- 14.1.2 Argentina
- 14.1.3 Peru
- 14.1.4 Chile
- 14.1.5 Colombia
- 14.1.6 Ecuador
- 14.1.7 Venezuela
- 14.1.8 Rest of South America
- 15. North America Vein Illuminator Industry Analysis, Insights and Forecast, 2019-2031
- 15.1. Market Analysis, Insights and Forecast - By Country/Sub-region
- 15.1.1 United States
- 15.1.2 Canada
- 15.1.3 Mexico
- 16. MEA Vein Illuminator Industry Analysis, Insights and Forecast, 2019-2031
- 16.1. Market Analysis, Insights and Forecast - By Country/Sub-region
- 16.1.1 United Arab Emirates
- 16.1.2 Saudi Arabia
- 16.1.3 South Africa
- 16.1.4 Rest of Middle East and Africa
- 17. Competitive Analysis
- 17.1. Global Market Share Analysis 2024
- 17.2. Company Profiles
- 17.2.1 Cambridge Medical (Asia) Private Ltd
- 17.2.1.1. Overview
- 17.2.1.2. Products
- 17.2.1.3. SWOT Analysis
- 17.2.1.4. Recent Developments
- 17.2.1.5. Financials (Based on Availability)
- 17.2.2 Christie Medical Holdings Inc
- 17.2.2.1. Overview
- 17.2.2.2. Products
- 17.2.2.3. SWOT Analysis
- 17.2.2.4. Recent Developments
- 17.2.2.5. Financials (Based on Availability)
- 17.2.3 Zd Medical Inc
- 17.2.3.1. Overview
- 17.2.3.2. Products
- 17.2.3.3. SWOT Analysis
- 17.2.3.4. Recent Developments
- 17.2.3.5. Financials (Based on Availability)
- 17.2.4 Venoscope LLC
- 17.2.4.1. Overview
- 17.2.4.2. Products
- 17.2.4.3. SWOT Analysis
- 17.2.4.4. Recent Developments
- 17.2.4.5. Financials (Based on Availability)
- 17.2.5 TransLite LLC
- 17.2.5.1. Overview
- 17.2.5.2. Products
- 17.2.5.3. SWOT Analysis
- 17.2.5.4. Recent Developments
- 17.2.5.5. Financials (Based on Availability)
- 17.2.6 VueTek Scientific LLC
- 17.2.6.1. Overview
- 17.2.6.2. Products
- 17.2.6.3. SWOT Analysis
- 17.2.6.4. Recent Developments
- 17.2.6.5. Financials (Based on Availability)
- 17.2.7 AccuVein Inc
- 17.2.7.1. Overview
- 17.2.7.2. Products
- 17.2.7.3. SWOT Analysis
- 17.2.7.4. Recent Developments
- 17.2.7.5. Financials (Based on Availability)
- 17.2.8 Sharn Anesthesia
- 17.2.8.1. Overview
- 17.2.8.2. Products
- 17.2.8.3. SWOT Analysis
- 17.2.8.4. Recent Developments
- 17.2.8.5. Financials (Based on Availability)
- 17.2.9 Near Infrared Imaging Inc
- 17.2.9.1. Overview
- 17.2.9.2. Products
- 17.2.9.3. SWOT Analysis
- 17.2.9.4. Recent Developments
- 17.2.9.5. Financials (Based on Availability)
- 17.2.1 Cambridge Medical (Asia) Private Ltd
List of Figures
- Figure 1: Global Vein Illuminator Industry Revenue Breakdown (Million, %) by Region 2024 & 2032
- Figure 2: Global Vein Illuminator Industry Volume Breakdown (K Unit, %) by Region 2024 & 2032
- Figure 3: North America Vein Illuminator Industry Revenue (Million), by Country 2024 & 2032
- Figure 4: North America Vein Illuminator Industry Volume (K Unit), by Country 2024 & 2032
- Figure 5: North America Vein Illuminator Industry Revenue Share (%), by Country 2024 & 2032
- Figure 6: North America Vein Illuminator Industry Volume Share (%), by Country 2024 & 2032
- Figure 7: Europe Vein Illuminator Industry Revenue (Million), by Country 2024 & 2032
- Figure 8: Europe Vein Illuminator Industry Volume (K Unit), by Country 2024 & 2032
- Figure 9: Europe Vein Illuminator Industry Revenue Share (%), by Country 2024 & 2032
- Figure 10: Europe Vein Illuminator Industry Volume Share (%), by Country 2024 & 2032
- Figure 11: Asia Pacific Vein Illuminator Industry Revenue (Million), by Country 2024 & 2032
- Figure 12: Asia Pacific Vein Illuminator Industry Volume (K Unit), by Country 2024 & 2032
- Figure 13: Asia Pacific Vein Illuminator Industry Revenue Share (%), by Country 2024 & 2032
- Figure 14: Asia Pacific Vein Illuminator Industry Volume Share (%), by Country 2024 & 2032
- Figure 15: South America Vein Illuminator Industry Revenue (Million), by Country 2024 & 2032
- Figure 16: South America Vein Illuminator Industry Volume (K Unit), by Country 2024 & 2032
- Figure 17: South America Vein Illuminator Industry Revenue Share (%), by Country 2024 & 2032
- Figure 18: South America Vein Illuminator Industry Volume Share (%), by Country 2024 & 2032
- Figure 19: North America Vein Illuminator Industry Revenue (Million), by Country 2024 & 2032
- Figure 20: North America Vein Illuminator Industry Volume (K Unit), by Country 2024 & 2032
- Figure 21: North America Vein Illuminator Industry Revenue Share (%), by Country 2024 & 2032
- Figure 22: North America Vein Illuminator Industry Volume Share (%), by Country 2024 & 2032
- Figure 23: MEA Vein Illuminator Industry Revenue (Million), by Country 2024 & 2032
- Figure 24: MEA Vein Illuminator Industry Volume (K Unit), by Country 2024 & 2032
- Figure 25: MEA Vein Illuminator Industry Revenue Share (%), by Country 2024 & 2032
- Figure 26: MEA Vein Illuminator Industry Volume Share (%), by Country 2024 & 2032
- Figure 27: North America Vein Illuminator Industry Revenue (Million), by Application 2024 & 2032
- Figure 28: North America Vein Illuminator Industry Volume (K Unit), by Application 2024 & 2032
- Figure 29: North America Vein Illuminator Industry Revenue Share (%), by Application 2024 & 2032
- Figure 30: North America Vein Illuminator Industry Volume Share (%), by Application 2024 & 2032
- Figure 31: North America Vein Illuminator Industry Revenue (Million), by End User 2024 & 2032
- Figure 32: North America Vein Illuminator Industry Volume (K Unit), by End User 2024 & 2032
- Figure 33: North America Vein Illuminator Industry Revenue Share (%), by End User 2024 & 2032
- Figure 34: North America Vein Illuminator Industry Volume Share (%), by End User 2024 & 2032
- Figure 35: North America Vein Illuminator Industry Revenue (Million), by Country 2024 & 2032
- Figure 36: North America Vein Illuminator Industry Volume (K Unit), by Country 2024 & 2032
- Figure 37: North America Vein Illuminator Industry Revenue Share (%), by Country 2024 & 2032
- Figure 38: North America Vein Illuminator Industry Volume Share (%), by Country 2024 & 2032
- Figure 39: Europe Vein Illuminator Industry Revenue (Million), by Application 2024 & 2032
- Figure 40: Europe Vein Illuminator Industry Volume (K Unit), by Application 2024 & 2032
- Figure 41: Europe Vein Illuminator Industry Revenue Share (%), by Application 2024 & 2032
- Figure 42: Europe Vein Illuminator Industry Volume Share (%), by Application 2024 & 2032
- Figure 43: Europe Vein Illuminator Industry Revenue (Million), by End User 2024 & 2032
- Figure 44: Europe Vein Illuminator Industry Volume (K Unit), by End User 2024 & 2032
- Figure 45: Europe Vein Illuminator Industry Revenue Share (%), by End User 2024 & 2032
- Figure 46: Europe Vein Illuminator Industry Volume Share (%), by End User 2024 & 2032
- Figure 47: Europe Vein Illuminator Industry Revenue (Million), by Country 2024 & 2032
- Figure 48: Europe Vein Illuminator Industry Volume (K Unit), by Country 2024 & 2032
- Figure 49: Europe Vein Illuminator Industry Revenue Share (%), by Country 2024 & 2032
- Figure 50: Europe Vein Illuminator Industry Volume Share (%), by Country 2024 & 2032
- Figure 51: Asia Pacific Vein Illuminator Industry Revenue (Million), by Application 2024 & 2032
- Figure 52: Asia Pacific Vein Illuminator Industry Volume (K Unit), by Application 2024 & 2032
- Figure 53: Asia Pacific Vein Illuminator Industry Revenue Share (%), by Application 2024 & 2032
- Figure 54: Asia Pacific Vein Illuminator Industry Volume Share (%), by Application 2024 & 2032
- Figure 55: Asia Pacific Vein Illuminator Industry Revenue (Million), by End User 2024 & 2032
- Figure 56: Asia Pacific Vein Illuminator Industry Volume (K Unit), by End User 2024 & 2032
- Figure 57: Asia Pacific Vein Illuminator Industry Revenue Share (%), by End User 2024 & 2032
- Figure 58: Asia Pacific Vein Illuminator Industry Volume Share (%), by End User 2024 & 2032
- Figure 59: Asia Pacific Vein Illuminator Industry Revenue (Million), by Country 2024 & 2032
- Figure 60: Asia Pacific Vein Illuminator Industry Volume (K Unit), by Country 2024 & 2032
- Figure 61: Asia Pacific Vein Illuminator Industry Revenue Share (%), by Country 2024 & 2032
- Figure 62: Asia Pacific Vein Illuminator Industry Volume Share (%), by Country 2024 & 2032
- Figure 63: Latin America Vein Illuminator Industry Revenue (Million), by Application 2024 & 2032
- Figure 64: Latin America Vein Illuminator Industry Volume (K Unit), by Application 2024 & 2032
- Figure 65: Latin America Vein Illuminator Industry Revenue Share (%), by Application 2024 & 2032
- Figure 66: Latin America Vein Illuminator Industry Volume Share (%), by Application 2024 & 2032
- Figure 67: Latin America Vein Illuminator Industry Revenue (Million), by End User 2024 & 2032
- Figure 68: Latin America Vein Illuminator Industry Volume (K Unit), by End User 2024 & 2032
- Figure 69: Latin America Vein Illuminator Industry Revenue Share (%), by End User 2024 & 2032
- Figure 70: Latin America Vein Illuminator Industry Volume Share (%), by End User 2024 & 2032
- Figure 71: Latin America Vein Illuminator Industry Revenue (Million), by Country 2024 & 2032
- Figure 72: Latin America Vein Illuminator Industry Volume (K Unit), by Country 2024 & 2032
- Figure 73: Latin America Vein Illuminator Industry Revenue Share (%), by Country 2024 & 2032
- Figure 74: Latin America Vein Illuminator Industry Volume Share (%), by Country 2024 & 2032
- Figure 75: Middle East Vein Illuminator Industry Revenue (Million), by Application 2024 & 2032
- Figure 76: Middle East Vein Illuminator Industry Volume (K Unit), by Application 2024 & 2032
- Figure 77: Middle East Vein Illuminator Industry Revenue Share (%), by Application 2024 & 2032
- Figure 78: Middle East Vein Illuminator Industry Volume Share (%), by Application 2024 & 2032
- Figure 79: Middle East Vein Illuminator Industry Revenue (Million), by End User 2024 & 2032
- Figure 80: Middle East Vein Illuminator Industry Volume (K Unit), by End User 2024 & 2032
- Figure 81: Middle East Vein Illuminator Industry Revenue Share (%), by End User 2024 & 2032
- Figure 82: Middle East Vein Illuminator Industry Volume Share (%), by End User 2024 & 2032
- Figure 83: Middle East Vein Illuminator Industry Revenue (Million), by Country 2024 & 2032
- Figure 84: Middle East Vein Illuminator Industry Volume (K Unit), by Country 2024 & 2032
- Figure 85: Middle East Vein Illuminator Industry Revenue Share (%), by Country 2024 & 2032
- Figure 86: Middle East Vein Illuminator Industry Volume Share (%), by Country 2024 & 2032
List of Tables
- Table 1: Global Vein Illuminator Industry Revenue Million Forecast, by Region 2019 & 2032
- Table 2: Global Vein Illuminator Industry Volume K Unit Forecast, by Region 2019 & 2032
- Table 3: Global Vein Illuminator Industry Revenue Million Forecast, by Application 2019 & 2032
- Table 4: Global Vein Illuminator Industry Volume K Unit Forecast, by Application 2019 & 2032
- Table 5: Global Vein Illuminator Industry Revenue Million Forecast, by End User 2019 & 2032
- Table 6: Global Vein Illuminator Industry Volume K Unit Forecast, by End User 2019 & 2032
- Table 7: Global Vein Illuminator Industry Revenue Million Forecast, by Region 2019 & 2032
- Table 8: Global Vein Illuminator Industry Volume K Unit Forecast, by Region 2019 & 2032
- Table 9: Global Vein Illuminator Industry Revenue Million Forecast, by Country 2019 & 2032
- Table 10: Global Vein Illuminator Industry Volume K Unit Forecast, by Country 2019 & 2032
- Table 11: United States Vein Illuminator Industry Revenue (Million) Forecast, by Application 2019 & 2032
- Table 12: United States Vein Illuminator Industry Volume (K Unit) Forecast, by Application 2019 & 2032
- Table 13: Canada Vein Illuminator Industry Revenue (Million) Forecast, by Application 2019 & 2032
- Table 14: Canada Vein Illuminator Industry Volume (K Unit) Forecast, by Application 2019 & 2032
- Table 15: Mexico Vein Illuminator Industry Revenue (Million) Forecast, by Application 2019 & 2032
- Table 16: Mexico Vein Illuminator Industry Volume (K Unit) Forecast, by Application 2019 & 2032
- Table 17: Global Vein Illuminator Industry Revenue Million Forecast, by Country 2019 & 2032
- Table 18: Global Vein Illuminator Industry Volume K Unit Forecast, by Country 2019 & 2032
- Table 19: Germany Vein Illuminator Industry Revenue (Million) Forecast, by Application 2019 & 2032
- Table 20: Germany Vein Illuminator Industry Volume (K Unit) Forecast, by Application 2019 & 2032
- Table 21: United Kingdom Vein Illuminator Industry Revenue (Million) Forecast, by Application 2019 & 2032
- Table 22: United Kingdom Vein Illuminator Industry Volume (K Unit) Forecast, by Application 2019 & 2032
- Table 23: France Vein Illuminator Industry Revenue (Million) Forecast, by Application 2019 & 2032
- Table 24: France Vein Illuminator Industry Volume (K Unit) Forecast, by Application 2019 & 2032
- Table 25: Spain Vein Illuminator Industry Revenue (Million) Forecast, by Application 2019 & 2032
- Table 26: Spain Vein Illuminator Industry Volume (K Unit) Forecast, by Application 2019 & 2032
- Table 27: Italy Vein Illuminator Industry Revenue (Million) Forecast, by Application 2019 & 2032
- Table 28: Italy Vein Illuminator Industry Volume (K Unit) Forecast, by Application 2019 & 2032
- Table 29: Spain Vein Illuminator Industry Revenue (Million) Forecast, by Application 2019 & 2032
- Table 30: Spain Vein Illuminator Industry Volume (K Unit) Forecast, by Application 2019 & 2032
- Table 31: Belgium Vein Illuminator Industry Revenue (Million) Forecast, by Application 2019 & 2032
- Table 32: Belgium Vein Illuminator Industry Volume (K Unit) Forecast, by Application 2019 & 2032
- Table 33: Netherland Vein Illuminator Industry Revenue (Million) Forecast, by Application 2019 & 2032
- Table 34: Netherland Vein Illuminator Industry Volume (K Unit) Forecast, by Application 2019 & 2032
- Table 35: Nordics Vein Illuminator Industry Revenue (Million) Forecast, by Application 2019 & 2032
- Table 36: Nordics Vein Illuminator Industry Volume (K Unit) Forecast, by Application 2019 & 2032
- Table 37: Rest of Europe Vein Illuminator Industry Revenue (Million) Forecast, by Application 2019 & 2032
- Table 38: Rest of Europe Vein Illuminator Industry Volume (K Unit) Forecast, by Application 2019 & 2032
- Table 39: Global Vein Illuminator Industry Revenue Million Forecast, by Country 2019 & 2032
- Table 40: Global Vein Illuminator Industry Volume K Unit Forecast, by Country 2019 & 2032
- Table 41: China Vein Illuminator Industry Revenue (Million) Forecast, by Application 2019 & 2032
- Table 42: China Vein Illuminator Industry Volume (K Unit) Forecast, by Application 2019 & 2032
- Table 43: Japan Vein Illuminator Industry Revenue (Million) Forecast, by Application 2019 & 2032
- Table 44: Japan Vein Illuminator Industry Volume (K Unit) Forecast, by Application 2019 & 2032
- Table 45: India Vein Illuminator Industry Revenue (Million) Forecast, by Application 2019 & 2032
- Table 46: India Vein Illuminator Industry Volume (K Unit) Forecast, by Application 2019 & 2032
- Table 47: South Korea Vein Illuminator Industry Revenue (Million) Forecast, by Application 2019 & 2032
- Table 48: South Korea Vein Illuminator Industry Volume (K Unit) Forecast, by Application 2019 & 2032
- Table 49: Southeast Asia Vein Illuminator Industry Revenue (Million) Forecast, by Application 2019 & 2032
- Table 50: Southeast Asia Vein Illuminator Industry Volume (K Unit) Forecast, by Application 2019 & 2032
- Table 51: Australia Vein Illuminator Industry Revenue (Million) Forecast, by Application 2019 & 2032
- Table 52: Australia Vein Illuminator Industry Volume (K Unit) Forecast, by Application 2019 & 2032
- Table 53: Indonesia Vein Illuminator Industry Revenue (Million) Forecast, by Application 2019 & 2032
- Table 54: Indonesia Vein Illuminator Industry Volume (K Unit) Forecast, by Application 2019 & 2032
- Table 55: Phillipes Vein Illuminator Industry Revenue (Million) Forecast, by Application 2019 & 2032
- Table 56: Phillipes Vein Illuminator Industry Volume (K Unit) Forecast, by Application 2019 & 2032
- Table 57: Singapore Vein Illuminator Industry Revenue (Million) Forecast, by Application 2019 & 2032
- Table 58: Singapore Vein Illuminator Industry Volume (K Unit) Forecast, by Application 2019 & 2032
- Table 59: Thailandc Vein Illuminator Industry Revenue (Million) Forecast, by Application 2019 & 2032
- Table 60: Thailandc Vein Illuminator Industry Volume (K Unit) Forecast, by Application 2019 & 2032
- Table 61: Rest of Asia Pacific Vein Illuminator Industry Revenue (Million) Forecast, by Application 2019 & 2032
- Table 62: Rest of Asia Pacific Vein Illuminator Industry Volume (K Unit) Forecast, by Application 2019 & 2032
- Table 63: Global Vein Illuminator Industry Revenue Million Forecast, by Country 2019 & 2032
- Table 64: Global Vein Illuminator Industry Volume K Unit Forecast, by Country 2019 & 2032
- Table 65: Brazil Vein Illuminator Industry Revenue (Million) Forecast, by Application 2019 & 2032
- Table 66: Brazil Vein Illuminator Industry Volume (K Unit) Forecast, by Application 2019 & 2032
- Table 67: Argentina Vein Illuminator Industry Revenue (Million) Forecast, by Application 2019 & 2032
- Table 68: Argentina Vein Illuminator Industry Volume (K Unit) Forecast, by Application 2019 & 2032
- Table 69: Peru Vein Illuminator Industry Revenue (Million) Forecast, by Application 2019 & 2032
- Table 70: Peru Vein Illuminator Industry Volume (K Unit) Forecast, by Application 2019 & 2032
- Table 71: Chile Vein Illuminator Industry Revenue (Million) Forecast, by Application 2019 & 2032
- Table 72: Chile Vein Illuminator Industry Volume (K Unit) Forecast, by Application 2019 & 2032
- Table 73: Colombia Vein Illuminator Industry Revenue (Million) Forecast, by Application 2019 & 2032
- Table 74: Colombia Vein Illuminator Industry Volume (K Unit) Forecast, by Application 2019 & 2032
- Table 75: Ecuador Vein Illuminator Industry Revenue (Million) Forecast, by Application 2019 & 2032
- Table 76: Ecuador Vein Illuminator Industry Volume (K Unit) Forecast, by Application 2019 & 2032
- Table 77: Venezuela Vein Illuminator Industry Revenue (Million) Forecast, by Application 2019 & 2032
- Table 78: Venezuela Vein Illuminator Industry Volume (K Unit) Forecast, by Application 2019 & 2032
- Table 79: Rest of South America Vein Illuminator Industry Revenue (Million) Forecast, by Application 2019 & 2032
- Table 80: Rest of South America Vein Illuminator Industry Volume (K Unit) Forecast, by Application 2019 & 2032
- Table 81: Global Vein Illuminator Industry Revenue Million Forecast, by Country 2019 & 2032
- Table 82: Global Vein Illuminator Industry Volume K Unit Forecast, by Country 2019 & 2032
- Table 83: United States Vein Illuminator Industry Revenue (Million) Forecast, by Application 2019 & 2032
- Table 84: United States Vein Illuminator Industry Volume (K Unit) Forecast, by Application 2019 & 2032
- Table 85: Canada Vein Illuminator Industry Revenue (Million) Forecast, by Application 2019 & 2032
- Table 86: Canada Vein Illuminator Industry Volume (K Unit) Forecast, by Application 2019 & 2032
- Table 87: Mexico Vein Illuminator Industry Revenue (Million) Forecast, by Application 2019 & 2032
- Table 88: Mexico Vein Illuminator Industry Volume (K Unit) Forecast, by Application 2019 & 2032
- Table 89: Global Vein Illuminator Industry Revenue Million Forecast, by Country 2019 & 2032
- Table 90: Global Vein Illuminator Industry Volume K Unit Forecast, by Country 2019 & 2032
- Table 91: United Arab Emirates Vein Illuminator Industry Revenue (Million) Forecast, by Application 2019 & 2032
- Table 92: United Arab Emirates Vein Illuminator Industry Volume (K Unit) Forecast, by Application 2019 & 2032
- Table 93: Saudi Arabia Vein Illuminator Industry Revenue (Million) Forecast, by Application 2019 & 2032
- Table 94: Saudi Arabia Vein Illuminator Industry Volume (K Unit) Forecast, by Application 2019 & 2032
- Table 95: South Africa Vein Illuminator Industry Revenue (Million) Forecast, by Application 2019 & 2032
- Table 96: South Africa Vein Illuminator Industry Volume (K Unit) Forecast, by Application 2019 & 2032
- Table 97: Rest of Middle East and Africa Vein Illuminator Industry Revenue (Million) Forecast, by Application 2019 & 2032
- Table 98: Rest of Middle East and Africa Vein Illuminator Industry Volume (K Unit) Forecast, by Application 2019 & 2032
- Table 99: Global Vein Illuminator Industry Revenue Million Forecast, by Application 2019 & 2032
- Table 100: Global Vein Illuminator Industry Volume K Unit Forecast, by Application 2019 & 2032
- Table 101: Global Vein Illuminator Industry Revenue Million Forecast, by End User 2019 & 2032
- Table 102: Global Vein Illuminator Industry Volume K Unit Forecast, by End User 2019 & 2032
- Table 103: Global Vein Illuminator Industry Revenue Million Forecast, by Country 2019 & 2032
- Table 104: Global Vein Illuminator Industry Volume K Unit Forecast, by Country 2019 & 2032
- Table 105: Global Vein Illuminator Industry Revenue Million Forecast, by Application 2019 & 2032
- Table 106: Global Vein Illuminator Industry Volume K Unit Forecast, by Application 2019 & 2032
- Table 107: Global Vein Illuminator Industry Revenue Million Forecast, by End User 2019 & 2032
- Table 108: Global Vein Illuminator Industry Volume K Unit Forecast, by End User 2019 & 2032
- Table 109: Global Vein Illuminator Industry Revenue Million Forecast, by Country 2019 & 2032
- Table 110: Global Vein Illuminator Industry Volume K Unit Forecast, by Country 2019 & 2032
- Table 111: Global Vein Illuminator Industry Revenue Million Forecast, by Application 2019 & 2032
- Table 112: Global Vein Illuminator Industry Volume K Unit Forecast, by Application 2019 & 2032
- Table 113: Global Vein Illuminator Industry Revenue Million Forecast, by End User 2019 & 2032
- Table 114: Global Vein Illuminator Industry Volume K Unit Forecast, by End User 2019 & 2032
- Table 115: Global Vein Illuminator Industry Revenue Million Forecast, by Country 2019 & 2032
- Table 116: Global Vein Illuminator Industry Volume K Unit Forecast, by Country 2019 & 2032
- Table 117: Global Vein Illuminator Industry Revenue Million Forecast, by Application 2019 & 2032
- Table 118: Global Vein Illuminator Industry Volume K Unit Forecast, by Application 2019 & 2032
- Table 119: Global Vein Illuminator Industry Revenue Million Forecast, by End User 2019 & 2032
- Table 120: Global Vein Illuminator Industry Volume K Unit Forecast, by End User 2019 & 2032
- Table 121: Global Vein Illuminator Industry Revenue Million Forecast, by Country 2019 & 2032
- Table 122: Global Vein Illuminator Industry Volume K Unit Forecast, by Country 2019 & 2032
- Table 123: Global Vein Illuminator Industry Revenue Million Forecast, by Application 2019 & 2032
- Table 124: Global Vein Illuminator Industry Volume K Unit Forecast, by Application 2019 & 2032
- Table 125: Global Vein Illuminator Industry Revenue Million Forecast, by End User 2019 & 2032
- Table 126: Global Vein Illuminator Industry Volume K Unit Forecast, by End User 2019 & 2032
- Table 127: Global Vein Illuminator Industry Revenue Million Forecast, by Country 2019 & 2032
- Table 128: Global Vein Illuminator Industry Volume K Unit Forecast, by Country 2019 & 2032
Frequently Asked Questions
1. What is the projected Compound Annual Growth Rate (CAGR) of the Vein Illuminator Industry?
The projected CAGR is approximately 22.77%.
2. Which companies are prominent players in the Vein Illuminator Industry?
Key companies in the market include Cambridge Medical (Asia) Private Ltd, Christie Medical Holdings Inc, Zd Medical Inc, Venoscope LLC, TransLite LLC, VueTek Scientific LLC, AccuVein Inc, Sharn Anesthesia, Near Infrared Imaging Inc.
3. What are the main segments of the Vein Illuminator Industry?
The market segments include Application, End User.
4. Can you provide details about the market size?
The market size is estimated to be USD 339.29 Million as of 2022.
5. What are some drivers contributing to market growth?
; Increased Success Rate of Blood Draw at First Attempt; Increased Patient Satisfaction.
6. What are the notable trends driving market growth?
Growing Healthcare Spending and Equipment Market Expected to Drive the Market.
7. Are there any restraints impacting market growth?
; Higher Costs.
8. Can you provide examples of recent developments in the market?
N/A
9. What pricing options are available for accessing the report?
Pricing options include single-user, multi-user, and enterprise licenses priced at USD 4750, USD 5250, and USD 8750 respectively.
10. Is the market size provided in terms of value or volume?
The market size is provided in terms of value, measured in Million and volume, measured in K Unit.
11. Are there any specific market keywords associated with the report?
Yes, the market keyword associated with the report is "Vein Illuminator Industry," which aids in identifying and referencing the specific market segment covered.
12. How do I determine which pricing option suits my needs best?
The pricing options vary based on user requirements and access needs. Individual users may opt for single-user licenses, while businesses requiring broader access may choose multi-user or enterprise licenses for cost-effective access to the report.
13. Are there any additional resources or data provided in the Vein Illuminator Industry report?
While the report offers comprehensive insights, it's advisable to review the specific contents or supplementary materials provided to ascertain if additional resources or data are available.
14. How can I stay updated on further developments or reports in the Vein Illuminator Industry?
To stay informed about further developments, trends, and reports in the Vein Illuminator Industry, consider subscribing to industry newsletters, following relevant companies and organizations, or regularly checking reputable industry news sources and publications.
Methodology
Step 1 - Identification of Relevant Samples Size from Population Database


Step 2 - Approaches for Defining Global Market Size (Value, Volume* & Price*)

Note*: In applicable scenarios
Step 3 - Data Sources
Primary Research
- Web Analytics
- Survey Reports
- Research Institute
- Latest Research Reports
- Opinion Leaders
Secondary Research
- Annual Reports
- White Paper
- Latest Press Release
- Industry Association
- Paid Database
- Investor Presentations

Step 4 - Data Triangulation
Involves using different sources of information in order to increase the validity of a study
These sources are likely to be stakeholders in a program - participants, other researchers, program staff, other community members, and so on.
Then we put all data in single framework & apply various statistical tools to find out the dynamic on the market.
During the analysis stage, feedback from the stakeholder groups would be compared to determine areas of agreement as well as areas of divergence


