

Key Insights
The global vegan protein supplement market is experiencing robust expansion, projected to reach an estimated USD 6.6 billion in 2025. This growth is fueled by a significant compound annual growth rate (CAGR) of 6.37%, indicating a dynamic and expanding sector. This upward trajectory is primarily driven by increasing consumer awareness regarding the health benefits of plant-based diets, including improved digestion, weight management, and reduced risk of chronic diseases. The rising prevalence of veganism and flexitarianism, propelled by ethical, environmental, and health concerns, is creating a substantial demand for protein sources free from animal products. Furthermore, the growing accessibility of vegan protein supplements through diverse retail channels, ranging from supermarkets and hypermarkets to dedicated online stores and direct-to-consumer (DTC) platforms, is making these products more convenient for a wider audience. Product innovation, with manufacturers introducing new flavors, formulations, and blends incorporating various plant-based proteins like soy, wheat, and pea, is also contributing to market attractiveness and consumer adoption.
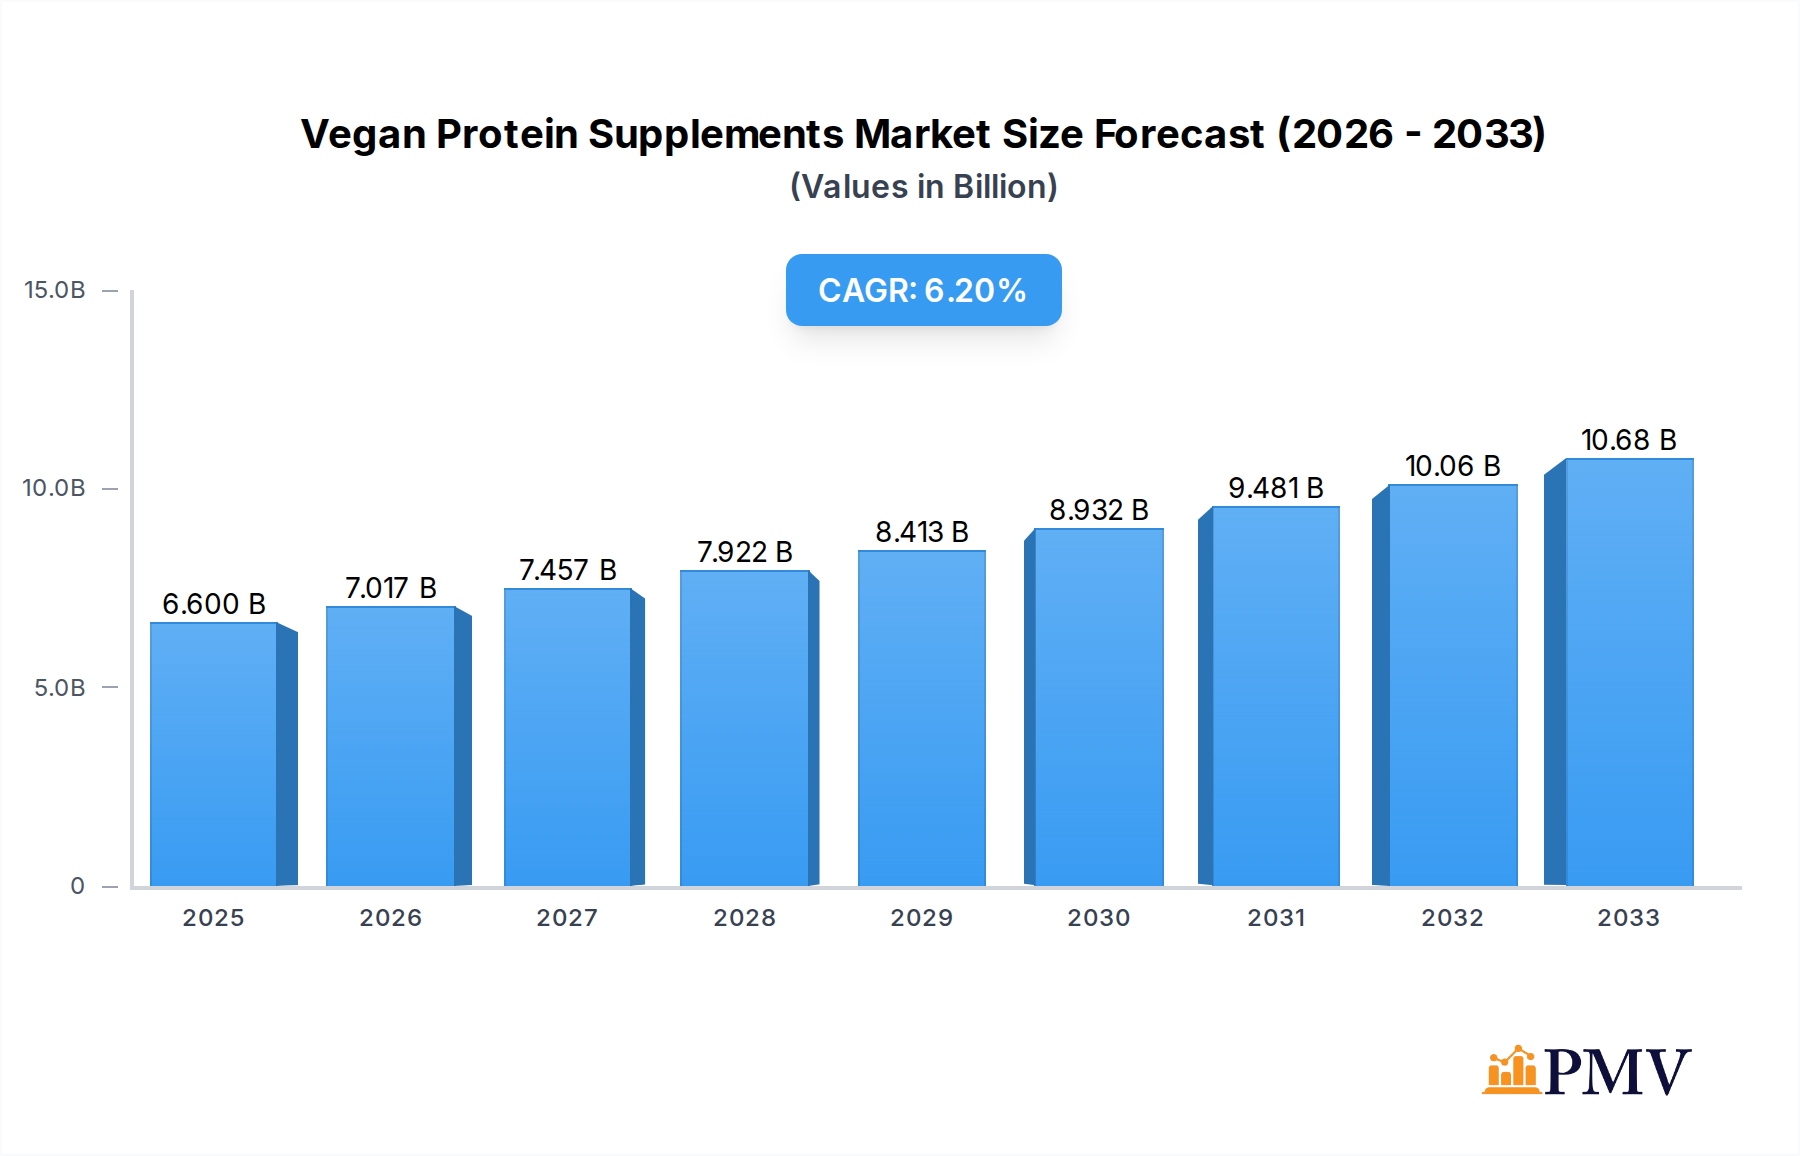
Vegan Protein Supplements Market Size (In Billion)
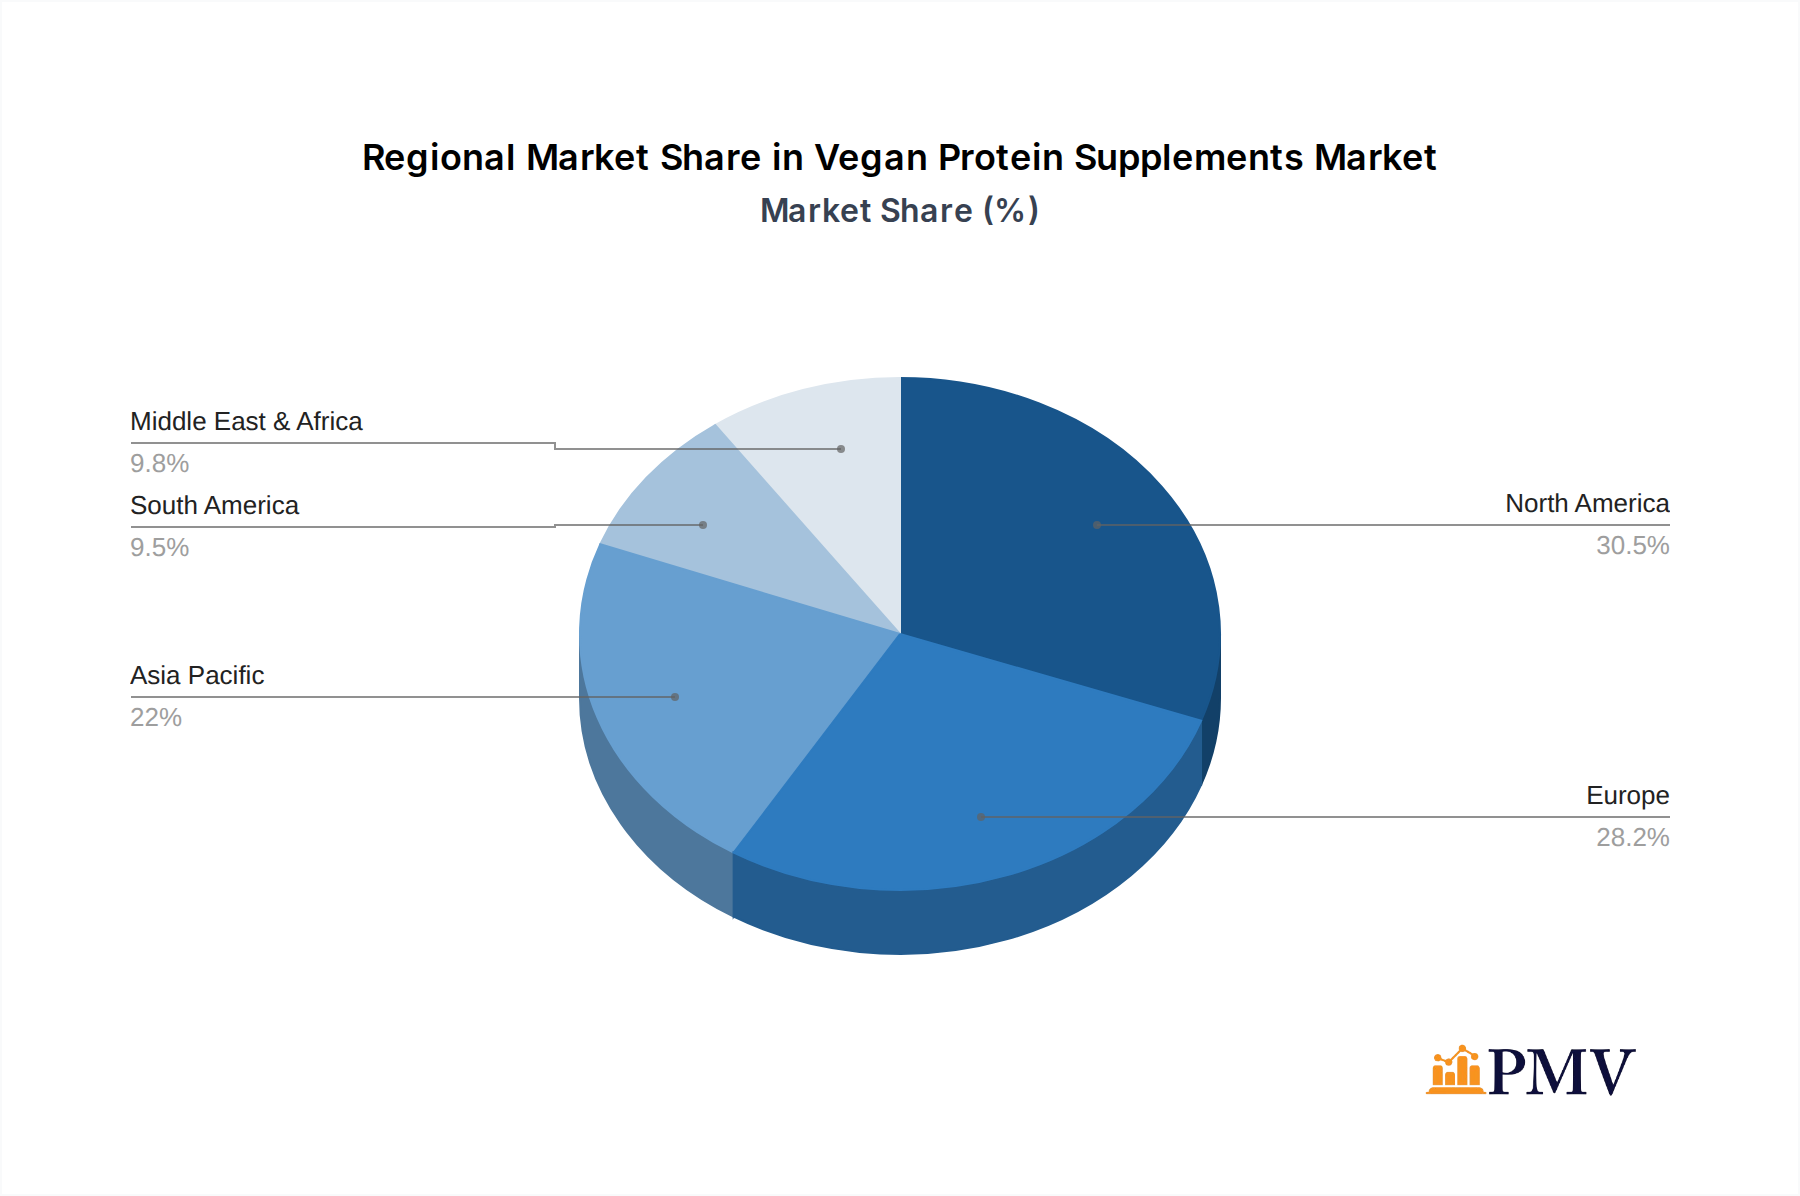
The market is segmented across key applications, with Supermarkets & Hypermarkets and Online Stores emerging as dominant distribution channels, reflecting evolving consumer purchasing habits. Direct to Customers (DTC) models are also gaining traction, offering personalized experiences and fostering brand loyalty. In terms of product types, Soy Protein continues to hold a significant share due to its affordability and established reputation, while Wheat Protein and Pea Protein are witnessing substantial growth, driven by consumer preference for allergen-free and sustainable options. The market is anticipated to witness continued innovation in protein blends and functional ingredients to cater to specific dietary needs and fitness goals. Geographically, North America and Europe are leading the market, with a strong presence of health-conscious consumers and established distribution networks. However, the Asia Pacific region is expected to exhibit the highest growth rate in the coming years, propelled by increasing disposable incomes, urbanization, and a growing adoption of Western dietary trends. Key players like Glanbia, NOW Foods, and MusclePharm Corp are actively engaged in product development, strategic partnerships, and market expansion to capitalize on these emerging opportunities.

Vegan Protein Supplements Company Market Share
Unlocking the Billion-Dollar Vegan Protein Supplements Market: A Comprehensive Industry Analysis (2019-2033)
This in-depth report provides a definitive analysis of the global Vegan Protein Supplements market, projected to reach XX billion USD by 2033. Spanning the historical period of 2019-2024, a base year of 2025, and a robust forecast period from 2025-2033, this study offers unparalleled insights into market structure, competitive dynamics, evolving trends, dominant segments, and strategic outlook. We delve into critical factors shaping this rapidly expanding sector, including consumer demand for plant-based nutrition, technological advancements in protein extraction and formulation, and the burgeoning influence of health and wellness trends.
Vegan Protein Supplements Market Structure & Competitive Dynamics
The Vegan Protein Supplements market exhibits a moderately concentrated structure, with a few major players holding significant market share, estimated at over XX billion USD in recent years. Glanbia, NOW Foods, and MusclePharm Corp are among the key companies driving innovation and market penetration. The innovation ecosystem is characterized by a strong focus on developing novel plant-based protein sources, improving taste profiles, and enhancing bioavailability. Regulatory frameworks are evolving, with increased scrutiny on ingredient sourcing, labeling accuracy, and health claims, impacting product development and market entry strategies. Product substitutes, while present, are increasingly being differentiated by specific nutritional benefits and sustainability credentials. End-user trends are overwhelmingly driven by the pursuit of healthy lifestyles, ethical consumerism, and environmental consciousness. Mergers and acquisitions (M&A) activity is a significant aspect of market consolidation, with recent deals valued in the billions of USD, indicating strategic moves by larger corporations to capture market share and expand their plant-based portfolios. For instance, PepsiCo's acquisition of CytoSport, Inc. underscores the growing interest in the sports nutrition sector, including vegan alternatives. The market share of leading companies is constantly being reassessed due to dynamic innovation and strategic partnerships.
Vegan Protein Supplements Industry Trends & Insights
The Vegan Protein Supplements industry is experiencing an unprecedented growth trajectory, fueled by a confluence of powerful market drivers and transformative trends. The global market size, currently valued at XX billion USD and projected to grow at a Compound Annual Growth Rate (CAGR) of XX% from 2025 to 2033, is a testament to its burgeoning appeal. A primary growth driver is the escalating consumer awareness regarding the health benefits associated with plant-based diets, including improved cardiovascular health, weight management, and reduced risk of chronic diseases. This surge in health consciousness is further amplified by a growing ethical imperative among consumers who are increasingly opting for vegan and cruelty-free products, aligning with their values of animal welfare and environmental sustainability. Technological disruptions are playing a pivotal role, with advancements in protein extraction, purification, and formulation techniques leading to superior taste, texture, and nutritional profiles of vegan protein powders. Innovations in ingredient sourcing, such as the utilization of novel plant sources like algae and hemp, are expanding the product landscape and catering to diverse dietary needs and preferences. Market penetration for vegan protein supplements is rapidly increasing across various demographics, particularly among millennials and Gen Z, who are at the forefront of adopting plant-centric lifestyles. Competitive dynamics are intensifying, with both established players and emerging startups vying for market dominance. Companies are investing heavily in research and development to differentiate their offerings, focusing on clean label formulations, allergen-free options, and functional benefits like enhanced muscle recovery and immune support. The rise of direct-to-consumer (DTC) channels has also democratized market access, allowing smaller brands to connect directly with consumers and build loyal communities. Furthermore, the integration of vegan protein into various food and beverage products, beyond traditional supplement formats, is broadening the market's reach and appeal. The global vegan protein supplements market is projected to reach XX billion USD by 2033, reflecting a sustained and robust expansion.
Dominant Markets & Segments in Vegan Protein Supplements
The Vegan Protein Supplements market showcases distinct dominance across various regions and application segments, driven by a complex interplay of economic policies, consumer behavior, and infrastructural development.
Application Dominance:
Online Stores: This segment has emerged as a dominant force, projected to account for approximately XX% of the total market revenue by 2033, valued at XX billion USD. Key drivers include:
- Convenience and Accessibility: Online platforms offer unparalleled ease of browsing, comparing, and purchasing vegan protein supplements from the comfort of one's home.
- Wider Product Selection: E-commerce sites typically feature a broader range of brands, formulations, and specialized products compared to brick-and-mortar stores.
- Competitive Pricing and Promotions: Online retailers often provide attractive discounts, loyalty programs, and bundled offers, appealing to price-sensitive consumers.
- Data-Driven Personalization: Advanced algorithms enable personalized product recommendations and targeted marketing campaigns, enhancing the customer experience.
- Global Reach: Online stores transcend geographical limitations, allowing consumers worldwide to access a diverse array of vegan protein options.
Supermarkets & Hypermarkets: This traditional retail channel maintains a significant presence, holding an estimated XX% market share and contributing XX billion USD to the market by 2033. Its dominance is sustained by:
- Impulse Purchases and Brand Visibility: Prominent shelf placement in high-traffic areas drives impulse buys and enhances brand recognition.
- Immediate Availability: Consumers can purchase products immediately, fulfilling immediate dietary needs or workout routines.
- Trust and Familiarity: Established supermarket brands lend a sense of credibility and trustworthiness to the products they stock.
- Grocery Shopping Integration: Consumers often purchase protein supplements as part of their regular grocery shopping, offering convenience.
Direct to Customers (DTC): The DTC channel is rapidly gaining traction, with an anticipated market share of XX% and a projected revenue of XX billion USD by 2033. Its growth is propelled by:
- Enhanced Brand Control and Customer Relationships: DTC allows brands to cultivate direct relationships with their customers, fostering loyalty and gathering valuable feedback.
- Higher Profit Margins: Eliminating intermediaries can lead to improved profitability for manufacturers.
- Subscription Models: Offering convenient subscription services for recurring purchases ensures customer retention and predictable revenue.
- Personalized Experiences: Brands can curate tailored product offerings and marketing messages for individual customers.
Others: This segment, encompassing specialized health food stores and gyms, accounts for the remaining XX% of the market, estimated at XX billion USD. These channels cater to niche markets and offer expert advice, contributing to their sustained relevance.
Type Dominance:
Pea Protein: This type is projected to remain the dominant segment, capturing approximately XX% of the market and valued at XX billion USD by 2033. Its dominance is attributed to:
- High Protein Content and Amino Acid Profile: Pea protein offers a complete amino acid profile, comparable to animal-based proteins.
- Hypoallergenic Properties: It is generally well-tolerated by individuals with common allergies to soy or dairy.
- Sustainability and Environmental Friendliness: Pea cultivation is relatively sustainable, requiring less water and land compared to some other protein sources.
- Versatility in Formulation: Its mild flavor and smooth texture make it easy to incorporate into various supplement formulations and food products.
Soy Protein: Historically a dominant source, soy protein is expected to hold a XX% market share by 2033, valued at XX billion USD. Its continued relevance is due to:
- Cost-Effectiveness: Soy protein is generally more affordable than other plant-based protein sources.
- Established Nutritional Profile: Decades of research have validated its nutritional benefits.
- Wide Availability: Soy is a globally cultivated crop, ensuring consistent supply.
Wheat Protein: This segment is projected to capture XX% of the market by 2033, valued at XX billion USD. Its appeal lies in:
- Availability and Affordability: Wheat is a widely grown cereal grain, making wheat protein a cost-effective option.
- Specific Functional Properties: It can contribute to texture and binding in certain food applications.
Others: This encompasses emerging protein sources like rice, hemp, pumpkin seed, and algae proteins, collectively holding an anticipated XX% market share and valued at XX billion USD by 2033. The growth in this segment is driven by innovation and consumer demand for novel, allergen-friendly, and nutrient-dense options.
Vegan Protein Supplements Product Innovations
Product innovation in the vegan protein supplements sector is primarily focused on enhancing taste, texture, and functionality while addressing allergen concerns and promoting sustainability. Companies are developing novel blends of plant proteins, such as combinations of pea, rice, and hemp, to achieve optimal amino acid profiles and improved digestibility. Advanced processing techniques are employed to reduce the gritty texture often associated with plant-based proteins, resulting in smoother, more palatable products. Innovations in flavor masking and natural flavoring agents are crucial for overcoming the sometimes-earthy taste of plant proteins. Furthermore, the development of specialized vegan protein supplements targeted at specific needs, such as post-workout recovery, weight management, and immune support, with added ingredients like BCAAs, digestive enzymes, and adaptogens, is a key competitive advantage. The emphasis on clean labels, free from artificial sweeteners, colors, and preservatives, is also a significant trend. These developments aim to broaden the appeal of vegan protein supplements to a wider consumer base, including athletes, fitness enthusiasts, and everyday individuals seeking convenient and healthy protein sources.
Report Segmentation & Scope
This report meticulously segments the global Vegan Protein Supplements market across key dimensions to provide a comprehensive market overview. The Application segmentation includes: Supermarkets & Hypermarkets, Online Stores, Direct to Customers (DTC), and Others. Each of these segments is analyzed for its market size, growth projections (estimated to reach XX billion USD for Online Stores and XX billion USD for DTC by 2033), and competitive dynamics. The Types segmentation covers: Soy Protein, Wheat Protein, Pea Protein, and Others, with detailed insights into their respective market shares and projected growth trajectories, indicating a substantial market value for Pea Protein exceeding XX billion USD by 2033. The scope of the study encompasses a thorough examination of market drivers, challenges, trends, and the competitive landscape throughout the forecast period of 2025–2033.
Key Drivers of Vegan Protein Supplements Growth
The Vegan Protein Supplements market's remarkable growth is propelled by several interconnected factors. A primary driver is the significant shift in consumer dietary preferences towards plant-based and flexitarian diets, fueled by increasing awareness of health benefits and ethical considerations. Technological advancements in protein extraction and formulation have led to improved taste, texture, and nutritional profiles of vegan protein products, making them more appealing. The rising popularity of fitness and wellness culture globally further boosts demand, as individuals seek convenient and effective ways to meet their protein intake goals. Government initiatives promoting sustainable agriculture and healthier food choices indirectly support the market. Moreover, the increasing prevalence of lactose intolerance and dairy allergies has created a larger market for dairy-free protein alternatives. The estimated market size growth, projected to reach XX billion USD by 2033, underscores the power of these drivers.
Challenges in the Vegan Protein Supplements Sector
Despite robust growth, the Vegan Protein Supplements sector faces several challenges. One significant barrier is the perception of inferior taste and texture compared to whey or casein-based proteins, which companies are actively working to overcome. Sourcing and supply chain complexities for certain plant-based protein ingredients can lead to price volatility and availability issues. The presence of numerous brands and product varieties can create market fragmentation and intense competition, making it challenging for new entrants. Regulatory hurdles related to health claims and product labeling require careful navigation. Furthermore, a segment of consumers remains skeptical about the complete nutritional profile of plant-based proteins, necessitating ongoing consumer education. Addressing these challenges, estimated to impact market growth by up to XX% annually, is crucial for sustained expansion.
Leading Players in the Vegan Protein Supplements Market
- Glanbia
- NOW Foods
- MusclePharm Corp
- CytoSport, Inc. (PepsiCo)
- Simply Good Foods
- NBTY (The Bountiful Company)
- AMCO Proteins
- Iovate Health Sciences International
- Nutrabolt
- Dymatize Enterprises
- Jym Supplement Science
- RSP Nutrition
- BPI Sports LLC
- International Dehydrated Foods
- BRF
- Rousselot
- Gelita
- Hoogwegt
Key Developments in Vegan Protein Supplements Sector
- 2023: Launch of innovative pea protein isolate with improved solubility and neutral flavor profile by a major manufacturer.
- 2023: Acquisition of a leading plant-based ingredient supplier by a global food conglomerate, signaling consolidation.
- 2022: Introduction of a new line of vegan protein powders fortified with adaptogens for stress management.
- 2022: Significant investment in R&D for novel protein sources like fava bean and pumpkin seed.
- 2021: Emergence of subscription-based models for vegan protein supplements, enhancing customer loyalty.
- 2020: Increased focus on sustainable sourcing and eco-friendly packaging solutions by key industry players.
- 2019: Expansion of product offerings to include vegan protein bars and ready-to-drink beverages by several prominent brands.
Strategic Vegan Protein Supplements Market Outlook
The strategic outlook for the Vegan Protein Supplements market remains exceptionally positive, characterized by sustained growth accelerators and emerging opportunities. The increasing global adoption of plant-based lifestyles, driven by health, ethical, and environmental concerns, will continue to be the primary growth engine. Innovations in protein extraction, taste enhancement, and functional ingredient integration will further broaden consumer appeal and market penetration, projected to reach XX% by 2033. The expanding e-commerce and DTC channels offer strategic avenues for direct consumer engagement and personalized offerings, while traditional retail continues to play a crucial role in accessibility. Strategic partnerships and potential M&A activities will likely reshape the competitive landscape, with companies focusing on expanding their portfolios and global reach. The market is poised for continued expansion, with opportunities in functional ingredients, niche protein sources, and sustainable product development.
Vegan Protein Supplements Segmentation
-
1. Application
- 1.1. Supermarkets & Hypermarkets
- 1.2. Online Stores
- 1.3. Direct to Customers (DTC)
- 1.4. Others
-
2. Types
- 2.1. Soy Protein
- 2.2. Wheat Protein
- 2.3. Pea Protein
- 2.4. Others
Vegan Protein Supplements Segmentation By Geography
-
1. North America
- 1.1. United States
- 1.2. Canada
- 1.3. Mexico
-
2. South America
- 2.1. Brazil
- 2.2. Argentina
- 2.3. Rest of South America
-
3. Europe
- 3.1. United Kingdom
- 3.2. Germany
- 3.3. France
- 3.4. Italy
- 3.5. Spain
- 3.6. Russia
- 3.7. Benelux
- 3.8. Nordics
- 3.9. Rest of Europe
-
4. Middle East & Africa
- 4.1. Turkey
- 4.2. Israel
- 4.3. GCC
- 4.4. North Africa
- 4.5. South Africa
- 4.6. Rest of Middle East & Africa
-
5. Asia Pacific
- 5.1. China
- 5.2. India
- 5.3. Japan
- 5.4. South Korea
- 5.5. ASEAN
- 5.6. Oceania
- 5.7. Rest of Asia Pacific
Vegan Protein Supplements Regional Market Share
Geographic Coverage of Vegan Protein Supplements
Vegan Protein Supplements REPORT HIGHLIGHTS
| Aspects | Details |
|---|---|
| Study Period | 2020-2034 |
| Base Year | 2025 |
| Estimated Year | 2026 |
| Forecast Period | 2026-2034 |
| Historical Period | 2020-2025 |
| Growth Rate | CAGR of 6.37% from 2020-2034 |
| Segmentation |
|
Table of Contents
- 1. Introduction
- 1.1. Research Scope
- 1.2. Market Segmentation
- 1.3. Research Methodology
- 1.4. Definitions and Assumptions
- 2. Executive Summary
- 2.1. Introduction
- 3. Market Dynamics
- 3.1. Introduction
- 3.2. Market Drivers
- 3.3. Market Restrains
- 3.4. Market Trends
- 4. Market Factor Analysis
- 4.1. Porters Five Forces
- 4.2. Supply/Value Chain
- 4.3. PESTEL analysis
- 4.4. Market Entropy
- 4.5. Patent/Trademark Analysis
- 5. Global Vegan Protein Supplements Analysis, Insights and Forecast, 2020-2032
- 5.1. Market Analysis, Insights and Forecast - by Application
- 5.1.1. Supermarkets & Hypermarkets
- 5.1.2. Online Stores
- 5.1.3. Direct to Customers (DTC)
- 5.1.4. Others
- 5.2. Market Analysis, Insights and Forecast - by Types
- 5.2.1. Soy Protein
- 5.2.2. Wheat Protein
- 5.2.3. Pea Protein
- 5.2.4. Others
- 5.3. Market Analysis, Insights and Forecast - by Region
- 5.3.1. North America
- 5.3.2. South America
- 5.3.3. Europe
- 5.3.4. Middle East & Africa
- 5.3.5. Asia Pacific
- 5.1. Market Analysis, Insights and Forecast - by Application
- 6. North America Vegan Protein Supplements Analysis, Insights and Forecast, 2020-2032
- 6.1. Market Analysis, Insights and Forecast - by Application
- 6.1.1. Supermarkets & Hypermarkets
- 6.1.2. Online Stores
- 6.1.3. Direct to Customers (DTC)
- 6.1.4. Others
- 6.2. Market Analysis, Insights and Forecast - by Types
- 6.2.1. Soy Protein
- 6.2.2. Wheat Protein
- 6.2.3. Pea Protein
- 6.2.4. Others
- 6.1. Market Analysis, Insights and Forecast - by Application
- 7. South America Vegan Protein Supplements Analysis, Insights and Forecast, 2020-2032
- 7.1. Market Analysis, Insights and Forecast - by Application
- 7.1.1. Supermarkets & Hypermarkets
- 7.1.2. Online Stores
- 7.1.3. Direct to Customers (DTC)
- 7.1.4. Others
- 7.2. Market Analysis, Insights and Forecast - by Types
- 7.2.1. Soy Protein
- 7.2.2. Wheat Protein
- 7.2.3. Pea Protein
- 7.2.4. Others
- 7.1. Market Analysis, Insights and Forecast - by Application
- 8. Europe Vegan Protein Supplements Analysis, Insights and Forecast, 2020-2032
- 8.1. Market Analysis, Insights and Forecast - by Application
- 8.1.1. Supermarkets & Hypermarkets
- 8.1.2. Online Stores
- 8.1.3. Direct to Customers (DTC)
- 8.1.4. Others
- 8.2. Market Analysis, Insights and Forecast - by Types
- 8.2.1. Soy Protein
- 8.2.2. Wheat Protein
- 8.2.3. Pea Protein
- 8.2.4. Others
- 8.1. Market Analysis, Insights and Forecast - by Application
- 9. Middle East & Africa Vegan Protein Supplements Analysis, Insights and Forecast, 2020-2032
- 9.1. Market Analysis, Insights and Forecast - by Application
- 9.1.1. Supermarkets & Hypermarkets
- 9.1.2. Online Stores
- 9.1.3. Direct to Customers (DTC)
- 9.1.4. Others
- 9.2. Market Analysis, Insights and Forecast - by Types
- 9.2.1. Soy Protein
- 9.2.2. Wheat Protein
- 9.2.3. Pea Protein
- 9.2.4. Others
- 9.1. Market Analysis, Insights and Forecast - by Application
- 10. Asia Pacific Vegan Protein Supplements Analysis, Insights and Forecast, 2020-2032
- 10.1. Market Analysis, Insights and Forecast - by Application
- 10.1.1. Supermarkets & Hypermarkets
- 10.1.2. Online Stores
- 10.1.3. Direct to Customers (DTC)
- 10.1.4. Others
- 10.2. Market Analysis, Insights and Forecast - by Types
- 10.2.1. Soy Protein
- 10.2.2. Wheat Protein
- 10.2.3. Pea Protein
- 10.2.4. Others
- 10.1. Market Analysis, Insights and Forecast - by Application
- 11. Competitive Analysis
- 11.1. Global Market Share Analysis 2025
- 11.2. Company Profiles
- 11.2.1 Glanbia
- 11.2.1.1. Overview
- 11.2.1.2. Products
- 11.2.1.3. SWOT Analysis
- 11.2.1.4. Recent Developments
- 11.2.1.5. Financials (Based on Availability)
- 11.2.2 NOW Foods
- 11.2.2.1. Overview
- 11.2.2.2. Products
- 11.2.2.3. SWOT Analysis
- 11.2.2.4. Recent Developments
- 11.2.2.5. Financials (Based on Availability)
- 11.2.3 MusclePharm Corp
- 11.2.3.1. Overview
- 11.2.3.2. Products
- 11.2.3.3. SWOT Analysis
- 11.2.3.4. Recent Developments
- 11.2.3.5. Financials (Based on Availability)
- 11.2.4 CytoSport
- 11.2.4.1. Overview
- 11.2.4.2. Products
- 11.2.4.3. SWOT Analysis
- 11.2.4.4. Recent Developments
- 11.2.4.5. Financials (Based on Availability)
- 11.2.5 Inc. (PepsiCo)
- 11.2.5.1. Overview
- 11.2.5.2. Products
- 11.2.5.3. SWOT Analysis
- 11.2.5.4. Recent Developments
- 11.2.5.5. Financials (Based on Availability)
- 11.2.6 Simply Good Foods
- 11.2.6.1. Overview
- 11.2.6.2. Products
- 11.2.6.3. SWOT Analysis
- 11.2.6.4. Recent Developments
- 11.2.6.5. Financials (Based on Availability)
- 11.2.7 NBTY (The Bountiful Company)
- 11.2.7.1. Overview
- 11.2.7.2. Products
- 11.2.7.3. SWOT Analysis
- 11.2.7.4. Recent Developments
- 11.2.7.5. Financials (Based on Availability)
- 11.2.8 AMCO Proteins
- 11.2.8.1. Overview
- 11.2.8.2. Products
- 11.2.8.3. SWOT Analysis
- 11.2.8.4. Recent Developments
- 11.2.8.5. Financials (Based on Availability)
- 11.2.9 Iovate Health Sciences International
- 11.2.9.1. Overview
- 11.2.9.2. Products
- 11.2.9.3. SWOT Analysis
- 11.2.9.4. Recent Developments
- 11.2.9.5. Financials (Based on Availability)
- 11.2.10 Nutrabolt
- 11.2.10.1. Overview
- 11.2.10.2. Products
- 11.2.10.3. SWOT Analysis
- 11.2.10.4. Recent Developments
- 11.2.10.5. Financials (Based on Availability)
- 11.2.11 Dymatize Enterprises
- 11.2.11.1. Overview
- 11.2.11.2. Products
- 11.2.11.3. SWOT Analysis
- 11.2.11.4. Recent Developments
- 11.2.11.5. Financials (Based on Availability)
- 11.2.12 Jym Supplement Science
- 11.2.12.1. Overview
- 11.2.12.2. Products
- 11.2.12.3. SWOT Analysis
- 11.2.12.4. Recent Developments
- 11.2.12.5. Financials (Based on Availability)
- 11.2.13 RSP Nutrition
- 11.2.13.1. Overview
- 11.2.13.2. Products
- 11.2.13.3. SWOT Analysis
- 11.2.13.4. Recent Developments
- 11.2.13.5. Financials (Based on Availability)
- 11.2.14 BPI Sports LLC
- 11.2.14.1. Overview
- 11.2.14.2. Products
- 11.2.14.3. SWOT Analysis
- 11.2.14.4. Recent Developments
- 11.2.14.5. Financials (Based on Availability)
- 11.2.15 International Dehydrated Foods
- 11.2.15.1. Overview
- 11.2.15.2. Products
- 11.2.15.3. SWOT Analysis
- 11.2.15.4. Recent Developments
- 11.2.15.5. Financials (Based on Availability)
- 11.2.16 BRF
- 11.2.16.1. Overview
- 11.2.16.2. Products
- 11.2.16.3. SWOT Analysis
- 11.2.16.4. Recent Developments
- 11.2.16.5. Financials (Based on Availability)
- 11.2.17 Rousselot
- 11.2.17.1. Overview
- 11.2.17.2. Products
- 11.2.17.3. SWOT Analysis
- 11.2.17.4. Recent Developments
- 11.2.17.5. Financials (Based on Availability)
- 11.2.18 Gelita
- 11.2.18.1. Overview
- 11.2.18.2. Products
- 11.2.18.3. SWOT Analysis
- 11.2.18.4. Recent Developments
- 11.2.18.5. Financials (Based on Availability)
- 11.2.19 Hoogwegt
- 11.2.19.1. Overview
- 11.2.19.2. Products
- 11.2.19.3. SWOT Analysis
- 11.2.19.4. Recent Developments
- 11.2.19.5. Financials (Based on Availability)
- 11.2.1 Glanbia
List of Figures
- Figure 1: Global Vegan Protein Supplements Revenue Breakdown (billion, %) by Region 2025 & 2033
- Figure 2: Global Vegan Protein Supplements Volume Breakdown (K, %) by Region 2025 & 2033
- Figure 3: North America Vegan Protein Supplements Revenue (billion), by Application 2025 & 2033
- Figure 4: North America Vegan Protein Supplements Volume (K), by Application 2025 & 2033
- Figure 5: North America Vegan Protein Supplements Revenue Share (%), by Application 2025 & 2033
- Figure 6: North America Vegan Protein Supplements Volume Share (%), by Application 2025 & 2033
- Figure 7: North America Vegan Protein Supplements Revenue (billion), by Types 2025 & 2033
- Figure 8: North America Vegan Protein Supplements Volume (K), by Types 2025 & 2033
- Figure 9: North America Vegan Protein Supplements Revenue Share (%), by Types 2025 & 2033
- Figure 10: North America Vegan Protein Supplements Volume Share (%), by Types 2025 & 2033
- Figure 11: North America Vegan Protein Supplements Revenue (billion), by Country 2025 & 2033
- Figure 12: North America Vegan Protein Supplements Volume (K), by Country 2025 & 2033
- Figure 13: North America Vegan Protein Supplements Revenue Share (%), by Country 2025 & 2033
- Figure 14: North America Vegan Protein Supplements Volume Share (%), by Country 2025 & 2033
- Figure 15: South America Vegan Protein Supplements Revenue (billion), by Application 2025 & 2033
- Figure 16: South America Vegan Protein Supplements Volume (K), by Application 2025 & 2033
- Figure 17: South America Vegan Protein Supplements Revenue Share (%), by Application 2025 & 2033
- Figure 18: South America Vegan Protein Supplements Volume Share (%), by Application 2025 & 2033
- Figure 19: South America Vegan Protein Supplements Revenue (billion), by Types 2025 & 2033
- Figure 20: South America Vegan Protein Supplements Volume (K), by Types 2025 & 2033
- Figure 21: South America Vegan Protein Supplements Revenue Share (%), by Types 2025 & 2033
- Figure 22: South America Vegan Protein Supplements Volume Share (%), by Types 2025 & 2033
- Figure 23: South America Vegan Protein Supplements Revenue (billion), by Country 2025 & 2033
- Figure 24: South America Vegan Protein Supplements Volume (K), by Country 2025 & 2033
- Figure 25: South America Vegan Protein Supplements Revenue Share (%), by Country 2025 & 2033
- Figure 26: South America Vegan Protein Supplements Volume Share (%), by Country 2025 & 2033
- Figure 27: Europe Vegan Protein Supplements Revenue (billion), by Application 2025 & 2033
- Figure 28: Europe Vegan Protein Supplements Volume (K), by Application 2025 & 2033
- Figure 29: Europe Vegan Protein Supplements Revenue Share (%), by Application 2025 & 2033
- Figure 30: Europe Vegan Protein Supplements Volume Share (%), by Application 2025 & 2033
- Figure 31: Europe Vegan Protein Supplements Revenue (billion), by Types 2025 & 2033
- Figure 32: Europe Vegan Protein Supplements Volume (K), by Types 2025 & 2033
- Figure 33: Europe Vegan Protein Supplements Revenue Share (%), by Types 2025 & 2033
- Figure 34: Europe Vegan Protein Supplements Volume Share (%), by Types 2025 & 2033
- Figure 35: Europe Vegan Protein Supplements Revenue (billion), by Country 2025 & 2033
- Figure 36: Europe Vegan Protein Supplements Volume (K), by Country 2025 & 2033
- Figure 37: Europe Vegan Protein Supplements Revenue Share (%), by Country 2025 & 2033
- Figure 38: Europe Vegan Protein Supplements Volume Share (%), by Country 2025 & 2033
- Figure 39: Middle East & Africa Vegan Protein Supplements Revenue (billion), by Application 2025 & 2033
- Figure 40: Middle East & Africa Vegan Protein Supplements Volume (K), by Application 2025 & 2033
- Figure 41: Middle East & Africa Vegan Protein Supplements Revenue Share (%), by Application 2025 & 2033
- Figure 42: Middle East & Africa Vegan Protein Supplements Volume Share (%), by Application 2025 & 2033
- Figure 43: Middle East & Africa Vegan Protein Supplements Revenue (billion), by Types 2025 & 2033
- Figure 44: Middle East & Africa Vegan Protein Supplements Volume (K), by Types 2025 & 2033
- Figure 45: Middle East & Africa Vegan Protein Supplements Revenue Share (%), by Types 2025 & 2033
- Figure 46: Middle East & Africa Vegan Protein Supplements Volume Share (%), by Types 2025 & 2033
- Figure 47: Middle East & Africa Vegan Protein Supplements Revenue (billion), by Country 2025 & 2033
- Figure 48: Middle East & Africa Vegan Protein Supplements Volume (K), by Country 2025 & 2033
- Figure 49: Middle East & Africa Vegan Protein Supplements Revenue Share (%), by Country 2025 & 2033
- Figure 50: Middle East & Africa Vegan Protein Supplements Volume Share (%), by Country 2025 & 2033
- Figure 51: Asia Pacific Vegan Protein Supplements Revenue (billion), by Application 2025 & 2033
- Figure 52: Asia Pacific Vegan Protein Supplements Volume (K), by Application 2025 & 2033
- Figure 53: Asia Pacific Vegan Protein Supplements Revenue Share (%), by Application 2025 & 2033
- Figure 54: Asia Pacific Vegan Protein Supplements Volume Share (%), by Application 2025 & 2033
- Figure 55: Asia Pacific Vegan Protein Supplements Revenue (billion), by Types 2025 & 2033
- Figure 56: Asia Pacific Vegan Protein Supplements Volume (K), by Types 2025 & 2033
- Figure 57: Asia Pacific Vegan Protein Supplements Revenue Share (%), by Types 2025 & 2033
- Figure 58: Asia Pacific Vegan Protein Supplements Volume Share (%), by Types 2025 & 2033
- Figure 59: Asia Pacific Vegan Protein Supplements Revenue (billion), by Country 2025 & 2033
- Figure 60: Asia Pacific Vegan Protein Supplements Volume (K), by Country 2025 & 2033
- Figure 61: Asia Pacific Vegan Protein Supplements Revenue Share (%), by Country 2025 & 2033
- Figure 62: Asia Pacific Vegan Protein Supplements Volume Share (%), by Country 2025 & 2033
List of Tables
- Table 1: Global Vegan Protein Supplements Revenue billion Forecast, by Application 2020 & 2033
- Table 2: Global Vegan Protein Supplements Volume K Forecast, by Application 2020 & 2033
- Table 3: Global Vegan Protein Supplements Revenue billion Forecast, by Types 2020 & 2033
- Table 4: Global Vegan Protein Supplements Volume K Forecast, by Types 2020 & 2033
- Table 5: Global Vegan Protein Supplements Revenue billion Forecast, by Region 2020 & 2033
- Table 6: Global Vegan Protein Supplements Volume K Forecast, by Region 2020 & 2033
- Table 7: Global Vegan Protein Supplements Revenue billion Forecast, by Application 2020 & 2033
- Table 8: Global Vegan Protein Supplements Volume K Forecast, by Application 2020 & 2033
- Table 9: Global Vegan Protein Supplements Revenue billion Forecast, by Types 2020 & 2033
- Table 10: Global Vegan Protein Supplements Volume K Forecast, by Types 2020 & 2033
- Table 11: Global Vegan Protein Supplements Revenue billion Forecast, by Country 2020 & 2033
- Table 12: Global Vegan Protein Supplements Volume K Forecast, by Country 2020 & 2033
- Table 13: United States Vegan Protein Supplements Revenue (billion) Forecast, by Application 2020 & 2033
- Table 14: United States Vegan Protein Supplements Volume (K) Forecast, by Application 2020 & 2033
- Table 15: Canada Vegan Protein Supplements Revenue (billion) Forecast, by Application 2020 & 2033
- Table 16: Canada Vegan Protein Supplements Volume (K) Forecast, by Application 2020 & 2033
- Table 17: Mexico Vegan Protein Supplements Revenue (billion) Forecast, by Application 2020 & 2033
- Table 18: Mexico Vegan Protein Supplements Volume (K) Forecast, by Application 2020 & 2033
- Table 19: Global Vegan Protein Supplements Revenue billion Forecast, by Application 2020 & 2033
- Table 20: Global Vegan Protein Supplements Volume K Forecast, by Application 2020 & 2033
- Table 21: Global Vegan Protein Supplements Revenue billion Forecast, by Types 2020 & 2033
- Table 22: Global Vegan Protein Supplements Volume K Forecast, by Types 2020 & 2033
- Table 23: Global Vegan Protein Supplements Revenue billion Forecast, by Country 2020 & 2033
- Table 24: Global Vegan Protein Supplements Volume K Forecast, by Country 2020 & 2033
- Table 25: Brazil Vegan Protein Supplements Revenue (billion) Forecast, by Application 2020 & 2033
- Table 26: Brazil Vegan Protein Supplements Volume (K) Forecast, by Application 2020 & 2033
- Table 27: Argentina Vegan Protein Supplements Revenue (billion) Forecast, by Application 2020 & 2033
- Table 28: Argentina Vegan Protein Supplements Volume (K) Forecast, by Application 2020 & 2033
- Table 29: Rest of South America Vegan Protein Supplements Revenue (billion) Forecast, by Application 2020 & 2033
- Table 30: Rest of South America Vegan Protein Supplements Volume (K) Forecast, by Application 2020 & 2033
- Table 31: Global Vegan Protein Supplements Revenue billion Forecast, by Application 2020 & 2033
- Table 32: Global Vegan Protein Supplements Volume K Forecast, by Application 2020 & 2033
- Table 33: Global Vegan Protein Supplements Revenue billion Forecast, by Types 2020 & 2033
- Table 34: Global Vegan Protein Supplements Volume K Forecast, by Types 2020 & 2033
- Table 35: Global Vegan Protein Supplements Revenue billion Forecast, by Country 2020 & 2033
- Table 36: Global Vegan Protein Supplements Volume K Forecast, by Country 2020 & 2033
- Table 37: United Kingdom Vegan Protein Supplements Revenue (billion) Forecast, by Application 2020 & 2033
- Table 38: United Kingdom Vegan Protein Supplements Volume (K) Forecast, by Application 2020 & 2033
- Table 39: Germany Vegan Protein Supplements Revenue (billion) Forecast, by Application 2020 & 2033
- Table 40: Germany Vegan Protein Supplements Volume (K) Forecast, by Application 2020 & 2033
- Table 41: France Vegan Protein Supplements Revenue (billion) Forecast, by Application 2020 & 2033
- Table 42: France Vegan Protein Supplements Volume (K) Forecast, by Application 2020 & 2033
- Table 43: Italy Vegan Protein Supplements Revenue (billion) Forecast, by Application 2020 & 2033
- Table 44: Italy Vegan Protein Supplements Volume (K) Forecast, by Application 2020 & 2033
- Table 45: Spain Vegan Protein Supplements Revenue (billion) Forecast, by Application 2020 & 2033
- Table 46: Spain Vegan Protein Supplements Volume (K) Forecast, by Application 2020 & 2033
- Table 47: Russia Vegan Protein Supplements Revenue (billion) Forecast, by Application 2020 & 2033
- Table 48: Russia Vegan Protein Supplements Volume (K) Forecast, by Application 2020 & 2033
- Table 49: Benelux Vegan Protein Supplements Revenue (billion) Forecast, by Application 2020 & 2033
- Table 50: Benelux Vegan Protein Supplements Volume (K) Forecast, by Application 2020 & 2033
- Table 51: Nordics Vegan Protein Supplements Revenue (billion) Forecast, by Application 2020 & 2033
- Table 52: Nordics Vegan Protein Supplements Volume (K) Forecast, by Application 2020 & 2033
- Table 53: Rest of Europe Vegan Protein Supplements Revenue (billion) Forecast, by Application 2020 & 2033
- Table 54: Rest of Europe Vegan Protein Supplements Volume (K) Forecast, by Application 2020 & 2033
- Table 55: Global Vegan Protein Supplements Revenue billion Forecast, by Application 2020 & 2033
- Table 56: Global Vegan Protein Supplements Volume K Forecast, by Application 2020 & 2033
- Table 57: Global Vegan Protein Supplements Revenue billion Forecast, by Types 2020 & 2033
- Table 58: Global Vegan Protein Supplements Volume K Forecast, by Types 2020 & 2033
- Table 59: Global Vegan Protein Supplements Revenue billion Forecast, by Country 2020 & 2033
- Table 60: Global Vegan Protein Supplements Volume K Forecast, by Country 2020 & 2033
- Table 61: Turkey Vegan Protein Supplements Revenue (billion) Forecast, by Application 2020 & 2033
- Table 62: Turkey Vegan Protein Supplements Volume (K) Forecast, by Application 2020 & 2033
- Table 63: Israel Vegan Protein Supplements Revenue (billion) Forecast, by Application 2020 & 2033
- Table 64: Israel Vegan Protein Supplements Volume (K) Forecast, by Application 2020 & 2033
- Table 65: GCC Vegan Protein Supplements Revenue (billion) Forecast, by Application 2020 & 2033
- Table 66: GCC Vegan Protein Supplements Volume (K) Forecast, by Application 2020 & 2033
- Table 67: North Africa Vegan Protein Supplements Revenue (billion) Forecast, by Application 2020 & 2033
- Table 68: North Africa Vegan Protein Supplements Volume (K) Forecast, by Application 2020 & 2033
- Table 69: South Africa Vegan Protein Supplements Revenue (billion) Forecast, by Application 2020 & 2033
- Table 70: South Africa Vegan Protein Supplements Volume (K) Forecast, by Application 2020 & 2033
- Table 71: Rest of Middle East & Africa Vegan Protein Supplements Revenue (billion) Forecast, by Application 2020 & 2033
- Table 72: Rest of Middle East & Africa Vegan Protein Supplements Volume (K) Forecast, by Application 2020 & 2033
- Table 73: Global Vegan Protein Supplements Revenue billion Forecast, by Application 2020 & 2033
- Table 74: Global Vegan Protein Supplements Volume K Forecast, by Application 2020 & 2033
- Table 75: Global Vegan Protein Supplements Revenue billion Forecast, by Types 2020 & 2033
- Table 76: Global Vegan Protein Supplements Volume K Forecast, by Types 2020 & 2033
- Table 77: Global Vegan Protein Supplements Revenue billion Forecast, by Country 2020 & 2033
- Table 78: Global Vegan Protein Supplements Volume K Forecast, by Country 2020 & 2033
- Table 79: China Vegan Protein Supplements Revenue (billion) Forecast, by Application 2020 & 2033
- Table 80: China Vegan Protein Supplements Volume (K) Forecast, by Application 2020 & 2033
- Table 81: India Vegan Protein Supplements Revenue (billion) Forecast, by Application 2020 & 2033
- Table 82: India Vegan Protein Supplements Volume (K) Forecast, by Application 2020 & 2033
- Table 83: Japan Vegan Protein Supplements Revenue (billion) Forecast, by Application 2020 & 2033
- Table 84: Japan Vegan Protein Supplements Volume (K) Forecast, by Application 2020 & 2033
- Table 85: South Korea Vegan Protein Supplements Revenue (billion) Forecast, by Application 2020 & 2033
- Table 86: South Korea Vegan Protein Supplements Volume (K) Forecast, by Application 2020 & 2033
- Table 87: ASEAN Vegan Protein Supplements Revenue (billion) Forecast, by Application 2020 & 2033
- Table 88: ASEAN Vegan Protein Supplements Volume (K) Forecast, by Application 2020 & 2033
- Table 89: Oceania Vegan Protein Supplements Revenue (billion) Forecast, by Application 2020 & 2033
- Table 90: Oceania Vegan Protein Supplements Volume (K) Forecast, by Application 2020 & 2033
- Table 91: Rest of Asia Pacific Vegan Protein Supplements Revenue (billion) Forecast, by Application 2020 & 2033
- Table 92: Rest of Asia Pacific Vegan Protein Supplements Volume (K) Forecast, by Application 2020 & 2033
Frequently Asked Questions
1. What is the projected Compound Annual Growth Rate (CAGR) of the Vegan Protein Supplements?
The projected CAGR is approximately 6.37%.
2. Which companies are prominent players in the Vegan Protein Supplements?
Key companies in the market include Glanbia, NOW Foods, MusclePharm Corp, CytoSport, Inc. (PepsiCo), Simply Good Foods, NBTY (The Bountiful Company), AMCO Proteins, Iovate Health Sciences International, Nutrabolt, Dymatize Enterprises, Jym Supplement Science, RSP Nutrition, BPI Sports LLC, International Dehydrated Foods, BRF, Rousselot, Gelita, Hoogwegt.
3. What are the main segments of the Vegan Protein Supplements?
The market segments include Application, Types.
4. Can you provide details about the market size?
The market size is estimated to be USD 6.6 billion as of 2022.
5. What are some drivers contributing to market growth?
N/A
6. What are the notable trends driving market growth?
N/A
7. Are there any restraints impacting market growth?
N/A
8. Can you provide examples of recent developments in the market?
N/A
9. What pricing options are available for accessing the report?
Pricing options include single-user, multi-user, and enterprise licenses priced at USD 3350.00, USD 5025.00, and USD 6700.00 respectively.
10. Is the market size provided in terms of value or volume?
The market size is provided in terms of value, measured in billion and volume, measured in K.
11. Are there any specific market keywords associated with the report?
Yes, the market keyword associated with the report is "Vegan Protein Supplements," which aids in identifying and referencing the specific market segment covered.
12. How do I determine which pricing option suits my needs best?
The pricing options vary based on user requirements and access needs. Individual users may opt for single-user licenses, while businesses requiring broader access may choose multi-user or enterprise licenses for cost-effective access to the report.
13. Are there any additional resources or data provided in the Vegan Protein Supplements report?
While the report offers comprehensive insights, it's advisable to review the specific contents or supplementary materials provided to ascertain if additional resources or data are available.
14. How can I stay updated on further developments or reports in the Vegan Protein Supplements?
To stay informed about further developments, trends, and reports in the Vegan Protein Supplements, consider subscribing to industry newsletters, following relevant companies and organizations, or regularly checking reputable industry news sources and publications.
Methodology
Step 1 - Identification of Relevant Samples Size from Population Database


Step 2 - Approaches for Defining Global Market Size (Value, Volume* & Price*)

Note*: In applicable scenarios
Step 3 - Data Sources
Primary Research
- Web Analytics
- Survey Reports
- Research Institute
- Latest Research Reports
- Opinion Leaders
Secondary Research
- Annual Reports
- White Paper
- Latest Press Release
- Industry Association
- Paid Database
- Investor Presentations

Step 4 - Data Triangulation
Involves using different sources of information in order to increase the validity of a study
These sources are likely to be stakeholders in a program - participants, other researchers, program staff, other community members, and so on.
Then we put all data in single framework & apply various statistical tools to find out the dynamic on the market.
During the analysis stage, feedback from the stakeholder groups would be compared to determine areas of agreement as well as areas of divergence