
Key Insights
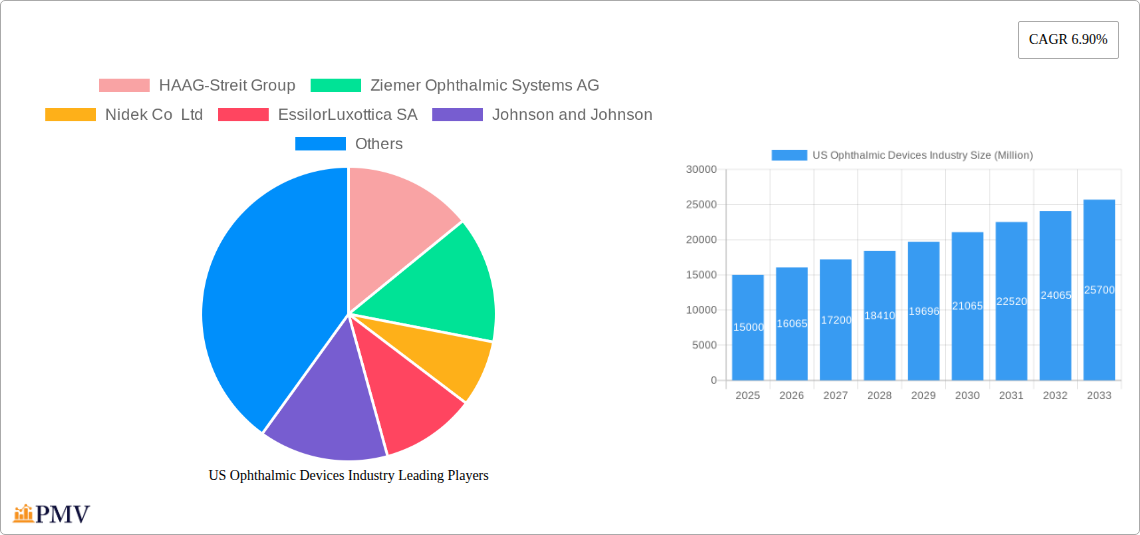
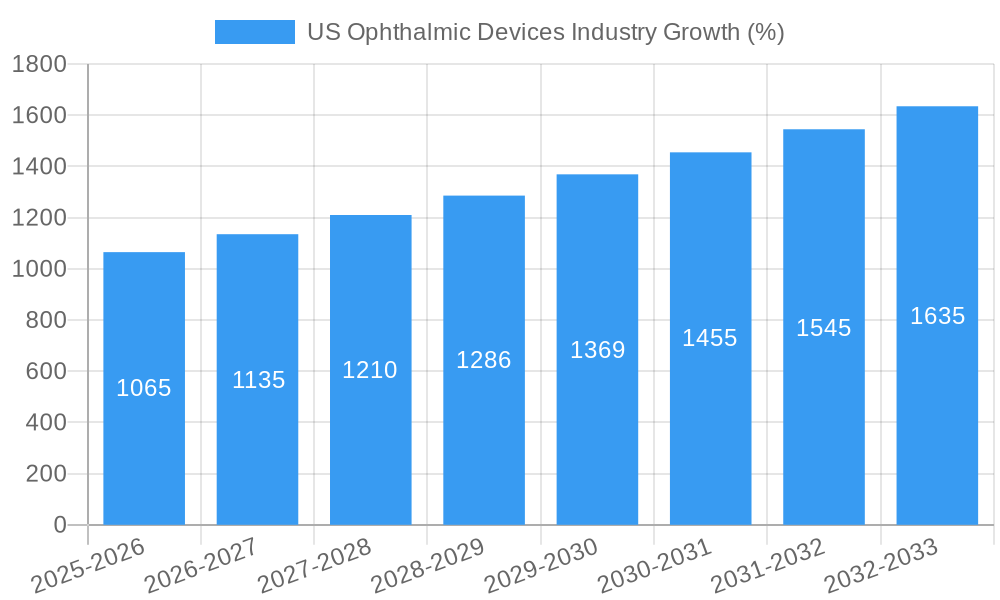
The US ophthalmic devices market, valued at approximately $15 billion in 2025, is projected to experience robust growth, driven by several key factors. An aging population with increasing prevalence of age-related eye diseases like cataracts, glaucoma, and macular degeneration fuels significant demand for diagnostic and treatment devices. Technological advancements, such as minimally invasive surgical techniques, sophisticated imaging systems, and innovative intraocular lenses, are enhancing treatment efficacy and patient outcomes, further stimulating market expansion. The rising adoption of refractive surgery procedures like LASIK and PRK, alongside the growing awareness of vision correction options, contributes to the market's growth trajectory. However, high costs associated with advanced ophthalmic devices and procedures, coupled with stringent regulatory approvals, pose challenges to market penetration. Furthermore, reimbursement policies and insurance coverage variations can influence market accessibility. Despite these restraints, the market is expected to maintain a steady CAGR of 6.90% throughout the forecast period (2025-2033), with significant opportunities for market players focusing on innovation, technological advancements, and strategic partnerships.
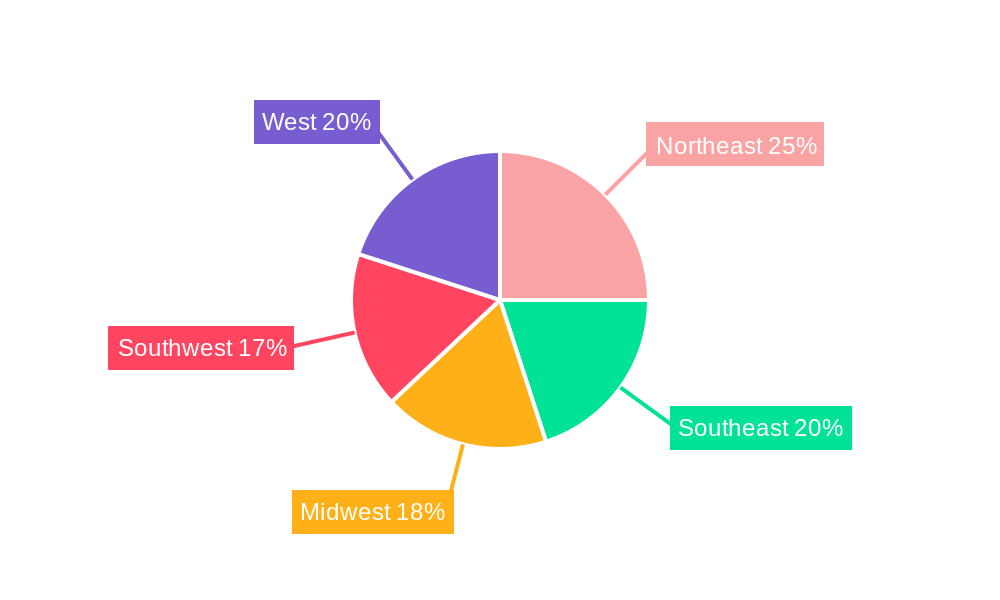
The market segmentation reveals a dynamic landscape. Surgical devices, encompassing a wide range of tools and implants for cataract surgery, glaucoma management, and retinal procedures, constitute a substantial portion of the market. Diagnostic and monitoring devices, including advanced imaging systems and diagnostic tools, play a crucial role in early disease detection and accurate diagnosis. Vision correction devices, comprising intraocular lenses and refractive surgery equipment, represent another significant segment. Competition within the market is fierce, with major players like Johnson & Johnson, Alcon, Zeiss, and EssilorLuxottica actively engaged in research and development, mergers and acquisitions, and strategic alliances to expand their market presence and product portfolios. Regional analysis indicates a strong concentration of market activity in the US, particularly across various regions like the Northeast, Southeast, Midwest, Southwest, and West, reflecting the high prevalence of age-related eye diseases and access to advanced healthcare facilities.
This comprehensive report provides a detailed analysis of the US ophthalmic devices industry, covering market structure, competitive dynamics, key trends, and future growth prospects from 2019 to 2033. The study period spans 2019-2024 (Historical Period), with 2025 as the Base Year and Estimated Year, and a forecast period of 2025-2033. The report offers actionable insights for industry stakeholders, including manufacturers, investors, and regulatory bodies. The market is segmented by device type, including Surgical Devices, Diagnostic and Monitoring Devices (including Other Surgical Devices and Other Diagnostic and Monitoring Devices), and Vision Correction Devices. Leading companies such as Alcon Inc, Bausch Health Companies Inc, Carl Zeiss AG, EssilorLuxottica SA, HAAG-Streit Group, Hoya Corporation, Johnson & Johnson, Nidek Co Ltd, Topcon Corporation, and Ziemer Ophthalmic Systems AG are analyzed in detail. The report's value is xx Million.
US Ophthalmic Devices Industry Market Structure & Competitive Dynamics
The US ophthalmic devices market exhibits a moderately concentrated structure, with a handful of multinational corporations holding significant market share. Market concentration is driven by economies of scale in R&D, manufacturing, and global distribution networks. The industry is characterized by a dynamic innovation ecosystem, encompassing both established players and emerging startups focused on novel technologies like AI-powered diagnostics and minimally invasive surgical techniques. The regulatory landscape, primarily governed by the FDA, significantly impacts market entry and product approval timelines. Stringent regulatory requirements necessitate substantial investments in clinical trials and compliance, creating barriers for smaller companies. Product substitutes, such as laser vision correction procedures, also influence market dynamics. End-user trends, such as an aging population and rising prevalence of eye diseases, are driving market growth. Significant M&A activity has shaped the market landscape, with deal values exceeding xx Million in recent years.
- Market Share: Alcon Inc and Johnson & Johnson hold the largest market shares, estimated at approximately xx% and xx%, respectively, in 2025.
- M&A Activity: Recent mergers and acquisitions have focused on expanding product portfolios and gaining access to new technologies. The total value of M&A deals in the period 2019-2024 was estimated at xx Million.
US Ophthalmic Devices Industry Industry Trends & Insights
The US ophthalmic devices market is experiencing robust growth, driven by a confluence of factors. The aging population is a significant contributor, leading to an increased prevalence of age-related eye diseases like cataracts, glaucoma, and macular degeneration. Technological advancements, such as the development of minimally invasive surgical techniques and AI-powered diagnostic tools, are enhancing treatment outcomes and increasing market demand. Consumer preferences are shifting towards personalized medicine and less-invasive procedures. Furthermore, rising healthcare expenditure and improved insurance coverage are contributing to market expansion. The market is expected to witness a Compound Annual Growth Rate (CAGR) of xx% during the forecast period (2025-2033). Market penetration of technologically advanced devices is steadily increasing, with xx% of surgeries now employing minimally invasive techniques. Competitive dynamics remain intense, with companies focusing on innovation, product differentiation, and strategic partnerships to gain market share.
Dominant Markets & Segments in US Ophthalmic Devices Industry
The largest segment within the US ophthalmic devices market is Surgical Devices, driven by the increasing prevalence of conditions requiring surgical intervention, such as cataracts and glaucoma. The Diagnostic and Monitoring Devices segment is also experiencing significant growth, fueled by the rising demand for early detection and monitoring of eye diseases. Within these segments, the geographically dominant market is the Northeast region of the US, attributed to higher healthcare expenditure, a concentrated population density, and a large number of specialized ophthalmology centers.
- Key Drivers for Surgical Devices:
- High prevalence of age-related eye diseases.
- Technological advancements in minimally invasive surgical techniques.
- Increased adoption of premium intraocular lenses (IOLs).
- Key Drivers for Diagnostic and Monitoring Devices:
- Rising demand for early disease detection and personalized treatment.
- Advances in imaging technologies and AI-driven diagnostic tools.
- Growing awareness among patients regarding the importance of regular eye exams.
US Ophthalmic Devices Industry Product Innovations
Recent innovations in the ophthalmic devices sector include the development of smart contact lenses for continuous glucose monitoring and the integration of AI into diagnostic imaging systems for improved accuracy and speed. These advancements are enhancing the precision and effectiveness of ophthalmic procedures, leading to improved patient outcomes and driving market expansion. Furthermore, the development of minimally invasive surgical tools is gaining traction, reducing recovery times and improving patient experience. The market is also witnessing the adoption of personalized medicine approaches, tailoring treatment plans based on individual patient needs and genetic profiles.
Report Segmentation & Scope
This report segments the US ophthalmic devices market into three primary categories: Surgical Devices, Diagnostic and Monitoring Devices (further subdivided into Other Surgical Devices and Other Diagnostic and Monitoring Devices), and Vision Correction Devices. Each segment is analyzed in terms of market size, growth projections, and competitive dynamics. Surgical devices are projected to maintain the largest market share throughout the forecast period, driven by the high incidence of age-related eye diseases. The Diagnostic and Monitoring Devices segment is expected to exhibit significant growth due to the rising demand for early detection and personalized treatment. The Vision Correction Devices segment is anticipated to grow at a moderate rate.
Key Drivers of US Ophthalmic Devices Industry Growth
The growth of the US ophthalmic devices market is fueled by several key factors. The aging population, leading to increased prevalence of age-related eye diseases, is a primary driver. Technological advancements, including minimally invasive surgical techniques and AI-powered diagnostics, are significantly improving treatment effectiveness and efficiency. Furthermore, rising healthcare expenditure and increased insurance coverage are bolstering market expansion. Stringent regulatory frameworks are driving innovation and ensuring product safety and efficacy.
Challenges in the US Ophthalmic Devices Industry Sector
The US ophthalmic devices industry faces several challenges, including stringent regulatory hurdles that increase the cost and time to market for new products. Supply chain disruptions can impact the availability and cost of raw materials and components. Furthermore, intense competition among established players and the emergence of new entrants create pressure on pricing and margins. The average cost for regulatory approval processes and clinical trials can exceed xx Million per product.
Leading Players in the US Ophthalmic Devices Industry Market
- HAAG-Streit Group
- Ziemer Ophthalmic Systems AG
- Nidek Co Ltd
- EssilorLuxottica SA
- Johnson and Johnson
- Carl Zeiss AG
- Topcon Corporation
- Alcon Inc
- Bausch Health Companies Inc
- Hoya Corporation
Key Developments in US Ophthalmic Devices Industry Sector
- August 2022: Glaukos Corporation received 510(k) clearance from the FDA for the iStent infinite Trabecular Micro-Bypass System, expanding treatment options for glaucoma. This significantly impacts market dynamics by introducing a new, less-invasive treatment.
- November 2022: Sight Sciences reported positive clinical data for the OMNI Surgical System in pseudophakic glaucoma patients, highlighting its effectiveness and potential market share gains. This development showcases progress in surgical solutions for complex glaucoma cases.
Strategic US Ophthalmic Devices Industry Market Outlook
The US ophthalmic devices market presents significant growth opportunities in the coming years. The continued aging of the population, coupled with technological advancements in minimally invasive procedures and AI-driven diagnostics, will fuel market expansion. Companies focusing on innovation, product differentiation, and strategic partnerships will be well-positioned to capitalize on these opportunities. The increasing emphasis on personalized medicine and remote patient monitoring will also drive further growth and market diversification.
US Ophthalmic Devices Industry Segmentation
-
1. Devices
-
1.1. Surgical Devices
- 1.1.1. Glaucoma Drainage Devices
- 1.1.2. Glaucoma Stents and Implants
- 1.1.3. Intraocular Lenses
- 1.1.4. Lasers
- 1.1.5. Other Surgical Devices
-
1.2. Diagnostic and Monitoring Devices
- 1.2.1. Autorefractors and Keratometers
- 1.2.2. Corneal Topography Systems
- 1.2.3. Ophthalmic Ultrasound Imaging Systems
- 1.2.4. Ophthalmoscopes
- 1.2.5. Optical Coherence Tomography Scanners
- 1.2.6. Other Diagnostic and Monitoring Devices
-
1.3. Vision Correction Devices
- 1.3.1. Spectacles
- 1.3.2. Contact Lenses
-
1.1. Surgical Devices
US Ophthalmic Devices Industry Segmentation By Geography
-
1. North America
- 1.1. United States
- 1.2. Canada
- 1.3. Mexico
-
2. South America
- 2.1. Brazil
- 2.2. Argentina
- 2.3. Rest of South America
-
3. Europe
- 3.1. United Kingdom
- 3.2. Germany
- 3.3. France
- 3.4. Italy
- 3.5. Spain
- 3.6. Russia
- 3.7. Benelux
- 3.8. Nordics
- 3.9. Rest of Europe
-
4. Middle East & Africa
- 4.1. Turkey
- 4.2. Israel
- 4.3. GCC
- 4.4. North Africa
- 4.5. South Africa
- 4.6. Rest of Middle East & Africa
-
5. Asia Pacific
- 5.1. China
- 5.2. India
- 5.3. Japan
- 5.4. South Korea
- 5.5. ASEAN
- 5.6. Oceania
- 5.7. Rest of Asia Pacific
US Ophthalmic Devices Industry REPORT HIGHLIGHTS
| Aspects | Details |
|---|---|
| Study Period | 2019-2033 |
| Base Year | 2024 |
| Estimated Year | 2025 |
| Forecast Period | 2025-2033 |
| Historical Period | 2019-2024 |
| Growth Rate | CAGR of 6.90% from 2019-2033 |
| Segmentation |
|
Table of Contents
- 1. Introduction
- 1.1. Research Scope
- 1.2. Market Segmentation
- 1.3. Research Methodology
- 1.4. Definitions and Assumptions
- 2. Executive Summary
- 2.1. Introduction
- 3. Market Dynamics
- 3.1. Introduction
- 3.2. Market Drivers
- 3.2.1. Demographic Shift and Increasing Prevalence of Eye Diseases; Rising Geriatric Population; Technological Advancements in Ophthalmic Devices
- 3.3. Market Restrains
- 3.3.1. Risk Associated with Ophthalmic Procedures
- 3.4. Market Trends
- 3.4.1. Contact Lens are Expected to Register a Significant Growth in the United States Ophthalmic Devices Market Over the Forecast Period
- 4. Market Factor Analysis
- 4.1. Porters Five Forces
- 4.2. Supply/Value Chain
- 4.3. PESTEL analysis
- 4.4. Market Entropy
- 4.5. Patent/Trademark Analysis
- 5. Global US Ophthalmic Devices Industry Analysis, Insights and Forecast, 2019-2031
- 5.1. Market Analysis, Insights and Forecast - by Devices
- 5.1.1. Surgical Devices
- 5.1.1.1. Glaucoma Drainage Devices
- 5.1.1.2. Glaucoma Stents and Implants
- 5.1.1.3. Intraocular Lenses
- 5.1.1.4. Lasers
- 5.1.1.5. Other Surgical Devices
- 5.1.2. Diagnostic and Monitoring Devices
- 5.1.2.1. Autorefractors and Keratometers
- 5.1.2.2. Corneal Topography Systems
- 5.1.2.3. Ophthalmic Ultrasound Imaging Systems
- 5.1.2.4. Ophthalmoscopes
- 5.1.2.5. Optical Coherence Tomography Scanners
- 5.1.2.6. Other Diagnostic and Monitoring Devices
- 5.1.3. Vision Correction Devices
- 5.1.3.1. Spectacles
- 5.1.3.2. Contact Lenses
- 5.1.1. Surgical Devices
- 5.2. Market Analysis, Insights and Forecast - by Region
- 5.2.1. North America
- 5.2.2. South America
- 5.2.3. Europe
- 5.2.4. Middle East & Africa
- 5.2.5. Asia Pacific
- 5.1. Market Analysis, Insights and Forecast - by Devices
- 6. North America US Ophthalmic Devices Industry Analysis, Insights and Forecast, 2019-2031
- 6.1. Market Analysis, Insights and Forecast - by Devices
- 6.1.1. Surgical Devices
- 6.1.1.1. Glaucoma Drainage Devices
- 6.1.1.2. Glaucoma Stents and Implants
- 6.1.1.3. Intraocular Lenses
- 6.1.1.4. Lasers
- 6.1.1.5. Other Surgical Devices
- 6.1.2. Diagnostic and Monitoring Devices
- 6.1.2.1. Autorefractors and Keratometers
- 6.1.2.2. Corneal Topography Systems
- 6.1.2.3. Ophthalmic Ultrasound Imaging Systems
- 6.1.2.4. Ophthalmoscopes
- 6.1.2.5. Optical Coherence Tomography Scanners
- 6.1.2.6. Other Diagnostic and Monitoring Devices
- 6.1.3. Vision Correction Devices
- 6.1.3.1. Spectacles
- 6.1.3.2. Contact Lenses
- 6.1.1. Surgical Devices
- 6.1. Market Analysis, Insights and Forecast - by Devices
- 7. South America US Ophthalmic Devices Industry Analysis, Insights and Forecast, 2019-2031
- 7.1. Market Analysis, Insights and Forecast - by Devices
- 7.1.1. Surgical Devices
- 7.1.1.1. Glaucoma Drainage Devices
- 7.1.1.2. Glaucoma Stents and Implants
- 7.1.1.3. Intraocular Lenses
- 7.1.1.4. Lasers
- 7.1.1.5. Other Surgical Devices
- 7.1.2. Diagnostic and Monitoring Devices
- 7.1.2.1. Autorefractors and Keratometers
- 7.1.2.2. Corneal Topography Systems
- 7.1.2.3. Ophthalmic Ultrasound Imaging Systems
- 7.1.2.4. Ophthalmoscopes
- 7.1.2.5. Optical Coherence Tomography Scanners
- 7.1.2.6. Other Diagnostic and Monitoring Devices
- 7.1.3. Vision Correction Devices
- 7.1.3.1. Spectacles
- 7.1.3.2. Contact Lenses
- 7.1.1. Surgical Devices
- 7.1. Market Analysis, Insights and Forecast - by Devices
- 8. Europe US Ophthalmic Devices Industry Analysis, Insights and Forecast, 2019-2031
- 8.1. Market Analysis, Insights and Forecast - by Devices
- 8.1.1. Surgical Devices
- 8.1.1.1. Glaucoma Drainage Devices
- 8.1.1.2. Glaucoma Stents and Implants
- 8.1.1.3. Intraocular Lenses
- 8.1.1.4. Lasers
- 8.1.1.5. Other Surgical Devices
- 8.1.2. Diagnostic and Monitoring Devices
- 8.1.2.1. Autorefractors and Keratometers
- 8.1.2.2. Corneal Topography Systems
- 8.1.2.3. Ophthalmic Ultrasound Imaging Systems
- 8.1.2.4. Ophthalmoscopes
- 8.1.2.5. Optical Coherence Tomography Scanners
- 8.1.2.6. Other Diagnostic and Monitoring Devices
- 8.1.3. Vision Correction Devices
- 8.1.3.1. Spectacles
- 8.1.3.2. Contact Lenses
- 8.1.1. Surgical Devices
- 8.1. Market Analysis, Insights and Forecast - by Devices
- 9. Middle East & Africa US Ophthalmic Devices Industry Analysis, Insights and Forecast, 2019-2031
- 9.1. Market Analysis, Insights and Forecast - by Devices
- 9.1.1. Surgical Devices
- 9.1.1.1. Glaucoma Drainage Devices
- 9.1.1.2. Glaucoma Stents and Implants
- 9.1.1.3. Intraocular Lenses
- 9.1.1.4. Lasers
- 9.1.1.5. Other Surgical Devices
- 9.1.2. Diagnostic and Monitoring Devices
- 9.1.2.1. Autorefractors and Keratometers
- 9.1.2.2. Corneal Topography Systems
- 9.1.2.3. Ophthalmic Ultrasound Imaging Systems
- 9.1.2.4. Ophthalmoscopes
- 9.1.2.5. Optical Coherence Tomography Scanners
- 9.1.2.6. Other Diagnostic and Monitoring Devices
- 9.1.3. Vision Correction Devices
- 9.1.3.1. Spectacles
- 9.1.3.2. Contact Lenses
- 9.1.1. Surgical Devices
- 9.1. Market Analysis, Insights and Forecast - by Devices
- 10. Asia Pacific US Ophthalmic Devices Industry Analysis, Insights and Forecast, 2019-2031
- 10.1. Market Analysis, Insights and Forecast - by Devices
- 10.1.1. Surgical Devices
- 10.1.1.1. Glaucoma Drainage Devices
- 10.1.1.2. Glaucoma Stents and Implants
- 10.1.1.3. Intraocular Lenses
- 10.1.1.4. Lasers
- 10.1.1.5. Other Surgical Devices
- 10.1.2. Diagnostic and Monitoring Devices
- 10.1.2.1. Autorefractors and Keratometers
- 10.1.2.2. Corneal Topography Systems
- 10.1.2.3. Ophthalmic Ultrasound Imaging Systems
- 10.1.2.4. Ophthalmoscopes
- 10.1.2.5. Optical Coherence Tomography Scanners
- 10.1.2.6. Other Diagnostic and Monitoring Devices
- 10.1.3. Vision Correction Devices
- 10.1.3.1. Spectacles
- 10.1.3.2. Contact Lenses
- 10.1.1. Surgical Devices
- 10.1. Market Analysis, Insights and Forecast - by Devices
- 11. Northeast US Ophthalmic Devices Industry Analysis, Insights and Forecast, 2019-2031
- 12. Southeast US Ophthalmic Devices Industry Analysis, Insights and Forecast, 2019-2031
- 13. Midwest US Ophthalmic Devices Industry Analysis, Insights and Forecast, 2019-2031
- 14. Southwest US Ophthalmic Devices Industry Analysis, Insights and Forecast, 2019-2031
- 15. West US Ophthalmic Devices Industry Analysis, Insights and Forecast, 2019-2031
- 16. Competitive Analysis
- 16.1. Global Market Share Analysis 2024
- 16.2. Company Profiles
- 16.2.1 HAAG-Streit Group
- 16.2.1.1. Overview
- 16.2.1.2. Products
- 16.2.1.3. SWOT Analysis
- 16.2.1.4. Recent Developments
- 16.2.1.5. Financials (Based on Availability)
- 16.2.2 Ziemer Ophthalmic Systems AG
- 16.2.2.1. Overview
- 16.2.2.2. Products
- 16.2.2.3. SWOT Analysis
- 16.2.2.4. Recent Developments
- 16.2.2.5. Financials (Based on Availability)
- 16.2.3 Nidek Co Ltd
- 16.2.3.1. Overview
- 16.2.3.2. Products
- 16.2.3.3. SWOT Analysis
- 16.2.3.4. Recent Developments
- 16.2.3.5. Financials (Based on Availability)
- 16.2.4 EssilorLuxottica SA
- 16.2.4.1. Overview
- 16.2.4.2. Products
- 16.2.4.3. SWOT Analysis
- 16.2.4.4. Recent Developments
- 16.2.4.5. Financials (Based on Availability)
- 16.2.5 Johnson and Johnson
- 16.2.5.1. Overview
- 16.2.5.2. Products
- 16.2.5.3. SWOT Analysis
- 16.2.5.4. Recent Developments
- 16.2.5.5. Financials (Based on Availability)
- 16.2.6 Carl Zeiss AG
- 16.2.6.1. Overview
- 16.2.6.2. Products
- 16.2.6.3. SWOT Analysis
- 16.2.6.4. Recent Developments
- 16.2.6.5. Financials (Based on Availability)
- 16.2.7 Topcon Corporation
- 16.2.7.1. Overview
- 16.2.7.2. Products
- 16.2.7.3. SWOT Analysis
- 16.2.7.4. Recent Developments
- 16.2.7.5. Financials (Based on Availability)
- 16.2.8 Alcon Inc
- 16.2.8.1. Overview
- 16.2.8.2. Products
- 16.2.8.3. SWOT Analysis
- 16.2.8.4. Recent Developments
- 16.2.8.5. Financials (Based on Availability)
- 16.2.9 Bausch Health Companies Inc
- 16.2.9.1. Overview
- 16.2.9.2. Products
- 16.2.9.3. SWOT Analysis
- 16.2.9.4. Recent Developments
- 16.2.9.5. Financials (Based on Availability)
- 16.2.10 Hoya Corporation
- 16.2.10.1. Overview
- 16.2.10.2. Products
- 16.2.10.3. SWOT Analysis
- 16.2.10.4. Recent Developments
- 16.2.10.5. Financials (Based on Availability)
- 16.2.1 HAAG-Streit Group
List of Figures
- Figure 1: Global US Ophthalmic Devices Industry Revenue Breakdown (Million, %) by Region 2024 & 2032
- Figure 2: Global US Ophthalmic Devices Industry Volume Breakdown (K Unit, %) by Region 2024 & 2032
- Figure 3: United states US Ophthalmic Devices Industry Revenue (Million), by Country 2024 & 2032
- Figure 4: United states US Ophthalmic Devices Industry Volume (K Unit), by Country 2024 & 2032
- Figure 5: United states US Ophthalmic Devices Industry Revenue Share (%), by Country 2024 & 2032
- Figure 6: United states US Ophthalmic Devices Industry Volume Share (%), by Country 2024 & 2032
- Figure 7: North America US Ophthalmic Devices Industry Revenue (Million), by Devices 2024 & 2032
- Figure 8: North America US Ophthalmic Devices Industry Volume (K Unit), by Devices 2024 & 2032
- Figure 9: North America US Ophthalmic Devices Industry Revenue Share (%), by Devices 2024 & 2032
- Figure 10: North America US Ophthalmic Devices Industry Volume Share (%), by Devices 2024 & 2032
- Figure 11: North America US Ophthalmic Devices Industry Revenue (Million), by Country 2024 & 2032
- Figure 12: North America US Ophthalmic Devices Industry Volume (K Unit), by Country 2024 & 2032
- Figure 13: North America US Ophthalmic Devices Industry Revenue Share (%), by Country 2024 & 2032
- Figure 14: North America US Ophthalmic Devices Industry Volume Share (%), by Country 2024 & 2032
- Figure 15: South America US Ophthalmic Devices Industry Revenue (Million), by Devices 2024 & 2032
- Figure 16: South America US Ophthalmic Devices Industry Volume (K Unit), by Devices 2024 & 2032
- Figure 17: South America US Ophthalmic Devices Industry Revenue Share (%), by Devices 2024 & 2032
- Figure 18: South America US Ophthalmic Devices Industry Volume Share (%), by Devices 2024 & 2032
- Figure 19: South America US Ophthalmic Devices Industry Revenue (Million), by Country 2024 & 2032
- Figure 20: South America US Ophthalmic Devices Industry Volume (K Unit), by Country 2024 & 2032
- Figure 21: South America US Ophthalmic Devices Industry Revenue Share (%), by Country 2024 & 2032
- Figure 22: South America US Ophthalmic Devices Industry Volume Share (%), by Country 2024 & 2032
- Figure 23: Europe US Ophthalmic Devices Industry Revenue (Million), by Devices 2024 & 2032
- Figure 24: Europe US Ophthalmic Devices Industry Volume (K Unit), by Devices 2024 & 2032
- Figure 25: Europe US Ophthalmic Devices Industry Revenue Share (%), by Devices 2024 & 2032
- Figure 26: Europe US Ophthalmic Devices Industry Volume Share (%), by Devices 2024 & 2032
- Figure 27: Europe US Ophthalmic Devices Industry Revenue (Million), by Country 2024 & 2032
- Figure 28: Europe US Ophthalmic Devices Industry Volume (K Unit), by Country 2024 & 2032
- Figure 29: Europe US Ophthalmic Devices Industry Revenue Share (%), by Country 2024 & 2032
- Figure 30: Europe US Ophthalmic Devices Industry Volume Share (%), by Country 2024 & 2032
- Figure 31: Middle East & Africa US Ophthalmic Devices Industry Revenue (Million), by Devices 2024 & 2032
- Figure 32: Middle East & Africa US Ophthalmic Devices Industry Volume (K Unit), by Devices 2024 & 2032
- Figure 33: Middle East & Africa US Ophthalmic Devices Industry Revenue Share (%), by Devices 2024 & 2032
- Figure 34: Middle East & Africa US Ophthalmic Devices Industry Volume Share (%), by Devices 2024 & 2032
- Figure 35: Middle East & Africa US Ophthalmic Devices Industry Revenue (Million), by Country 2024 & 2032
- Figure 36: Middle East & Africa US Ophthalmic Devices Industry Volume (K Unit), by Country 2024 & 2032
- Figure 37: Middle East & Africa US Ophthalmic Devices Industry Revenue Share (%), by Country 2024 & 2032
- Figure 38: Middle East & Africa US Ophthalmic Devices Industry Volume Share (%), by Country 2024 & 2032
- Figure 39: Asia Pacific US Ophthalmic Devices Industry Revenue (Million), by Devices 2024 & 2032
- Figure 40: Asia Pacific US Ophthalmic Devices Industry Volume (K Unit), by Devices 2024 & 2032
- Figure 41: Asia Pacific US Ophthalmic Devices Industry Revenue Share (%), by Devices 2024 & 2032
- Figure 42: Asia Pacific US Ophthalmic Devices Industry Volume Share (%), by Devices 2024 & 2032
- Figure 43: Asia Pacific US Ophthalmic Devices Industry Revenue (Million), by Country 2024 & 2032
- Figure 44: Asia Pacific US Ophthalmic Devices Industry Volume (K Unit), by Country 2024 & 2032
- Figure 45: Asia Pacific US Ophthalmic Devices Industry Revenue Share (%), by Country 2024 & 2032
- Figure 46: Asia Pacific US Ophthalmic Devices Industry Volume Share (%), by Country 2024 & 2032
List of Tables
- Table 1: Global US Ophthalmic Devices Industry Revenue Million Forecast, by Region 2019 & 2032
- Table 2: Global US Ophthalmic Devices Industry Volume K Unit Forecast, by Region 2019 & 2032
- Table 3: Global US Ophthalmic Devices Industry Revenue Million Forecast, by Devices 2019 & 2032
- Table 4: Global US Ophthalmic Devices Industry Volume K Unit Forecast, by Devices 2019 & 2032
- Table 5: Global US Ophthalmic Devices Industry Revenue Million Forecast, by Region 2019 & 2032
- Table 6: Global US Ophthalmic Devices Industry Volume K Unit Forecast, by Region 2019 & 2032
- Table 7: Global US Ophthalmic Devices Industry Revenue Million Forecast, by Country 2019 & 2032
- Table 8: Global US Ophthalmic Devices Industry Volume K Unit Forecast, by Country 2019 & 2032
- Table 9: Northeast US Ophthalmic Devices Industry Revenue (Million) Forecast, by Application 2019 & 2032
- Table 10: Northeast US Ophthalmic Devices Industry Volume (K Unit) Forecast, by Application 2019 & 2032
- Table 11: Southeast US Ophthalmic Devices Industry Revenue (Million) Forecast, by Application 2019 & 2032
- Table 12: Southeast US Ophthalmic Devices Industry Volume (K Unit) Forecast, by Application 2019 & 2032
- Table 13: Midwest US Ophthalmic Devices Industry Revenue (Million) Forecast, by Application 2019 & 2032
- Table 14: Midwest US Ophthalmic Devices Industry Volume (K Unit) Forecast, by Application 2019 & 2032
- Table 15: Southwest US Ophthalmic Devices Industry Revenue (Million) Forecast, by Application 2019 & 2032
- Table 16: Southwest US Ophthalmic Devices Industry Volume (K Unit) Forecast, by Application 2019 & 2032
- Table 17: West US Ophthalmic Devices Industry Revenue (Million) Forecast, by Application 2019 & 2032
- Table 18: West US Ophthalmic Devices Industry Volume (K Unit) Forecast, by Application 2019 & 2032
- Table 19: Global US Ophthalmic Devices Industry Revenue Million Forecast, by Devices 2019 & 2032
- Table 20: Global US Ophthalmic Devices Industry Volume K Unit Forecast, by Devices 2019 & 2032
- Table 21: Global US Ophthalmic Devices Industry Revenue Million Forecast, by Country 2019 & 2032
- Table 22: Global US Ophthalmic Devices Industry Volume K Unit Forecast, by Country 2019 & 2032
- Table 23: United States US Ophthalmic Devices Industry Revenue (Million) Forecast, by Application 2019 & 2032
- Table 24: United States US Ophthalmic Devices Industry Volume (K Unit) Forecast, by Application 2019 & 2032
- Table 25: Canada US Ophthalmic Devices Industry Revenue (Million) Forecast, by Application 2019 & 2032
- Table 26: Canada US Ophthalmic Devices Industry Volume (K Unit) Forecast, by Application 2019 & 2032
- Table 27: Mexico US Ophthalmic Devices Industry Revenue (Million) Forecast, by Application 2019 & 2032
- Table 28: Mexico US Ophthalmic Devices Industry Volume (K Unit) Forecast, by Application 2019 & 2032
- Table 29: Global US Ophthalmic Devices Industry Revenue Million Forecast, by Devices 2019 & 2032
- Table 30: Global US Ophthalmic Devices Industry Volume K Unit Forecast, by Devices 2019 & 2032
- Table 31: Global US Ophthalmic Devices Industry Revenue Million Forecast, by Country 2019 & 2032
- Table 32: Global US Ophthalmic Devices Industry Volume K Unit Forecast, by Country 2019 & 2032
- Table 33: Brazil US Ophthalmic Devices Industry Revenue (Million) Forecast, by Application 2019 & 2032
- Table 34: Brazil US Ophthalmic Devices Industry Volume (K Unit) Forecast, by Application 2019 & 2032
- Table 35: Argentina US Ophthalmic Devices Industry Revenue (Million) Forecast, by Application 2019 & 2032
- Table 36: Argentina US Ophthalmic Devices Industry Volume (K Unit) Forecast, by Application 2019 & 2032
- Table 37: Rest of South America US Ophthalmic Devices Industry Revenue (Million) Forecast, by Application 2019 & 2032
- Table 38: Rest of South America US Ophthalmic Devices Industry Volume (K Unit) Forecast, by Application 2019 & 2032
- Table 39: Global US Ophthalmic Devices Industry Revenue Million Forecast, by Devices 2019 & 2032
- Table 40: Global US Ophthalmic Devices Industry Volume K Unit Forecast, by Devices 2019 & 2032
- Table 41: Global US Ophthalmic Devices Industry Revenue Million Forecast, by Country 2019 & 2032
- Table 42: Global US Ophthalmic Devices Industry Volume K Unit Forecast, by Country 2019 & 2032
- Table 43: United Kingdom US Ophthalmic Devices Industry Revenue (Million) Forecast, by Application 2019 & 2032
- Table 44: United Kingdom US Ophthalmic Devices Industry Volume (K Unit) Forecast, by Application 2019 & 2032
- Table 45: Germany US Ophthalmic Devices Industry Revenue (Million) Forecast, by Application 2019 & 2032
- Table 46: Germany US Ophthalmic Devices Industry Volume (K Unit) Forecast, by Application 2019 & 2032
- Table 47: France US Ophthalmic Devices Industry Revenue (Million) Forecast, by Application 2019 & 2032
- Table 48: France US Ophthalmic Devices Industry Volume (K Unit) Forecast, by Application 2019 & 2032
- Table 49: Italy US Ophthalmic Devices Industry Revenue (Million) Forecast, by Application 2019 & 2032
- Table 50: Italy US Ophthalmic Devices Industry Volume (K Unit) Forecast, by Application 2019 & 2032
- Table 51: Spain US Ophthalmic Devices Industry Revenue (Million) Forecast, by Application 2019 & 2032
- Table 52: Spain US Ophthalmic Devices Industry Volume (K Unit) Forecast, by Application 2019 & 2032
- Table 53: Russia US Ophthalmic Devices Industry Revenue (Million) Forecast, by Application 2019 & 2032
- Table 54: Russia US Ophthalmic Devices Industry Volume (K Unit) Forecast, by Application 2019 & 2032
- Table 55: Benelux US Ophthalmic Devices Industry Revenue (Million) Forecast, by Application 2019 & 2032
- Table 56: Benelux US Ophthalmic Devices Industry Volume (K Unit) Forecast, by Application 2019 & 2032
- Table 57: Nordics US Ophthalmic Devices Industry Revenue (Million) Forecast, by Application 2019 & 2032
- Table 58: Nordics US Ophthalmic Devices Industry Volume (K Unit) Forecast, by Application 2019 & 2032
- Table 59: Rest of Europe US Ophthalmic Devices Industry Revenue (Million) Forecast, by Application 2019 & 2032
- Table 60: Rest of Europe US Ophthalmic Devices Industry Volume (K Unit) Forecast, by Application 2019 & 2032
- Table 61: Global US Ophthalmic Devices Industry Revenue Million Forecast, by Devices 2019 & 2032
- Table 62: Global US Ophthalmic Devices Industry Volume K Unit Forecast, by Devices 2019 & 2032
- Table 63: Global US Ophthalmic Devices Industry Revenue Million Forecast, by Country 2019 & 2032
- Table 64: Global US Ophthalmic Devices Industry Volume K Unit Forecast, by Country 2019 & 2032
- Table 65: Turkey US Ophthalmic Devices Industry Revenue (Million) Forecast, by Application 2019 & 2032
- Table 66: Turkey US Ophthalmic Devices Industry Volume (K Unit) Forecast, by Application 2019 & 2032
- Table 67: Israel US Ophthalmic Devices Industry Revenue (Million) Forecast, by Application 2019 & 2032
- Table 68: Israel US Ophthalmic Devices Industry Volume (K Unit) Forecast, by Application 2019 & 2032
- Table 69: GCC US Ophthalmic Devices Industry Revenue (Million) Forecast, by Application 2019 & 2032
- Table 70: GCC US Ophthalmic Devices Industry Volume (K Unit) Forecast, by Application 2019 & 2032
- Table 71: North Africa US Ophthalmic Devices Industry Revenue (Million) Forecast, by Application 2019 & 2032
- Table 72: North Africa US Ophthalmic Devices Industry Volume (K Unit) Forecast, by Application 2019 & 2032
- Table 73: South Africa US Ophthalmic Devices Industry Revenue (Million) Forecast, by Application 2019 & 2032
- Table 74: South Africa US Ophthalmic Devices Industry Volume (K Unit) Forecast, by Application 2019 & 2032
- Table 75: Rest of Middle East & Africa US Ophthalmic Devices Industry Revenue (Million) Forecast, by Application 2019 & 2032
- Table 76: Rest of Middle East & Africa US Ophthalmic Devices Industry Volume (K Unit) Forecast, by Application 2019 & 2032
- Table 77: Global US Ophthalmic Devices Industry Revenue Million Forecast, by Devices 2019 & 2032
- Table 78: Global US Ophthalmic Devices Industry Volume K Unit Forecast, by Devices 2019 & 2032
- Table 79: Global US Ophthalmic Devices Industry Revenue Million Forecast, by Country 2019 & 2032
- Table 80: Global US Ophthalmic Devices Industry Volume K Unit Forecast, by Country 2019 & 2032
- Table 81: China US Ophthalmic Devices Industry Revenue (Million) Forecast, by Application 2019 & 2032
- Table 82: China US Ophthalmic Devices Industry Volume (K Unit) Forecast, by Application 2019 & 2032
- Table 83: India US Ophthalmic Devices Industry Revenue (Million) Forecast, by Application 2019 & 2032
- Table 84: India US Ophthalmic Devices Industry Volume (K Unit) Forecast, by Application 2019 & 2032
- Table 85: Japan US Ophthalmic Devices Industry Revenue (Million) Forecast, by Application 2019 & 2032
- Table 86: Japan US Ophthalmic Devices Industry Volume (K Unit) Forecast, by Application 2019 & 2032
- Table 87: South Korea US Ophthalmic Devices Industry Revenue (Million) Forecast, by Application 2019 & 2032
- Table 88: South Korea US Ophthalmic Devices Industry Volume (K Unit) Forecast, by Application 2019 & 2032
- Table 89: ASEAN US Ophthalmic Devices Industry Revenue (Million) Forecast, by Application 2019 & 2032
- Table 90: ASEAN US Ophthalmic Devices Industry Volume (K Unit) Forecast, by Application 2019 & 2032
- Table 91: Oceania US Ophthalmic Devices Industry Revenue (Million) Forecast, by Application 2019 & 2032
- Table 92: Oceania US Ophthalmic Devices Industry Volume (K Unit) Forecast, by Application 2019 & 2032
- Table 93: Rest of Asia Pacific US Ophthalmic Devices Industry Revenue (Million) Forecast, by Application 2019 & 2032
- Table 94: Rest of Asia Pacific US Ophthalmic Devices Industry Volume (K Unit) Forecast, by Application 2019 & 2032
Frequently Asked Questions
1. What is the projected Compound Annual Growth Rate (CAGR) of the US Ophthalmic Devices Industry?
The projected CAGR is approximately 6.90%.
2. Which companies are prominent players in the US Ophthalmic Devices Industry?
Key companies in the market include HAAG-Streit Group, Ziemer Ophthalmic Systems AG, Nidek Co Ltd, EssilorLuxottica SA, Johnson and Johnson, Carl Zeiss AG, Topcon Corporation, Alcon Inc, Bausch Health Companies Inc, Hoya Corporation.
3. What are the main segments of the US Ophthalmic Devices Industry?
The market segments include Devices.
4. Can you provide details about the market size?
The market size is estimated to be USD XX Million as of 2022.
5. What are some drivers contributing to market growth?
Demographic Shift and Increasing Prevalence of Eye Diseases; Rising Geriatric Population; Technological Advancements in Ophthalmic Devices.
6. What are the notable trends driving market growth?
Contact Lens are Expected to Register a Significant Growth in the United States Ophthalmic Devices Market Over the Forecast Period.
7. Are there any restraints impacting market growth?
Risk Associated with Ophthalmic Procedures.
8. Can you provide examples of recent developments in the market?
November 2022: Sight Sciences reported a publication of clinical data demonstrating the standalone effectiveness of the OMNI Surgical System in pseudophakic glaucoma patients with uncontrolled pressure following a previous combination cataract stent procedure.
9. What pricing options are available for accessing the report?
Pricing options include single-user, multi-user, and enterprise licenses priced at USD 3800, USD 4500, and USD 5800 respectively.
10. Is the market size provided in terms of value or volume?
The market size is provided in terms of value, measured in Million and volume, measured in K Unit.
11. Are there any specific market keywords associated with the report?
Yes, the market keyword associated with the report is "US Ophthalmic Devices Industry," which aids in identifying and referencing the specific market segment covered.
12. How do I determine which pricing option suits my needs best?
The pricing options vary based on user requirements and access needs. Individual users may opt for single-user licenses, while businesses requiring broader access may choose multi-user or enterprise licenses for cost-effective access to the report.
13. Are there any additional resources or data provided in the US Ophthalmic Devices Industry report?
While the report offers comprehensive insights, it's advisable to review the specific contents or supplementary materials provided to ascertain if additional resources or data are available.
14. How can I stay updated on further developments or reports in the US Ophthalmic Devices Industry?
To stay informed about further developments, trends, and reports in the US Ophthalmic Devices Industry, consider subscribing to industry newsletters, following relevant companies and organizations, or regularly checking reputable industry news sources and publications.
Methodology
Step 1 - Identification of Relevant Samples Size from Population Database


Step 2 - Approaches for Defining Global Market Size (Value, Volume* & Price*)

Note*: In applicable scenarios
Step 3 - Data Sources
Primary Research
- Web Analytics
- Survey Reports
- Research Institute
- Latest Research Reports
- Opinion Leaders
Secondary Research
- Annual Reports
- White Paper
- Latest Press Release
- Industry Association
- Paid Database
- Investor Presentations

Step 4 - Data Triangulation
Involves using different sources of information in order to increase the validity of a study
These sources are likely to be stakeholders in a program - participants, other researchers, program staff, other community members, and so on.
Then we put all data in single framework & apply various statistical tools to find out the dynamic on the market.
During the analysis stage, feedback from the stakeholder groups would be compared to determine areas of agreement as well as areas of divergence


