U.S. Food Colorants Industry’s Role in Shaping Industry Trends 2025-2033

U.S. Food Colorants Industry by Type (Synthetic, Natural), by Application (Beverages, Dairy, Bakery, Meat and Poultry, Confectionery, Others), by U.S. Forecast 2025-2033

Jul 3 2025
Base Year: 2024

197 Pages
Main Logo

U.S. Food Colorants Industry’s Role in Shaping Industry Trends 2025-2033


Home
Industries
Food & Beverage
sponsor image
sponsor image
sponsor image
sponsor image

Tailored for you

  • In-depth Analysis Tailored to Specified Regions or Segments
  • Company Profiles Customized to User Preferences
  • Comprehensive Insights Focused on Specific Segments or Regions
  • Customized Evaluation of Competitive Landscape to Meet Your Needs
  • Tailored Customization to Address Other Specific Requirements
Ask for customization


Key Insights

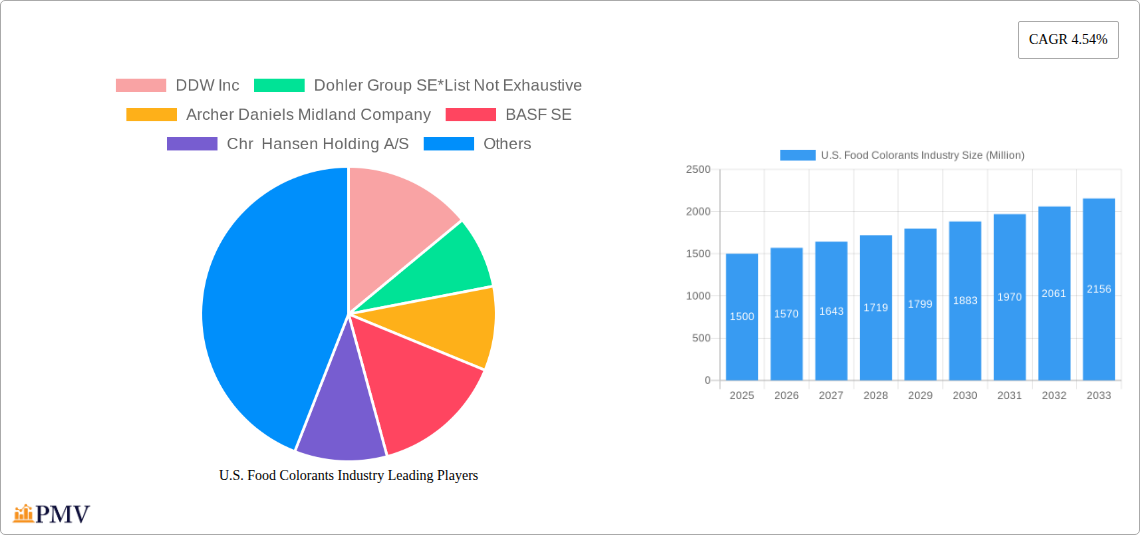
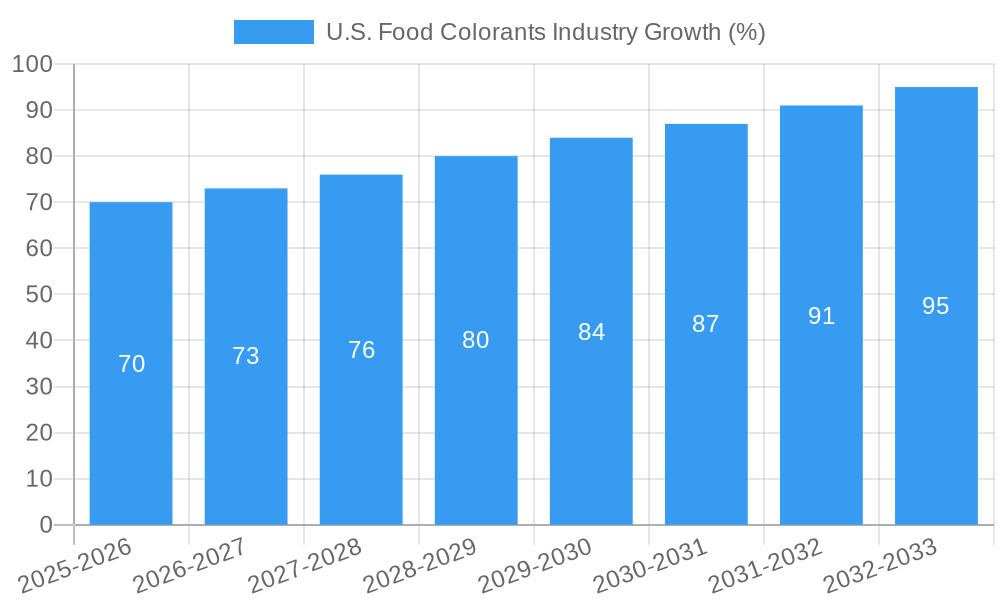
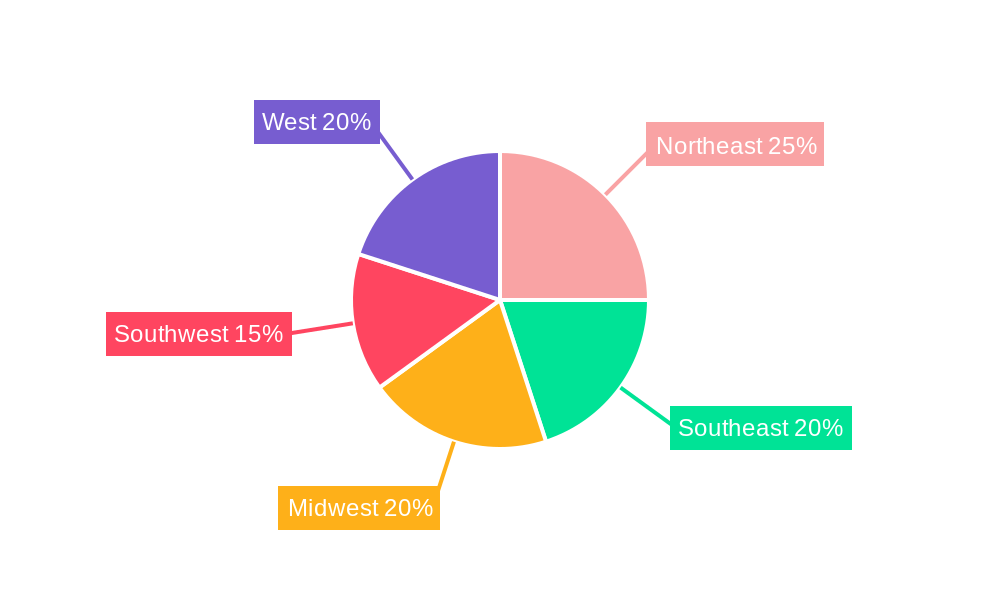
The U.S. food colorants market, valued at approximately $1.5 billion in 2025, is projected to experience robust growth, exhibiting a compound annual growth rate (CAGR) of 4.54% from 2025 to 2033. This expansion is driven by several key factors. The increasing demand for visually appealing and innovative food products across various segments, including beverages, confectionery, and bakery, is a primary driver. Consumer preferences for vibrant colors and enhanced aesthetic appeal in processed foods continue to fuel market growth. Furthermore, the rising popularity of convenience foods and ready-to-eat meals contributes significantly, as these products often rely on food colorants to maintain visual consistency and appeal. Technological advancements in colorant production, leading to improved stability, purity, and cost-effectiveness, further stimulate market expansion. The market segmentation reveals a strong preference for synthetic food colorants due to their cost-effectiveness and wide availability, although the growing demand for natural and organic food products is pushing the natural colorant segment towards significant growth in the coming years. Regional analysis shows a strong market concentration in the populous regions like the Northeast and West, reflecting high consumption in these areas.

However, the market faces certain challenges. Stringent regulations and safety concerns surrounding the use of certain synthetic colorants impose constraints on market growth. Increasing consumer awareness of potential health risks associated with artificial food colorants, coupled with the growing preference for natural alternatives, pose a significant challenge to the synthetic segment. Fluctuations in raw material prices and supply chain disruptions can also impact market dynamics. To navigate these challenges, manufacturers are investing in research and development to create innovative, natural colorants that meet stringent quality and safety standards while also addressing consumer demand for clean-label products. This focus on natural alternatives alongside ongoing efforts to ensure the safety and efficacy of synthetic options is expected to shape the future trajectory of the U.S. food colorants market.

U.S. Food Colorants Industry Research Report - Market Size, Growth & Forecast

U.S. Food Colorants Industry Market Report: 2019-2033

This comprehensive report provides an in-depth analysis of the U.S. food colorants industry, offering crucial insights for businesses, investors, and stakeholders seeking to navigate this dynamic market. With a study period spanning 2019-2033, a base year of 2025, and a forecast period of 2025-2033, this report leverages historical data (2019-2024) and current market trends to project future growth and opportunities. The market size is estimated at xx Million in 2025.

U.S. Food Colorants Industry Market Structure & Competitive Dynamics

This section analyzes the competitive landscape of the U.S. food colorants market, examining market concentration, innovation ecosystems, regulatory frameworks, product substitutes, end-user trends, and merger and acquisition (M&A) activities. The market is moderately concentrated, with several major players holding significant market share. For example, DDW Inc, Dohler Group SE, Archer Daniels Midland Company, BASF SE, Chr. Hansen Holding A/S, Koninklijke DSM N.V., GNT Group B.V., and Sensient Technologies Corporation are key players. Innovation is driven by the demand for natural colorants and the development of sustainable production methods. The regulatory environment significantly impacts the industry, with strict regulations surrounding the use of certain synthetic food colorants. The market witnesses continuous M&A activities, with deal values ranging from xx Million to xx Million in recent years, further shaping the competitive dynamics. These activities aim to expand product portfolios, enhance market reach, and secure access to new technologies. End-user trends toward clean-label products and growing health consciousness drive the demand for natural colorants.

U.S. Food Colorants Industry Trends & Insights

The U.S. food colorants market is experiencing significant growth driven by several key factors. The increasing demand for processed foods and beverages fuels the need for food colorants to enhance visual appeal and brand identity. The market is witnessing a strong shift towards natural food colorants due to growing consumer preference for clean-label products and health concerns associated with synthetic dyes. Technological advancements in extraction and production techniques are making natural colorants more cost-effective and readily available. The market’s compound annual growth rate (CAGR) is projected to be xx% during the forecast period (2025-2033), driven by increasing demand from the confectionery, beverage, and bakery segments. Market penetration of natural colorants is steadily increasing, expected to reach xx% by 2033. Competitive dynamics include price wars, innovation in product offerings, and strategic partnerships to secure raw material supply.

U.S. Food Colorants Industry Growth

Dominant Markets & Segments in U.S. Food Colorants Industry

  • By Type: The natural food colorants segment is experiencing faster growth compared to its synthetic counterpart, driven by health-conscious consumer preferences and increasing regulatory scrutiny of synthetic dyes.
  • By Application: Beverages remains the dominant application segment, followed closely by confectionery and bakery products. The meat and poultry segment is experiencing steady growth, driven by the demand for visually appealing products. Dairy products also represent a significant market for food colorants, with continued demand.

Key drivers for these segments include the robust food and beverage industry in the U.S., the increasing preference for visually appealing products, and stringent quality regulations. Economic policies impacting the food processing sector, coupled with well-developed infrastructure, play a critical role in segment growth. The dominance of certain segments is largely driven by consumer demand for specific product types and the versatility of food colorants in enhancing their appearance.

U.S. Food Colorants Industry Product Innovations

Recent product developments focus on creating natural colorants with enhanced stability, color intensity, and broader applications. Technological advancements in extraction methods and formulation techniques are leading to the development of more versatile and cost-effective natural colorants. Companies are actively developing colorants derived from fruits, vegetables, and other natural sources to meet the growing demand for clean-label products. These innovations provide manufacturers with a competitive edge by meeting consumer preferences and complying with increasingly stringent regulations.

Report Segmentation & Scope

This report segments the U.S. food colorants market by type (synthetic and natural) and by application (beverages, dairy, bakery, meat and poultry, confectionery, and others). Each segment’s growth projections, market sizes, and competitive dynamics are analyzed. The synthetic segment is expected to show moderate growth but will face stricter regulatory scrutiny, while the natural segment is expected to exhibit higher growth due to consumer demand for natural and clean-label ingredients.

Key Drivers of U.S. Food Colorants Industry Growth

Key growth drivers include increasing demand for processed foods, the rising popularity of natural food colorants, technological advancements improving the quality and affordability of natural colorants, and expanding applications across various food and beverage sectors. Government regulations encouraging the use of natural ingredients further bolster growth.

Challenges in the U.S. Food Colorants Industry Sector

Challenges include stringent regulations, price volatility of raw materials, fluctuating consumer preferences, and intense competition among existing players, and ensuring consistent color quality and stability, particularly with natural colorants. These challenges can significantly impact market profitability and expansion.

Leading Players in the U.S. Food Colorants Industry Market

  • DDW Inc
  • Dohler Group SE
  • Archer Daniels Midland Company
  • BASF SE
  • Chr Hansen Holding A/S
  • Koninklijke DSM N.V.
  • GNT Group B.V.
  • Sensient Technologies Corporation

Key Developments in U.S. Food Colorants Industry Sector

  • October 2022: GNT Group launched a new range of natural colorants.
  • March 2023: DDW Inc. invested in expanding its natural colorants production capacity.
  • June 2024: A major merger occurred between two smaller food colorant companies. (Further details would be included in the full report).

Further details on these and other key developments are included in the complete report.

Strategic U.S. Food Colorants Industry Market Outlook

The U.S. food colorants industry is poised for continued growth, fueled by increasing demand for processed foods, the rising popularity of natural colorants, and ongoing technological advancements. Strategic opportunities exist for companies focusing on innovation, sustainable practices, and meeting the demands of health-conscious consumers. Companies investing in research and development of new natural colorants with enhanced stability and functionality will be well-positioned to capitalize on market expansion.

U.S. Food Colorants Industry Segmentation

  • 1. Type
    • 1.1. Synthetic
    • 1.2. Natural
  • 2. Application
    • 2.1. Beverages
    • 2.2. Dairy
    • 2.3. Bakery
    • 2.4. Meat and Poultry
    • 2.5. Confectionery
    • 2.6. Others

U.S. Food Colorants Industry Segmentation By Geography

  • 1. U.S.
U.S. Food Colorants Industry Regional Share


U.S. Food Colorants Industry REPORT HIGHLIGHTS

AspectsDetails
Study Period 2019-2033
Base Year 2024
Estimated Year 2025
Forecast Period2025-2033
Historical Period2019-2024
Growth RateCAGR of 4.54% from 2019-2033
Segmentation
    • By Type
      • Synthetic
      • Natural
    • By Application
      • Beverages
      • Dairy
      • Bakery
      • Meat and Poultry
      • Confectionery
      • Others
  • By Geography
    • U.S.


Table of Contents

  1. 1. Introduction
    • 1.1. Research Scope
    • 1.2. Market Segmentation
    • 1.3. Research Methodology
    • 1.4. Definitions and Assumptions
  2. 2. Executive Summary
    • 2.1. Introduction
  3. 3. Market Dynamics
    • 3.1. Introduction
      • 3.2. Market Drivers
        • 3.2.1. Rising Health Consciousness among consumer
      • 3.3. Market Restrains
        • 3.3.1. High Cost of natural Ingredients
      • 3.4. Market Trends
        • 3.4.1. Natural Colorants Dominate the Market
  4. 4. Market Factor Analysis
    • 4.1. Porters Five Forces
    • 4.2. Supply/Value Chain
    • 4.3. PESTEL analysis
    • 4.4. Market Entropy
    • 4.5. Patent/Trademark Analysis
  5. 5. U.S. Food Colorants Industry Analysis, Insights and Forecast, 2019-2031
    • 5.1. Market Analysis, Insights and Forecast - by Type
      • 5.1.1. Synthetic
      • 5.1.2. Natural
    • 5.2. Market Analysis, Insights and Forecast - by Application
      • 5.2.1. Beverages
      • 5.2.2. Dairy
      • 5.2.3. Bakery
      • 5.2.4. Meat and Poultry
      • 5.2.5. Confectionery
      • 5.2.6. Others
    • 5.3. Market Analysis, Insights and Forecast - by Region
      • 5.3.1. U.S.
  6. 6. Northeast U.S. Food Colorants Industry Analysis, Insights and Forecast, 2019-2031
    • 7. Southeast U.S. Food Colorants Industry Analysis, Insights and Forecast, 2019-2031
      • 8. Midwest U.S. Food Colorants Industry Analysis, Insights and Forecast, 2019-2031
        • 9. Southwest U.S. Food Colorants Industry Analysis, Insights and Forecast, 2019-2031
          • 10. West U.S. Food Colorants Industry Analysis, Insights and Forecast, 2019-2031
            • 11. Competitive Analysis
              • 11.1. Market Share Analysis 2024
                • 11.2. Company Profiles
                  • 11.2.1 DDW Inc
                    • 11.2.1.1. Overview
                    • 11.2.1.2. Products
                    • 11.2.1.3. SWOT Analysis
                    • 11.2.1.4. Recent Developments
                    • 11.2.1.5. Financials (Based on Availability)
                  • 11.2.2 Dohler Group SE*List Not Exhaustive
                    • 11.2.2.1. Overview
                    • 11.2.2.2. Products
                    • 11.2.2.3. SWOT Analysis
                    • 11.2.2.4. Recent Developments
                    • 11.2.2.5. Financials (Based on Availability)
                  • 11.2.3 Archer Daniels Midland Company
                    • 11.2.3.1. Overview
                    • 11.2.3.2. Products
                    • 11.2.3.3. SWOT Analysis
                    • 11.2.3.4. Recent Developments
                    • 11.2.3.5. Financials (Based on Availability)
                  • 11.2.4 BASF SE
                    • 11.2.4.1. Overview
                    • 11.2.4.2. Products
                    • 11.2.4.3. SWOT Analysis
                    • 11.2.4.4. Recent Developments
                    • 11.2.4.5. Financials (Based on Availability)
                  • 11.2.5 Chr Hansen Holding A/S
                    • 11.2.5.1. Overview
                    • 11.2.5.2. Products
                    • 11.2.5.3. SWOT Analysis
                    • 11.2.5.4. Recent Developments
                    • 11.2.5.5. Financials (Based on Availability)
                  • 11.2.6 Koninklijke DSM N V
                    • 11.2.6.1. Overview
                    • 11.2.6.2. Products
                    • 11.2.6.3. SWOT Analysis
                    • 11.2.6.4. Recent Developments
                    • 11.2.6.5. Financials (Based on Availability)
                  • 11.2.7 GNT Group B V
                    • 11.2.7.1. Overview
                    • 11.2.7.2. Products
                    • 11.2.7.3. SWOT Analysis
                    • 11.2.7.4. Recent Developments
                    • 11.2.7.5. Financials (Based on Availability)
                  • 11.2.8 Sensient Technologies Corporation
                    • 11.2.8.1. Overview
                    • 11.2.8.2. Products
                    • 11.2.8.3. SWOT Analysis
                    • 11.2.8.4. Recent Developments
                    • 11.2.8.5. Financials (Based on Availability)

            List of Figures

            1. Figure 1: U.S. Food Colorants Industry Revenue Breakdown (Million, %) by Product 2024 & 2032
            2. Figure 2: U.S. Food Colorants Industry Share (%) by Company 2024

            List of Tables

            1. Table 1: U.S. Food Colorants Industry Revenue Million Forecast, by Region 2019 & 2032
            2. Table 2: U.S. Food Colorants Industry Revenue Million Forecast, by Type 2019 & 2032
            3. Table 3: U.S. Food Colorants Industry Revenue Million Forecast, by Application 2019 & 2032
            4. Table 4: U.S. Food Colorants Industry Revenue Million Forecast, by Region 2019 & 2032
            5. Table 5: U.S. Food Colorants Industry Revenue Million Forecast, by Country 2019 & 2032
            6. Table 6: Northeast U.S. Food Colorants Industry Revenue (Million) Forecast, by Application 2019 & 2032
            7. Table 7: Southeast U.S. Food Colorants Industry Revenue (Million) Forecast, by Application 2019 & 2032
            8. Table 8: Midwest U.S. Food Colorants Industry Revenue (Million) Forecast, by Application 2019 & 2032
            9. Table 9: Southwest U.S. Food Colorants Industry Revenue (Million) Forecast, by Application 2019 & 2032
            10. Table 10: West U.S. Food Colorants Industry Revenue (Million) Forecast, by Application 2019 & 2032
            11. Table 11: U.S. Food Colorants Industry Revenue Million Forecast, by Type 2019 & 2032
            12. Table 12: U.S. Food Colorants Industry Revenue Million Forecast, by Application 2019 & 2032
            13. Table 13: U.S. Food Colorants Industry Revenue Million Forecast, by Country 2019 & 2032


            Frequently Asked Questions

            1. What is the projected Compound Annual Growth Rate (CAGR) of the U.S. Food Colorants Industry?

            The projected CAGR is approximately 4.54%.

            2. Which companies are prominent players in the U.S. Food Colorants Industry?

            Key companies in the market include DDW Inc, Dohler Group SE*List Not Exhaustive, Archer Daniels Midland Company, BASF SE, Chr Hansen Holding A/S, Koninklijke DSM N V, GNT Group B V, Sensient Technologies Corporation.

            3. What are the main segments of the U.S. Food Colorants Industry?

            The market segments include Type, Application.

            4. Can you provide details about the market size?

            The market size is estimated to be USD XX Million as of 2022.

            5. What are some drivers contributing to market growth?

            Rising Health Consciousness among consumer.

            6. What are the notable trends driving market growth?

            Natural Colorants Dominate the Market.

            7. Are there any restraints impacting market growth?

            High Cost of natural Ingredients.

            8. Can you provide examples of recent developments in the market?

            N/A

            9. What pricing options are available for accessing the report?

            Pricing options include single-user, multi-user, and enterprise licenses priced at USD 3800, USD 4500, and USD 5800 respectively.

            10. Is the market size provided in terms of value or volume?

            The market size is provided in terms of value, measured in Million.

            11. Are there any specific market keywords associated with the report?

            Yes, the market keyword associated with the report is "U.S. Food Colorants Industry," which aids in identifying and referencing the specific market segment covered.

            12. How do I determine which pricing option suits my needs best?

            The pricing options vary based on user requirements and access needs. Individual users may opt for single-user licenses, while businesses requiring broader access may choose multi-user or enterprise licenses for cost-effective access to the report.

            13. Are there any additional resources or data provided in the U.S. Food Colorants Industry report?

            While the report offers comprehensive insights, it's advisable to review the specific contents or supplementary materials provided to ascertain if additional resources or data are available.

            14. How can I stay updated on further developments or reports in the U.S. Food Colorants Industry?

            To stay informed about further developments, trends, and reports in the U.S. Food Colorants Industry, consider subscribing to industry newsletters, following relevant companies and organizations, or regularly checking reputable industry news sources and publications.


            Methodology

            Step 1 - Identification of Relevant Samples Size from Population Database

            Step Chart
            Bar Chart
            Method Chart

            Step 2 - Approaches for Defining Global Market Size (Value, Volume* & Price*)

            Approach Chart
            Top-down and bottom-up approaches are used to validate the global market size and estimate the market size for manufactures, regional segments, product, and application.

            Note*: In applicable scenarios

            Step 3 - Data Sources

            Primary Research

            • Web Analytics
            • Survey Reports
            • Research Institute
            • Latest Research Reports
            • Opinion Leaders

            Secondary Research

            • Annual Reports
            • White Paper
            • Latest Press Release
            • Industry Association
            • Paid Database
            • Investor Presentations
            Analyst Chart

            Step 4 - Data Triangulation

            Involves using different sources of information in order to increase the validity of a study

            These sources are likely to be stakeholders in a program - participants, other researchers, program staff, other community members, and so on.

            Then we put all data in single framework & apply various statistical tools to find out the dynamic on the market.

            During the analysis stage, feedback from the stakeholder groups would be compared to determine areas of agreement as well as areas of divergence

            Additionally, after gathering mixed and scattered data from a wide range of sources, data is triangulated and correlated to come up with estimated figures which are further validated through primary mediums or industry experts, opinion leaders.

            About Precision Market View

            Precision Market View offers precise market research, industry intelligence, and data analysis for healthcare, manufacturing, technology, and energy. Our reports provide the clarity you need to make informed decisions and drive growth.

            Our team combines primary research, advanced analytics, and industry expertise to deliver actionable intelligence. We offer syndicated reports, custom research, and consulting services tailored to your business needs.

            At Precision Market View, we are committed to quality, transparency, and client satisfaction. Every report is rigorously validated to ensure accuracy and relevance. Our global perspective and local expertise help you understand both the big picture and the finer details of your market.

            Stay informed with Precision Market View. Subscribe to our newsletter for the latest updates and research highlights, and follow us on social media for real-time insights.

            Precision Market View – Clarity for Your Strategic Decisions.

            artwork spiralartwork spiralRelated Reports
            artwork underline

            Japanese Sports Drinks Beverage Industry Insightful Analysis: Trends, Competitor Dynamics, and Opportunities 2025-2033

            Discover the booming Japanese sports drink market! Explore key trends, leading brands (Coca-Cola, PepsiCo, etc.), and growth projections (2025-2033) for this dynamic sector. Learn about market size, segmentation, and future opportunities in this detailed analysis.

            July 2025
            Base Year: 2024
            No Of Pages: 197
            Price: $3800

            France Soy Protein Market Future-proof Strategies: Trends, Competitor Dynamics, and Opportunities 2025-2033

            Discover the booming France soy protein market! This comprehensive analysis reveals key trends, market size (€300 million in 2025), CAGR, leading companies, and growth drivers from 2019-2033. Explore segments like concentrates, isolates, and end-user applications in food, animal feed, and personal care.

            July 2025
            Base Year: 2024
            No Of Pages: 197
            Price: $3800

            Analyzing the Future of North America Dairy Market: Key Trends to 2033

            Discover the latest insights into the booming North American dairy market. Explore market size, CAGR, key drivers, and challenges, plus a regional breakdown and analysis of leading companies like Nestlé and Unilever. Projecting steady growth to 2033, this report provides essential information for industry professionals.

            July 2025
            Base Year: 2024
            No Of Pages: 197
            Price: $3800

            Exploring Opportunities in Cereal Bars Market in South America Sector

            Discover the booming South American cereal bar market! This in-depth analysis reveals key trends, growth drivers, and market forecasts (2025-2033) for granola bars, muesli bars, and other cereal bars across Brazil, Argentina, and the wider region. Learn about leading brands and emerging opportunities in this dynamic market.

            July 2025
            Base Year: 2024
            No Of Pages: 210
            Price: $4750

            MEA Fruits and Vegetable Juice Market 2025-2033 Analysis: Trends, Competitor Dynamics, and Growth Opportunities

            Discover the booming MEA fruits & vegetable juice market! This comprehensive analysis reveals a CAGR of 6.24%, driven by health trends and rising disposable incomes. Explore market size, segmentation, key players (Almarai, Pran Foods, Coca-Cola), and future growth projections until 2033. Learn about regional variations and opportunities within this dynamic sector.

            July 2025
            Base Year: 2024
            No Of Pages: 234
            Price: $4750

            Germany Poultry Meat Market Analysis 2025 and Forecasts 2033: Unveiling Growth Opportunities

            Discover the latest insights into the booming German poultry meat market. This comprehensive analysis reveals key growth drivers, market trends, and competitive dynamics, projecting robust expansion through 2033. Explore market segmentation, regional variations, and leading companies shaping this vital sector.

            July 2025
            Base Year: 2024
            No Of Pages: 197
            Price: $3800

            Italian Protein Powder Industry in North America: Market Dynamics and Forecasts 2025-2033

            Discover the booming Italian protein powder market! This in-depth analysis reveals key trends, growth projections (CAGR), leading companies, and segment analysis for 2025-2033. Learn about the market size, drivers, and challenges shaping this lucrative industry.

            July 2025
            Base Year: 2024
            No Of Pages: 180
            Price: $3800

            Growth Catalysts in Antioxidant Beverages Market Market

            Discover the booming antioxidant beverage market! This comprehensive analysis reveals key trends, growth drivers, and leading companies, projecting a significant market expansion to [estimated market size in 2033] by 2033 with a CAGR of 8.70%. Explore regional insights and market segmentation data for informed business decisions.

            July 2025
            Base Year: 2024
            No Of Pages: 234
            Price: $4750

            Opportunities in Emerging Gelatin Industry Industry Markets

            The global gelatin market is booming, projected to reach $XX million by 2033 with a CAGR of 5.11%. Driven by food & beverage, pharmaceutical, and personal care demand, this comprehensive analysis explores market trends, key players (Darling Ingredients, Gelita AG), and regional growth forecasts. Discover the opportunities and challenges shaping this dynamic industry.

            July 2025
            Base Year: 2024
            No Of Pages: 197
            Price: $3800

            Food 3D Printing Market Market Growth Fueled by CAGR to XXX Million by 2033

            The food 3D printing market is booming, projected to reach $5.96 billion by 2033 with a CAGR of 31.57%. This report analyzes market size, growth drivers, trends, restraints, and regional segmentation, featuring key players like TNO and Modern Meadow. Discover the future of personalized food and innovative culinary experiences.

            July 2025
            Base Year: 2024
            No Of Pages: 234
            Price: $4750

            China Dairy Market Market Size and Trends 2025-2033: Comprehensive Outlook

            Discover the booming China dairy market! Our analysis reveals a CAGR of 3.44% to 2033, driven by rising incomes and health consciousness. Learn about key players, market segments, and future trends impacting this lucrative sector.

            July 2025
            Base Year: 2024
            No Of Pages: 197
            Price: $3800

            Middle East & Africa Rice Protein Market Strategic Market Roadmap: Analysis and Forecasts 2025-2033

            Discover the booming Middle East & Africa rice protein market! This comprehensive analysis reveals a CAGR of 5.76%, driven by plant-based trends and health consciousness. Explore market size, segmentation, key players, and future growth projections.

            July 2025
            Base Year: 2024
            No Of Pages: 180
            Price: $4750

            MEA Chocolate Industry Market Growth Fueled by CAGR to XXX Million by 2033

            Discover the booming MEA chocolate market! Our in-depth analysis reveals a CAGR of 6.72% through 2033, driven by rising incomes and changing consumer preferences. Explore market size, segmentation, key players (Nestlé, Ferrero, Mondelez), and future trends in this dynamic region.

            July 2025
            Base Year: 2024
            No Of Pages: 234
            Price: $4750

            United States Milk Protein Market Comprehensive Market Study: Trends and Predictions 2025-2033

            Discover the booming US milk protein market, projected to reach $4B+ by 2033! This in-depth analysis reveals key drivers, trends, and market segmentation, featuring insights into leading companies and regional performance. Learn about growth opportunities in food & beverage, animal feed, and sports nutrition.

            July 2025
            Base Year: 2024
            No Of Pages: 197
            Price: $3800

            Future Forecasts for India Breakfast Cereal Market Industry Growth

            Discover the booming India breakfast cereal market! Learn about its ₹25 billion valuation, 8.20% CAGR growth, key players like Kellogg's & Nestle, and the trends shaping this dynamic sector. Explore market segmentation, regional insights, and future projections for 2025-2033.

            July 2025
            Base Year: 2024
            No Of Pages: 197
            Price: $3800

            Asia-Pacific Free-dried Fruits and Vegetables Market Market Valuation to Hit XXX Million by 2033

            Discover the booming Asia-Pacific free-dried fruits and vegetables market. Explore key trends, growth drivers, leading companies, and regional insights for this dynamic sector projected to reach [estimated 2033 market size in millions] by 2033. Learn more about the opportunities and challenges in this rapidly expanding market.

            July 2025
            Base Year: 2024
            No Of Pages: 234
            Price: $4750

            Spirulina Extracts Market Drivers of Growth: Opportunities to 2033

            Discover the booming Spirulina Extracts Market! Projected to reach over $1.5 billion by 2033, this market is fueled by rising health consciousness and diverse applications in nutraceuticals, food, and cosmetics. Learn about key trends, drivers, and leading companies shaping this exciting sector.

            July 2025
            Base Year: 2024
            No Of Pages: 234
            Price: $4750

            Emerging Opportunities in South Africa Beverages Market Market

            Discover the booming South African beverage market! This comprehensive analysis reveals key trends, growth drivers, and challenges impacting alcoholic & non-alcoholic drinks from 2019-2033, featuring major players like Coca-Cola, Red Bull, and local brands. Explore market size, CAGR, and regional insights for informed business decisions.

            July 2025
            Base Year: 2024
            No Of Pages: 197
            Price: $3800

            GCC Edible Meat Market Strategic Insights: Analysis 2025 and Forecasts 2033

            Discover the booming GCC edible meat market! This comprehensive analysis reveals key trends, growth drivers (population growth, disposable income rise), restraints (price fluctuations, health consciousness), and leading players from 2019-2033. Learn about market segmentation (beef, mutton, poultry, etc.) and regional insights.

            July 2025
            Base Year: 2024
            No Of Pages: 197
            Price: $3800

            United Kingdom Tofu Industry Industry Overview and Projections

            The UK tofu market is booming, projected to reach £413.83 million by 2033, driven by veganism, health consciousness, and sustainable food trends. Discover key market insights, growth projections, and leading players in this rapidly expanding sector.

            July 2025
            Base Year: 2024
            No Of Pages: 197
            Price: $3800
            • Home
            • About Us
            • Industries
              • Aerospace & Defense
              • Agriculture
              • Animal Nutrition & Wellness
              • Automotive
              • Chemicals & Materials
              • Consumer Goods and Services
              • Energy & Power
              • Financial Services and Investment Intelligence
              • Food & Beverage
              • Home and Property Improvement
              • Hospitality and Tourism
              • Logistics
              • Manufacturing Products and Services
              • Packaging
              • Professional and Commercial Services
              • Real Estate and Construction
              • Retail
              • Technology, Media and Telecom
              • Healthcare
            • Services
            • Contact
            Main Logo
            • Home
            • About Us
            • Industries
              • Aerospace & Defense
              • Agriculture
              • Animal Nutrition & Wellness
              • Automotive
              • Chemicals & Materials
              • Consumer Goods and Services
              • Energy & Power
              • Financial Services and Investment Intelligence
              • Food & Beverage
              • Home and Property Improvement
              • Hospitality and Tourism
              • Logistics
              • Manufacturing Products and Services
              • Packaging
              • Professional and Commercial Services
              • Real Estate and Construction
              • Retail
              • Technology, Media and Telecom
              • Healthcare
            • Services
            • Contact
            +17162654855
            [email protected]

            +17162654855

            [email protected]

            Business Address

            Head Office

            Office no. A 5010, fifth floor, Solitaire Business Hub, Near Phoenix mall, Pune, Maharashtra 411014

            Contact Information

            Craig Francis

            Business Development Head

            +17162654855

            [email protected]

            Connect With Us

            Secure Payment Partners

            payment image
            RetailLogisticsPackagingAutomotiveHealthcareAgricultureEnergy & PowerFood & BeverageAerospace & DefenseChemicals & MaterialsHospitality and TourismAnimal Nutrition & WellnessConsumer Goods and ServicesReal Estate and ConstructionHome and Property ImprovementTechnology, Media and TelecomManufacturing Products and ServicesFinancial Services and Investment Intelligence

            © 2025 All rights reserved


            Privacy Policy
            Terms and Conditions
            FAQ