
Key Insights
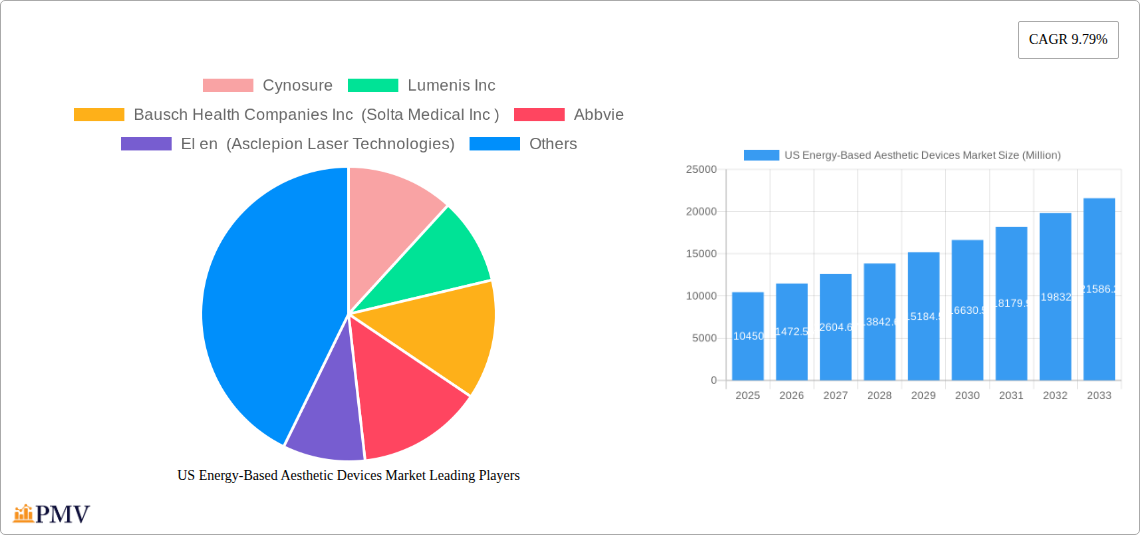
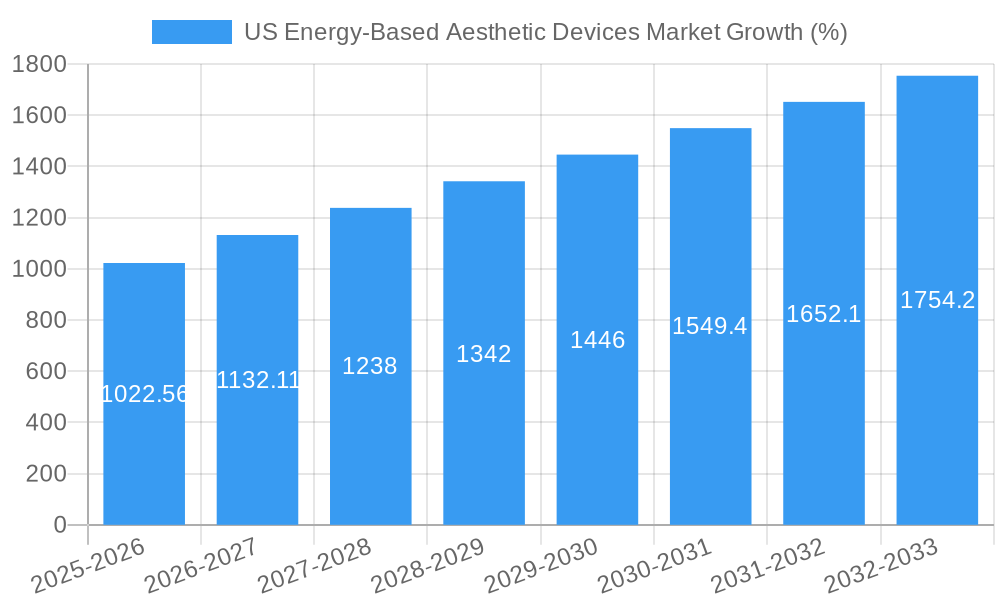
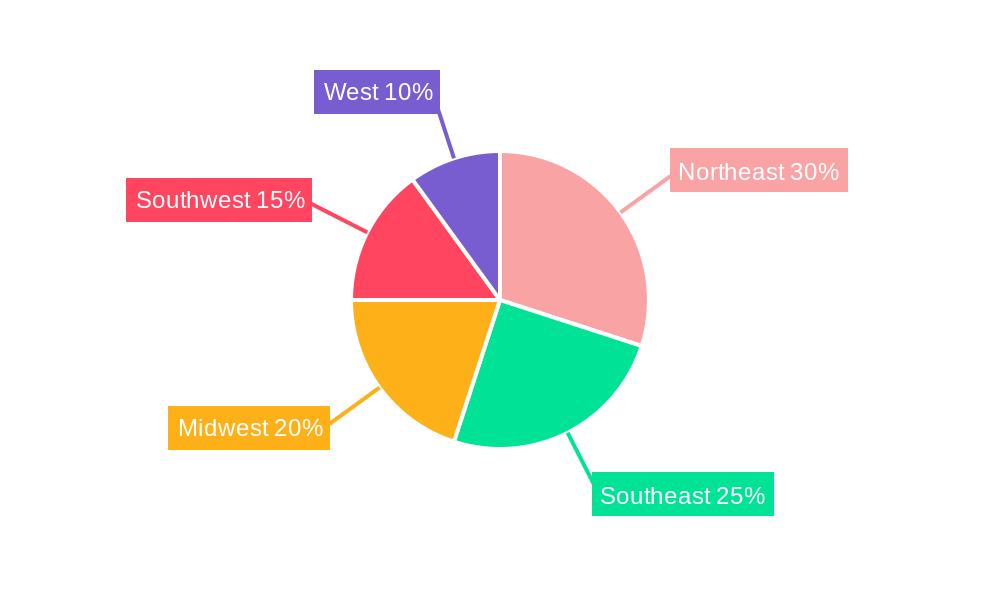
The US energy-based aesthetic devices market, valued at $10.45 billion in 2025, is projected to experience robust growth, driven by a rising demand for minimally invasive cosmetic procedures and an increasing awareness of aesthetic treatments among consumers. The market's Compound Annual Growth Rate (CAGR) of 9.79% from 2025 to 2033 indicates a significant expansion. Key drivers include technological advancements leading to safer and more effective devices, the growing popularity of non-surgical cosmetic procedures as a less invasive alternative to surgery, and an expanding aging population with a higher disposable income seeking anti-aging solutions. Furthermore, increased marketing and promotional activities by manufacturers contribute to market growth. While factors such as high treatment costs and potential side effects act as restraints, the overall market outlook remains positive due to favorable demographic trends and ongoing innovation. Specific segments like skin resurfacing and tightening, and body contouring and cellulite reduction, are anticipated to show particularly strong growth within this market. The competitive landscape is characterized by a mix of established players and emerging companies, continually innovating to capture market share. The Northeast region, given its higher concentration of medical facilities and affluent population, is likely to hold a significant market share within the United States.
The segmentation of the US energy-based aesthetic devices market further highlights specific growth opportunities. Energy-based devices, particularly those utilized for skin resurfacing and tightening, are expected to dominate due to their versatility and efficacy in addressing various aesthetic concerns. The increasing adoption of these devices in clinics and hospitals is fueled by their integration into established medical practices and the preference for professional treatment. The segment of non-energy-based devices may experience a slower growth rate compared to their energy-based counterparts, but will continue to play a role, particularly in niche applications. The regional distribution suggests that market penetration will vary across states, with states in the Northeast and West potentially leading in adoption due to higher disposable income and denser population centers. Future growth will depend on continuous technological advancements, effective marketing strategies, and the increasing acceptance of non-invasive cosmetic procedures.
US Energy-Based Aesthetic Devices Market: A Comprehensive Report (2019-2033)
This comprehensive report provides a detailed analysis of the US Energy-Based Aesthetic Devices market, offering invaluable insights for stakeholders seeking to understand market dynamics, competitive landscapes, and future growth prospects. The study covers the period 2019-2033, with 2025 serving as the base year and estimations extending to 2033. The report segments the market by device type, application, and end-user, providing granular data for informed decision-making.
US Energy-Based Aesthetic Devices Market Market Structure & Competitive Dynamics
The US energy-based aesthetic devices market is characterized by a moderately concentrated structure, with several key players holding significant market share. The market's competitive landscape is dynamic, driven by continuous innovation, strategic mergers and acquisitions (M&A), and evolving regulatory frameworks. Key players like Cynosure, Lumenis Inc, Bausch Health Companies Inc (Solta Medical Inc), Abbvie, El.En (Asclepion Laser Technologies), Alma Lasers, Venus Concept, Syneron Medical Ltd, Cutera Inc, and Sciton Inc compete fiercely, leveraging technological advancements and strategic partnerships to gain a competitive edge.
Market concentration is estimated at xx%, with the top five players accounting for approximately xx% of the total market revenue in 2025. Innovation ecosystems are thriving, with significant investments in R&D leading to the development of advanced energy-based devices. The regulatory framework, primarily overseen by the FDA, plays a crucial role in shaping market dynamics, ensuring device safety and efficacy. Product substitutes, such as non-invasive cosmetic procedures and surgical options, exert competitive pressure. End-user preferences are increasingly shifting towards minimally invasive, non-surgical options, driving demand for energy-based devices. M&A activity has been significant, with several high-value deals in recent years. For example, the xx acquisition of xx in 20xx for xx Million significantly reshaped the market landscape. Further M&A activity is expected, driven by the desire for market consolidation and expansion.
US Energy-Based Aesthetic Devices Market Industry Trends & Insights
The US energy-based aesthetic devices market is experiencing robust growth, driven by several key factors. The increasing prevalence of aesthetic concerns among consumers, coupled with rising disposable incomes and a growing awareness of non-invasive cosmetic procedures, are fueling market expansion. Technological advancements, such as the development of more sophisticated and efficient energy-based devices, are further driving market growth. Consumer preferences are shifting towards minimally invasive procedures with shorter recovery times and improved efficacy, creating a strong demand for innovative technologies.
The market is witnessing a significant shift towards personalized treatments, with devices offering customized solutions tailored to individual needs and preferences. This trend is driven by advancements in technology, allowing for precise targeting of specific areas and personalized treatment parameters. The market's competitive dynamics are intensifying, with companies constantly striving to differentiate their products through technological innovations, improved safety features, and cost-effective solutions. The compound annual growth rate (CAGR) for the market is projected to be xx% during the forecast period (2025-2033), indicating strong and consistent growth. Market penetration is expected to increase significantly, especially among younger demographics, reflecting the growing acceptance and adoption of non-invasive cosmetic procedures.
Dominant Markets & Segments in US Energy-Based Aesthetic Devices Market
The US energy-based aesthetic devices market is segmented by device type, application, and end-user. Currently, the energy-based aesthetic device segment dominates the market, driven by increasing adoption across various applications. Within applications, skin resurfacing and tightening holds a significant share, followed by body contouring and cellulite reduction.
Dominant Segment (Device Type): Energy-based aesthetic devices hold the largest market share, driven by their versatility and effectiveness across various applications.
Dominant Segment (Application): Skin resurfacing and tightening represents the most significant application segment, driven by increasing consumer demand for non-invasive solutions to address skin aging.
Dominant Segment (End-User): Clinics represent the largest end-user segment, reflecting the established presence and expertise in aesthetic procedures. However, the home-settings segment is anticipated to show strong growth in the coming years.
Key drivers contributing to the dominance of these segments include advancements in technology, rising consumer awareness, and increasing accessibility of non-invasive procedures. The favorable regulatory environment and supportive economic conditions also contribute to market expansion. Geographic dominance is largely concentrated in urban areas with higher disposable income and access to advanced medical facilities.
US Energy-Based Aesthetic Devices Market Product Innovations
Recent product innovations in the US energy-based aesthetic devices market are focused on enhancing treatment efficacy, minimizing downtime, and improving patient comfort. New devices are incorporating advanced technologies such as multi-wavelength lasers, radiofrequency energy, and ultrasound to offer more personalized and effective treatments. These innovations aim to cater to the growing demand for minimally invasive, non-surgical options with superior results and shorter recovery times. The market is also witnessing the development of more compact and portable devices, catering to the growing home-use segment. These innovations reflect the market's competitive dynamics, pushing companies to continuously develop and introduce superior products to stay ahead of the curve.
Report Segmentation & Scope
This report offers a comprehensive segmentation of the US energy-based aesthetic devices market, analyzed across several key parameters:
Type of Device: The market is categorized into Energy-based Aesthetic Devices (dominant segment projected to reach xx Million by 2033), Ultrasound Aesthetic Devices (non-energy-based), and Implants (Facial, Breast, and Others). Energy-based devices exhibit the highest growth, owing to their versatility and efficacy.
Application: This includes Skin Resurfacing and Tightening (xx Million by 2033), Body Contouring and Cellulite Reduction (xx Million by 2033), Hair Removal, Tattoo Removal, Breast Augmentation, and Other Applications. Skin resurfacing and tightening remain the dominant application.
End User: The market is divided into Hospitals, Clinics (largest segment), and Home Settings (demonstrating strong growth potential). Clinics currently represent the largest revenue generator, but the home setting is expected to gain significant traction.
Key Drivers of US Energy-Based Aesthetic Devices Market Growth
Several factors drive the growth of the US energy-based aesthetic devices market. Technological advancements, leading to more efficient and effective devices, are paramount. Rising disposable incomes allow consumers to afford these procedures. The growing awareness of non-invasive cosmetic procedures and a desire for enhanced appearance are key drivers. Finally, a supportive regulatory environment and increased availability of financing options facilitate market expansion.
Challenges in the US Energy-Based Aesthetic Devices Market Sector
The US energy-based aesthetic devices market faces challenges, including stringent regulatory approvals (potentially delaying product launches and increasing costs) and intense competition (requiring continuous innovation and cost optimization). Supply chain disruptions can impact device availability and pricing, affecting market growth. Furthermore, the high cost of treatments can limit accessibility for certain consumer segments.
Leading Players in the US Energy-Based Aesthetic Devices Market Market
- Cynosure
- Lumenis Inc
- Bausch Health Companies Inc (Solta Medical Inc)
- Abbvie
- El.En (Asclepion Laser Technologies)
- Alma Lasers
- Venus Concept
- Syneron Medical Ltd
- Cutera Inc
- Sciton Inc
Key Developments in US Energy-Based Aesthetic Devices Market Sector
- June 2023: Venus Concept launched a new device with enhanced features.
- March 2022: Syneron Medical Ltd announced a strategic partnership to expand its market reach.
- December 2021: FDA approval for a new energy-based device boosted market competition. (Further developments require specific data.)
Strategic US Energy-Based Aesthetic Devices Market Market Outlook
The US energy-based aesthetic devices market exhibits substantial future potential. Continued technological advancements, growing consumer awareness, and favorable regulatory environments will drive market expansion. Companies adopting strategic partnerships, investing in R&D, and focusing on personalized treatments are poised to capture significant market share. The expanding home-use segment represents a significant growth opportunity.
US Energy-Based Aesthetic Devices Market Segmentation
-
1. Type of Device
-
1.1. Energy-based Aesthetic Device
- 1.1.1. Laser-based Aesthetic Device
- 1.1.2. Radiofrequency (RF)-based Aesthetic Device
- 1.1.3. Light-based Aesthetic Device
- 1.1.4. Ultrasound Aesthetic Device
-
1.2. Non-energy-based Aesthetic Device
- 1.2.1. Botulinum Toxin
- 1.2.2. Dermal Fillers and Aesthetic Threads
- 1.2.3. Chemical Peels
- 1.2.4. Microdermabrasion
-
1.2.5. Implants
- 1.2.5.1. Facial Implants
- 1.2.5.2. Breast Implants
- 1.2.5.3. Other Implants
- 1.2.6. Other Aesthetic Devices
-
1.1. Energy-based Aesthetic Device
-
2. Application
- 2.1. Skin Resurfacing and Tightening
- 2.2. Body Contouring and Cellulite Reduction
- 2.3. Hair Removal
- 2.4. Tattoo Removal
- 2.5. Breast Augmentation
- 2.6. Other Applications
-
3. End User
- 3.1. Hospital
- 3.2. Clinics
- 3.3. Home Settings
US Energy-Based Aesthetic Devices Market Segmentation By Geography
-
1. North America
- 1.1. United States
- 1.2. Canada
- 1.3. Mexico
-
2. South America
- 2.1. Brazil
- 2.2. Argentina
- 2.3. Rest of South America
-
3. Europe
- 3.1. United Kingdom
- 3.2. Germany
- 3.3. France
- 3.4. Italy
- 3.5. Spain
- 3.6. Russia
- 3.7. Benelux
- 3.8. Nordics
- 3.9. Rest of Europe
-
4. Middle East & Africa
- 4.1. Turkey
- 4.2. Israel
- 4.3. GCC
- 4.4. North Africa
- 4.5. South Africa
- 4.6. Rest of Middle East & Africa
-
5. Asia Pacific
- 5.1. China
- 5.2. India
- 5.3. Japan
- 5.4. South Korea
- 5.5. ASEAN
- 5.6. Oceania
- 5.7. Rest of Asia Pacific
US Energy-Based Aesthetic Devices Market REPORT HIGHLIGHTS
| Aspects | Details |
|---|---|
| Study Period | 2019-2033 |
| Base Year | 2024 |
| Estimated Year | 2025 |
| Forecast Period | 2025-2033 |
| Historical Period | 2019-2024 |
| Growth Rate | CAGR of 9.79% from 2019-2033 |
| Segmentation |
|
Table of Contents
- 1. Introduction
- 1.1. Research Scope
- 1.2. Market Segmentation
- 1.3. Research Methodology
- 1.4. Definitions and Assumptions
- 2. Executive Summary
- 2.1. Introduction
- 3. Market Dynamics
- 3.1. Introduction
- 3.2. Market Drivers
- 3.2.1. Increasing Obese Population; Increasing Awareness Regarding Aesthetic Procedures and Rising Adoption of Minimally Invasive Devices; Technological Advancement in Devices
- 3.3. Market Restrains
- 3.3.1. Social Stigma Concerns; Poor Reimbursement Scenario
- 3.4. Market Trends
- 3.4.1. The Breast Implants Sub-segment is Expected to Show Rapid Grow in the Implants Segment of the Market
- 4. Market Factor Analysis
- 4.1. Porters Five Forces
- 4.2. Supply/Value Chain
- 4.3. PESTEL analysis
- 4.4. Market Entropy
- 4.5. Patent/Trademark Analysis
- 5. Global US Energy-Based Aesthetic Devices Market Analysis, Insights and Forecast, 2019-2031
- 5.1. Market Analysis, Insights and Forecast - by Type of Device
- 5.1.1. Energy-based Aesthetic Device
- 5.1.1.1. Laser-based Aesthetic Device
- 5.1.1.2. Radiofrequency (RF)-based Aesthetic Device
- 5.1.1.3. Light-based Aesthetic Device
- 5.1.1.4. Ultrasound Aesthetic Device
- 5.1.2. Non-energy-based Aesthetic Device
- 5.1.2.1. Botulinum Toxin
- 5.1.2.2. Dermal Fillers and Aesthetic Threads
- 5.1.2.3. Chemical Peels
- 5.1.2.4. Microdermabrasion
- 5.1.2.5. Implants
- 5.1.2.5.1. Facial Implants
- 5.1.2.5.2. Breast Implants
- 5.1.2.5.3. Other Implants
- 5.1.2.6. Other Aesthetic Devices
- 5.1.1. Energy-based Aesthetic Device
- 5.2. Market Analysis, Insights and Forecast - by Application
- 5.2.1. Skin Resurfacing and Tightening
- 5.2.2. Body Contouring and Cellulite Reduction
- 5.2.3. Hair Removal
- 5.2.4. Tattoo Removal
- 5.2.5. Breast Augmentation
- 5.2.6. Other Applications
- 5.3. Market Analysis, Insights and Forecast - by End User
- 5.3.1. Hospital
- 5.3.2. Clinics
- 5.3.3. Home Settings
- 5.4. Market Analysis, Insights and Forecast - by Region
- 5.4.1. North America
- 5.4.2. South America
- 5.4.3. Europe
- 5.4.4. Middle East & Africa
- 5.4.5. Asia Pacific
- 5.1. Market Analysis, Insights and Forecast - by Type of Device
- 6. North America US Energy-Based Aesthetic Devices Market Analysis, Insights and Forecast, 2019-2031
- 6.1. Market Analysis, Insights and Forecast - by Type of Device
- 6.1.1. Energy-based Aesthetic Device
- 6.1.1.1. Laser-based Aesthetic Device
- 6.1.1.2. Radiofrequency (RF)-based Aesthetic Device
- 6.1.1.3. Light-based Aesthetic Device
- 6.1.1.4. Ultrasound Aesthetic Device
- 6.1.2. Non-energy-based Aesthetic Device
- 6.1.2.1. Botulinum Toxin
- 6.1.2.2. Dermal Fillers and Aesthetic Threads
- 6.1.2.3. Chemical Peels
- 6.1.2.4. Microdermabrasion
- 6.1.2.5. Implants
- 6.1.2.5.1. Facial Implants
- 6.1.2.5.2. Breast Implants
- 6.1.2.5.3. Other Implants
- 6.1.2.6. Other Aesthetic Devices
- 6.1.1. Energy-based Aesthetic Device
- 6.2. Market Analysis, Insights and Forecast - by Application
- 6.2.1. Skin Resurfacing and Tightening
- 6.2.2. Body Contouring and Cellulite Reduction
- 6.2.3. Hair Removal
- 6.2.4. Tattoo Removal
- 6.2.5. Breast Augmentation
- 6.2.6. Other Applications
- 6.3. Market Analysis, Insights and Forecast - by End User
- 6.3.1. Hospital
- 6.3.2. Clinics
- 6.3.3. Home Settings
- 6.1. Market Analysis, Insights and Forecast - by Type of Device
- 7. South America US Energy-Based Aesthetic Devices Market Analysis, Insights and Forecast, 2019-2031
- 7.1. Market Analysis, Insights and Forecast - by Type of Device
- 7.1.1. Energy-based Aesthetic Device
- 7.1.1.1. Laser-based Aesthetic Device
- 7.1.1.2. Radiofrequency (RF)-based Aesthetic Device
- 7.1.1.3. Light-based Aesthetic Device
- 7.1.1.4. Ultrasound Aesthetic Device
- 7.1.2. Non-energy-based Aesthetic Device
- 7.1.2.1. Botulinum Toxin
- 7.1.2.2. Dermal Fillers and Aesthetic Threads
- 7.1.2.3. Chemical Peels
- 7.1.2.4. Microdermabrasion
- 7.1.2.5. Implants
- 7.1.2.5.1. Facial Implants
- 7.1.2.5.2. Breast Implants
- 7.1.2.5.3. Other Implants
- 7.1.2.6. Other Aesthetic Devices
- 7.1.1. Energy-based Aesthetic Device
- 7.2. Market Analysis, Insights and Forecast - by Application
- 7.2.1. Skin Resurfacing and Tightening
- 7.2.2. Body Contouring and Cellulite Reduction
- 7.2.3. Hair Removal
- 7.2.4. Tattoo Removal
- 7.2.5. Breast Augmentation
- 7.2.6. Other Applications
- 7.3. Market Analysis, Insights and Forecast - by End User
- 7.3.1. Hospital
- 7.3.2. Clinics
- 7.3.3. Home Settings
- 7.1. Market Analysis, Insights and Forecast - by Type of Device
- 8. Europe US Energy-Based Aesthetic Devices Market Analysis, Insights and Forecast, 2019-2031
- 8.1. Market Analysis, Insights and Forecast - by Type of Device
- 8.1.1. Energy-based Aesthetic Device
- 8.1.1.1. Laser-based Aesthetic Device
- 8.1.1.2. Radiofrequency (RF)-based Aesthetic Device
- 8.1.1.3. Light-based Aesthetic Device
- 8.1.1.4. Ultrasound Aesthetic Device
- 8.1.2. Non-energy-based Aesthetic Device
- 8.1.2.1. Botulinum Toxin
- 8.1.2.2. Dermal Fillers and Aesthetic Threads
- 8.1.2.3. Chemical Peels
- 8.1.2.4. Microdermabrasion
- 8.1.2.5. Implants
- 8.1.2.5.1. Facial Implants
- 8.1.2.5.2. Breast Implants
- 8.1.2.5.3. Other Implants
- 8.1.2.6. Other Aesthetic Devices
- 8.1.1. Energy-based Aesthetic Device
- 8.2. Market Analysis, Insights and Forecast - by Application
- 8.2.1. Skin Resurfacing and Tightening
- 8.2.2. Body Contouring and Cellulite Reduction
- 8.2.3. Hair Removal
- 8.2.4. Tattoo Removal
- 8.2.5. Breast Augmentation
- 8.2.6. Other Applications
- 8.3. Market Analysis, Insights and Forecast - by End User
- 8.3.1. Hospital
- 8.3.2. Clinics
- 8.3.3. Home Settings
- 8.1. Market Analysis, Insights and Forecast - by Type of Device
- 9. Middle East & Africa US Energy-Based Aesthetic Devices Market Analysis, Insights and Forecast, 2019-2031
- 9.1. Market Analysis, Insights and Forecast - by Type of Device
- 9.1.1. Energy-based Aesthetic Device
- 9.1.1.1. Laser-based Aesthetic Device
- 9.1.1.2. Radiofrequency (RF)-based Aesthetic Device
- 9.1.1.3. Light-based Aesthetic Device
- 9.1.1.4. Ultrasound Aesthetic Device
- 9.1.2. Non-energy-based Aesthetic Device
- 9.1.2.1. Botulinum Toxin
- 9.1.2.2. Dermal Fillers and Aesthetic Threads
- 9.1.2.3. Chemical Peels
- 9.1.2.4. Microdermabrasion
- 9.1.2.5. Implants
- 9.1.2.5.1. Facial Implants
- 9.1.2.5.2. Breast Implants
- 9.1.2.5.3. Other Implants
- 9.1.2.6. Other Aesthetic Devices
- 9.1.1. Energy-based Aesthetic Device
- 9.2. Market Analysis, Insights and Forecast - by Application
- 9.2.1. Skin Resurfacing and Tightening
- 9.2.2. Body Contouring and Cellulite Reduction
- 9.2.3. Hair Removal
- 9.2.4. Tattoo Removal
- 9.2.5. Breast Augmentation
- 9.2.6. Other Applications
- 9.3. Market Analysis, Insights and Forecast - by End User
- 9.3.1. Hospital
- 9.3.2. Clinics
- 9.3.3. Home Settings
- 9.1. Market Analysis, Insights and Forecast - by Type of Device
- 10. Asia Pacific US Energy-Based Aesthetic Devices Market Analysis, Insights and Forecast, 2019-2031
- 10.1. Market Analysis, Insights and Forecast - by Type of Device
- 10.1.1. Energy-based Aesthetic Device
- 10.1.1.1. Laser-based Aesthetic Device
- 10.1.1.2. Radiofrequency (RF)-based Aesthetic Device
- 10.1.1.3. Light-based Aesthetic Device
- 10.1.1.4. Ultrasound Aesthetic Device
- 10.1.2. Non-energy-based Aesthetic Device
- 10.1.2.1. Botulinum Toxin
- 10.1.2.2. Dermal Fillers and Aesthetic Threads
- 10.1.2.3. Chemical Peels
- 10.1.2.4. Microdermabrasion
- 10.1.2.5. Implants
- 10.1.2.5.1. Facial Implants
- 10.1.2.5.2. Breast Implants
- 10.1.2.5.3. Other Implants
- 10.1.2.6. Other Aesthetic Devices
- 10.1.1. Energy-based Aesthetic Device
- 10.2. Market Analysis, Insights and Forecast - by Application
- 10.2.1. Skin Resurfacing and Tightening
- 10.2.2. Body Contouring and Cellulite Reduction
- 10.2.3. Hair Removal
- 10.2.4. Tattoo Removal
- 10.2.5. Breast Augmentation
- 10.2.6. Other Applications
- 10.3. Market Analysis, Insights and Forecast - by End User
- 10.3.1. Hospital
- 10.3.2. Clinics
- 10.3.3. Home Settings
- 10.1. Market Analysis, Insights and Forecast - by Type of Device
- 11. Northeast US Energy-Based Aesthetic Devices Market Analysis, Insights and Forecast, 2019-2031
- 12. Southeast US Energy-Based Aesthetic Devices Market Analysis, Insights and Forecast, 2019-2031
- 13. Midwest US Energy-Based Aesthetic Devices Market Analysis, Insights and Forecast, 2019-2031
- 14. Southwest US Energy-Based Aesthetic Devices Market Analysis, Insights and Forecast, 2019-2031
- 15. West US Energy-Based Aesthetic Devices Market Analysis, Insights and Forecast, 2019-2031
- 16. Competitive Analysis
- 16.1. Global Market Share Analysis 2024
- 16.2. Company Profiles
- 16.2.1 Cynosure
- 16.2.1.1. Overview
- 16.2.1.2. Products
- 16.2.1.3. SWOT Analysis
- 16.2.1.4. Recent Developments
- 16.2.1.5. Financials (Based on Availability)
- 16.2.2 Lumenis Inc
- 16.2.2.1. Overview
- 16.2.2.2. Products
- 16.2.2.3. SWOT Analysis
- 16.2.2.4. Recent Developments
- 16.2.2.5. Financials (Based on Availability)
- 16.2.3 Bausch Health Companies Inc (Solta Medical Inc )
- 16.2.3.1. Overview
- 16.2.3.2. Products
- 16.2.3.3. SWOT Analysis
- 16.2.3.4. Recent Developments
- 16.2.3.5. Financials (Based on Availability)
- 16.2.4 Abbvie
- 16.2.4.1. Overview
- 16.2.4.2. Products
- 16.2.4.3. SWOT Analysis
- 16.2.4.4. Recent Developments
- 16.2.4.5. Financials (Based on Availability)
- 16.2.5 El en (Asclepion Laser Technologies)
- 16.2.5.1. Overview
- 16.2.5.2. Products
- 16.2.5.3. SWOT Analysis
- 16.2.5.4. Recent Developments
- 16.2.5.5. Financials (Based on Availability)
- 16.2.6 Alma Lasers
- 16.2.6.1. Overview
- 16.2.6.2. Products
- 16.2.6.3. SWOT Analysis
- 16.2.6.4. Recent Developments
- 16.2.6.5. Financials (Based on Availability)
- 16.2.7 Venus Concept
- 16.2.7.1. Overview
- 16.2.7.2. Products
- 16.2.7.3. SWOT Analysis
- 16.2.7.4. Recent Developments
- 16.2.7.5. Financials (Based on Availability)
- 16.2.8 Syneron Medical Ltd
- 16.2.8.1. Overview
- 16.2.8.2. Products
- 16.2.8.3. SWOT Analysis
- 16.2.8.4. Recent Developments
- 16.2.8.5. Financials (Based on Availability)
- 16.2.9 Cutera Inc
- 16.2.9.1. Overview
- 16.2.9.2. Products
- 16.2.9.3. SWOT Analysis
- 16.2.9.4. Recent Developments
- 16.2.9.5. Financials (Based on Availability)
- 16.2.10 Sciton Inc
- 16.2.10.1. Overview
- 16.2.10.2. Products
- 16.2.10.3. SWOT Analysis
- 16.2.10.4. Recent Developments
- 16.2.10.5. Financials (Based on Availability)
- 16.2.1 Cynosure
List of Figures
- Figure 1: Global US Energy-Based Aesthetic Devices Market Revenue Breakdown (Million, %) by Region 2024 & 2032
- Figure 2: Global US Energy-Based Aesthetic Devices Market Volume Breakdown (K Unit, %) by Region 2024 & 2032
- Figure 3: United states US Energy-Based Aesthetic Devices Market Revenue (Million), by Country 2024 & 2032
- Figure 4: United states US Energy-Based Aesthetic Devices Market Volume (K Unit), by Country 2024 & 2032
- Figure 5: United states US Energy-Based Aesthetic Devices Market Revenue Share (%), by Country 2024 & 2032
- Figure 6: United states US Energy-Based Aesthetic Devices Market Volume Share (%), by Country 2024 & 2032
- Figure 7: North America US Energy-Based Aesthetic Devices Market Revenue (Million), by Type of Device 2024 & 2032
- Figure 8: North America US Energy-Based Aesthetic Devices Market Volume (K Unit), by Type of Device 2024 & 2032
- Figure 9: North America US Energy-Based Aesthetic Devices Market Revenue Share (%), by Type of Device 2024 & 2032
- Figure 10: North America US Energy-Based Aesthetic Devices Market Volume Share (%), by Type of Device 2024 & 2032
- Figure 11: North America US Energy-Based Aesthetic Devices Market Revenue (Million), by Application 2024 & 2032
- Figure 12: North America US Energy-Based Aesthetic Devices Market Volume (K Unit), by Application 2024 & 2032
- Figure 13: North America US Energy-Based Aesthetic Devices Market Revenue Share (%), by Application 2024 & 2032
- Figure 14: North America US Energy-Based Aesthetic Devices Market Volume Share (%), by Application 2024 & 2032
- Figure 15: North America US Energy-Based Aesthetic Devices Market Revenue (Million), by End User 2024 & 2032
- Figure 16: North America US Energy-Based Aesthetic Devices Market Volume (K Unit), by End User 2024 & 2032
- Figure 17: North America US Energy-Based Aesthetic Devices Market Revenue Share (%), by End User 2024 & 2032
- Figure 18: North America US Energy-Based Aesthetic Devices Market Volume Share (%), by End User 2024 & 2032
- Figure 19: North America US Energy-Based Aesthetic Devices Market Revenue (Million), by Country 2024 & 2032
- Figure 20: North America US Energy-Based Aesthetic Devices Market Volume (K Unit), by Country 2024 & 2032
- Figure 21: North America US Energy-Based Aesthetic Devices Market Revenue Share (%), by Country 2024 & 2032
- Figure 22: North America US Energy-Based Aesthetic Devices Market Volume Share (%), by Country 2024 & 2032
- Figure 23: South America US Energy-Based Aesthetic Devices Market Revenue (Million), by Type of Device 2024 & 2032
- Figure 24: South America US Energy-Based Aesthetic Devices Market Volume (K Unit), by Type of Device 2024 & 2032
- Figure 25: South America US Energy-Based Aesthetic Devices Market Revenue Share (%), by Type of Device 2024 & 2032
- Figure 26: South America US Energy-Based Aesthetic Devices Market Volume Share (%), by Type of Device 2024 & 2032
- Figure 27: South America US Energy-Based Aesthetic Devices Market Revenue (Million), by Application 2024 & 2032
- Figure 28: South America US Energy-Based Aesthetic Devices Market Volume (K Unit), by Application 2024 & 2032
- Figure 29: South America US Energy-Based Aesthetic Devices Market Revenue Share (%), by Application 2024 & 2032
- Figure 30: South America US Energy-Based Aesthetic Devices Market Volume Share (%), by Application 2024 & 2032
- Figure 31: South America US Energy-Based Aesthetic Devices Market Revenue (Million), by End User 2024 & 2032
- Figure 32: South America US Energy-Based Aesthetic Devices Market Volume (K Unit), by End User 2024 & 2032
- Figure 33: South America US Energy-Based Aesthetic Devices Market Revenue Share (%), by End User 2024 & 2032
- Figure 34: South America US Energy-Based Aesthetic Devices Market Volume Share (%), by End User 2024 & 2032
- Figure 35: South America US Energy-Based Aesthetic Devices Market Revenue (Million), by Country 2024 & 2032
- Figure 36: South America US Energy-Based Aesthetic Devices Market Volume (K Unit), by Country 2024 & 2032
- Figure 37: South America US Energy-Based Aesthetic Devices Market Revenue Share (%), by Country 2024 & 2032
- Figure 38: South America US Energy-Based Aesthetic Devices Market Volume Share (%), by Country 2024 & 2032
- Figure 39: Europe US Energy-Based Aesthetic Devices Market Revenue (Million), by Type of Device 2024 & 2032
- Figure 40: Europe US Energy-Based Aesthetic Devices Market Volume (K Unit), by Type of Device 2024 & 2032
- Figure 41: Europe US Energy-Based Aesthetic Devices Market Revenue Share (%), by Type of Device 2024 & 2032
- Figure 42: Europe US Energy-Based Aesthetic Devices Market Volume Share (%), by Type of Device 2024 & 2032
- Figure 43: Europe US Energy-Based Aesthetic Devices Market Revenue (Million), by Application 2024 & 2032
- Figure 44: Europe US Energy-Based Aesthetic Devices Market Volume (K Unit), by Application 2024 & 2032
- Figure 45: Europe US Energy-Based Aesthetic Devices Market Revenue Share (%), by Application 2024 & 2032
- Figure 46: Europe US Energy-Based Aesthetic Devices Market Volume Share (%), by Application 2024 & 2032
- Figure 47: Europe US Energy-Based Aesthetic Devices Market Revenue (Million), by End User 2024 & 2032
- Figure 48: Europe US Energy-Based Aesthetic Devices Market Volume (K Unit), by End User 2024 & 2032
- Figure 49: Europe US Energy-Based Aesthetic Devices Market Revenue Share (%), by End User 2024 & 2032
- Figure 50: Europe US Energy-Based Aesthetic Devices Market Volume Share (%), by End User 2024 & 2032
- Figure 51: Europe US Energy-Based Aesthetic Devices Market Revenue (Million), by Country 2024 & 2032
- Figure 52: Europe US Energy-Based Aesthetic Devices Market Volume (K Unit), by Country 2024 & 2032
- Figure 53: Europe US Energy-Based Aesthetic Devices Market Revenue Share (%), by Country 2024 & 2032
- Figure 54: Europe US Energy-Based Aesthetic Devices Market Volume Share (%), by Country 2024 & 2032
- Figure 55: Middle East & Africa US Energy-Based Aesthetic Devices Market Revenue (Million), by Type of Device 2024 & 2032
- Figure 56: Middle East & Africa US Energy-Based Aesthetic Devices Market Volume (K Unit), by Type of Device 2024 & 2032
- Figure 57: Middle East & Africa US Energy-Based Aesthetic Devices Market Revenue Share (%), by Type of Device 2024 & 2032
- Figure 58: Middle East & Africa US Energy-Based Aesthetic Devices Market Volume Share (%), by Type of Device 2024 & 2032
- Figure 59: Middle East & Africa US Energy-Based Aesthetic Devices Market Revenue (Million), by Application 2024 & 2032
- Figure 60: Middle East & Africa US Energy-Based Aesthetic Devices Market Volume (K Unit), by Application 2024 & 2032
- Figure 61: Middle East & Africa US Energy-Based Aesthetic Devices Market Revenue Share (%), by Application 2024 & 2032
- Figure 62: Middle East & Africa US Energy-Based Aesthetic Devices Market Volume Share (%), by Application 2024 & 2032
- Figure 63: Middle East & Africa US Energy-Based Aesthetic Devices Market Revenue (Million), by End User 2024 & 2032
- Figure 64: Middle East & Africa US Energy-Based Aesthetic Devices Market Volume (K Unit), by End User 2024 & 2032
- Figure 65: Middle East & Africa US Energy-Based Aesthetic Devices Market Revenue Share (%), by End User 2024 & 2032
- Figure 66: Middle East & Africa US Energy-Based Aesthetic Devices Market Volume Share (%), by End User 2024 & 2032
- Figure 67: Middle East & Africa US Energy-Based Aesthetic Devices Market Revenue (Million), by Country 2024 & 2032
- Figure 68: Middle East & Africa US Energy-Based Aesthetic Devices Market Volume (K Unit), by Country 2024 & 2032
- Figure 69: Middle East & Africa US Energy-Based Aesthetic Devices Market Revenue Share (%), by Country 2024 & 2032
- Figure 70: Middle East & Africa US Energy-Based Aesthetic Devices Market Volume Share (%), by Country 2024 & 2032
- Figure 71: Asia Pacific US Energy-Based Aesthetic Devices Market Revenue (Million), by Type of Device 2024 & 2032
- Figure 72: Asia Pacific US Energy-Based Aesthetic Devices Market Volume (K Unit), by Type of Device 2024 & 2032
- Figure 73: Asia Pacific US Energy-Based Aesthetic Devices Market Revenue Share (%), by Type of Device 2024 & 2032
- Figure 74: Asia Pacific US Energy-Based Aesthetic Devices Market Volume Share (%), by Type of Device 2024 & 2032
- Figure 75: Asia Pacific US Energy-Based Aesthetic Devices Market Revenue (Million), by Application 2024 & 2032
- Figure 76: Asia Pacific US Energy-Based Aesthetic Devices Market Volume (K Unit), by Application 2024 & 2032
- Figure 77: Asia Pacific US Energy-Based Aesthetic Devices Market Revenue Share (%), by Application 2024 & 2032
- Figure 78: Asia Pacific US Energy-Based Aesthetic Devices Market Volume Share (%), by Application 2024 & 2032
- Figure 79: Asia Pacific US Energy-Based Aesthetic Devices Market Revenue (Million), by End User 2024 & 2032
- Figure 80: Asia Pacific US Energy-Based Aesthetic Devices Market Volume (K Unit), by End User 2024 & 2032
- Figure 81: Asia Pacific US Energy-Based Aesthetic Devices Market Revenue Share (%), by End User 2024 & 2032
- Figure 82: Asia Pacific US Energy-Based Aesthetic Devices Market Volume Share (%), by End User 2024 & 2032
- Figure 83: Asia Pacific US Energy-Based Aesthetic Devices Market Revenue (Million), by Country 2024 & 2032
- Figure 84: Asia Pacific US Energy-Based Aesthetic Devices Market Volume (K Unit), by Country 2024 & 2032
- Figure 85: Asia Pacific US Energy-Based Aesthetic Devices Market Revenue Share (%), by Country 2024 & 2032
- Figure 86: Asia Pacific US Energy-Based Aesthetic Devices Market Volume Share (%), by Country 2024 & 2032
List of Tables
- Table 1: Global US Energy-Based Aesthetic Devices Market Revenue Million Forecast, by Region 2019 & 2032
- Table 2: Global US Energy-Based Aesthetic Devices Market Volume K Unit Forecast, by Region 2019 & 2032
- Table 3: Global US Energy-Based Aesthetic Devices Market Revenue Million Forecast, by Type of Device 2019 & 2032
- Table 4: Global US Energy-Based Aesthetic Devices Market Volume K Unit Forecast, by Type of Device 2019 & 2032
- Table 5: Global US Energy-Based Aesthetic Devices Market Revenue Million Forecast, by Application 2019 & 2032
- Table 6: Global US Energy-Based Aesthetic Devices Market Volume K Unit Forecast, by Application 2019 & 2032
- Table 7: Global US Energy-Based Aesthetic Devices Market Revenue Million Forecast, by End User 2019 & 2032
- Table 8: Global US Energy-Based Aesthetic Devices Market Volume K Unit Forecast, by End User 2019 & 2032
- Table 9: Global US Energy-Based Aesthetic Devices Market Revenue Million Forecast, by Region 2019 & 2032
- Table 10: Global US Energy-Based Aesthetic Devices Market Volume K Unit Forecast, by Region 2019 & 2032
- Table 11: Global US Energy-Based Aesthetic Devices Market Revenue Million Forecast, by Country 2019 & 2032
- Table 12: Global US Energy-Based Aesthetic Devices Market Volume K Unit Forecast, by Country 2019 & 2032
- Table 13: Northeast US Energy-Based Aesthetic Devices Market Revenue (Million) Forecast, by Application 2019 & 2032
- Table 14: Northeast US Energy-Based Aesthetic Devices Market Volume (K Unit) Forecast, by Application 2019 & 2032
- Table 15: Southeast US Energy-Based Aesthetic Devices Market Revenue (Million) Forecast, by Application 2019 & 2032
- Table 16: Southeast US Energy-Based Aesthetic Devices Market Volume (K Unit) Forecast, by Application 2019 & 2032
- Table 17: Midwest US Energy-Based Aesthetic Devices Market Revenue (Million) Forecast, by Application 2019 & 2032
- Table 18: Midwest US Energy-Based Aesthetic Devices Market Volume (K Unit) Forecast, by Application 2019 & 2032
- Table 19: Southwest US Energy-Based Aesthetic Devices Market Revenue (Million) Forecast, by Application 2019 & 2032
- Table 20: Southwest US Energy-Based Aesthetic Devices Market Volume (K Unit) Forecast, by Application 2019 & 2032
- Table 21: West US Energy-Based Aesthetic Devices Market Revenue (Million) Forecast, by Application 2019 & 2032
- Table 22: West US Energy-Based Aesthetic Devices Market Volume (K Unit) Forecast, by Application 2019 & 2032
- Table 23: Global US Energy-Based Aesthetic Devices Market Revenue Million Forecast, by Type of Device 2019 & 2032
- Table 24: Global US Energy-Based Aesthetic Devices Market Volume K Unit Forecast, by Type of Device 2019 & 2032
- Table 25: Global US Energy-Based Aesthetic Devices Market Revenue Million Forecast, by Application 2019 & 2032
- Table 26: Global US Energy-Based Aesthetic Devices Market Volume K Unit Forecast, by Application 2019 & 2032
- Table 27: Global US Energy-Based Aesthetic Devices Market Revenue Million Forecast, by End User 2019 & 2032
- Table 28: Global US Energy-Based Aesthetic Devices Market Volume K Unit Forecast, by End User 2019 & 2032
- Table 29: Global US Energy-Based Aesthetic Devices Market Revenue Million Forecast, by Country 2019 & 2032
- Table 30: Global US Energy-Based Aesthetic Devices Market Volume K Unit Forecast, by Country 2019 & 2032
- Table 31: United States US Energy-Based Aesthetic Devices Market Revenue (Million) Forecast, by Application 2019 & 2032
- Table 32: United States US Energy-Based Aesthetic Devices Market Volume (K Unit) Forecast, by Application 2019 & 2032
- Table 33: Canada US Energy-Based Aesthetic Devices Market Revenue (Million) Forecast, by Application 2019 & 2032
- Table 34: Canada US Energy-Based Aesthetic Devices Market Volume (K Unit) Forecast, by Application 2019 & 2032
- Table 35: Mexico US Energy-Based Aesthetic Devices Market Revenue (Million) Forecast, by Application 2019 & 2032
- Table 36: Mexico US Energy-Based Aesthetic Devices Market Volume (K Unit) Forecast, by Application 2019 & 2032
- Table 37: Global US Energy-Based Aesthetic Devices Market Revenue Million Forecast, by Type of Device 2019 & 2032
- Table 38: Global US Energy-Based Aesthetic Devices Market Volume K Unit Forecast, by Type of Device 2019 & 2032
- Table 39: Global US Energy-Based Aesthetic Devices Market Revenue Million Forecast, by Application 2019 & 2032
- Table 40: Global US Energy-Based Aesthetic Devices Market Volume K Unit Forecast, by Application 2019 & 2032
- Table 41: Global US Energy-Based Aesthetic Devices Market Revenue Million Forecast, by End User 2019 & 2032
- Table 42: Global US Energy-Based Aesthetic Devices Market Volume K Unit Forecast, by End User 2019 & 2032
- Table 43: Global US Energy-Based Aesthetic Devices Market Revenue Million Forecast, by Country 2019 & 2032
- Table 44: Global US Energy-Based Aesthetic Devices Market Volume K Unit Forecast, by Country 2019 & 2032
- Table 45: Brazil US Energy-Based Aesthetic Devices Market Revenue (Million) Forecast, by Application 2019 & 2032
- Table 46: Brazil US Energy-Based Aesthetic Devices Market Volume (K Unit) Forecast, by Application 2019 & 2032
- Table 47: Argentina US Energy-Based Aesthetic Devices Market Revenue (Million) Forecast, by Application 2019 & 2032
- Table 48: Argentina US Energy-Based Aesthetic Devices Market Volume (K Unit) Forecast, by Application 2019 & 2032
- Table 49: Rest of South America US Energy-Based Aesthetic Devices Market Revenue (Million) Forecast, by Application 2019 & 2032
- Table 50: Rest of South America US Energy-Based Aesthetic Devices Market Volume (K Unit) Forecast, by Application 2019 & 2032
- Table 51: Global US Energy-Based Aesthetic Devices Market Revenue Million Forecast, by Type of Device 2019 & 2032
- Table 52: Global US Energy-Based Aesthetic Devices Market Volume K Unit Forecast, by Type of Device 2019 & 2032
- Table 53: Global US Energy-Based Aesthetic Devices Market Revenue Million Forecast, by Application 2019 & 2032
- Table 54: Global US Energy-Based Aesthetic Devices Market Volume K Unit Forecast, by Application 2019 & 2032
- Table 55: Global US Energy-Based Aesthetic Devices Market Revenue Million Forecast, by End User 2019 & 2032
- Table 56: Global US Energy-Based Aesthetic Devices Market Volume K Unit Forecast, by End User 2019 & 2032
- Table 57: Global US Energy-Based Aesthetic Devices Market Revenue Million Forecast, by Country 2019 & 2032
- Table 58: Global US Energy-Based Aesthetic Devices Market Volume K Unit Forecast, by Country 2019 & 2032
- Table 59: United Kingdom US Energy-Based Aesthetic Devices Market Revenue (Million) Forecast, by Application 2019 & 2032
- Table 60: United Kingdom US Energy-Based Aesthetic Devices Market Volume (K Unit) Forecast, by Application 2019 & 2032
- Table 61: Germany US Energy-Based Aesthetic Devices Market Revenue (Million) Forecast, by Application 2019 & 2032
- Table 62: Germany US Energy-Based Aesthetic Devices Market Volume (K Unit) Forecast, by Application 2019 & 2032
- Table 63: France US Energy-Based Aesthetic Devices Market Revenue (Million) Forecast, by Application 2019 & 2032
- Table 64: France US Energy-Based Aesthetic Devices Market Volume (K Unit) Forecast, by Application 2019 & 2032
- Table 65: Italy US Energy-Based Aesthetic Devices Market Revenue (Million) Forecast, by Application 2019 & 2032
- Table 66: Italy US Energy-Based Aesthetic Devices Market Volume (K Unit) Forecast, by Application 2019 & 2032
- Table 67: Spain US Energy-Based Aesthetic Devices Market Revenue (Million) Forecast, by Application 2019 & 2032
- Table 68: Spain US Energy-Based Aesthetic Devices Market Volume (K Unit) Forecast, by Application 2019 & 2032
- Table 69: Russia US Energy-Based Aesthetic Devices Market Revenue (Million) Forecast, by Application 2019 & 2032
- Table 70: Russia US Energy-Based Aesthetic Devices Market Volume (K Unit) Forecast, by Application 2019 & 2032
- Table 71: Benelux US Energy-Based Aesthetic Devices Market Revenue (Million) Forecast, by Application 2019 & 2032
- Table 72: Benelux US Energy-Based Aesthetic Devices Market Volume (K Unit) Forecast, by Application 2019 & 2032
- Table 73: Nordics US Energy-Based Aesthetic Devices Market Revenue (Million) Forecast, by Application 2019 & 2032
- Table 74: Nordics US Energy-Based Aesthetic Devices Market Volume (K Unit) Forecast, by Application 2019 & 2032
- Table 75: Rest of Europe US Energy-Based Aesthetic Devices Market Revenue (Million) Forecast, by Application 2019 & 2032
- Table 76: Rest of Europe US Energy-Based Aesthetic Devices Market Volume (K Unit) Forecast, by Application 2019 & 2032
- Table 77: Global US Energy-Based Aesthetic Devices Market Revenue Million Forecast, by Type of Device 2019 & 2032
- Table 78: Global US Energy-Based Aesthetic Devices Market Volume K Unit Forecast, by Type of Device 2019 & 2032
- Table 79: Global US Energy-Based Aesthetic Devices Market Revenue Million Forecast, by Application 2019 & 2032
- Table 80: Global US Energy-Based Aesthetic Devices Market Volume K Unit Forecast, by Application 2019 & 2032
- Table 81: Global US Energy-Based Aesthetic Devices Market Revenue Million Forecast, by End User 2019 & 2032
- Table 82: Global US Energy-Based Aesthetic Devices Market Volume K Unit Forecast, by End User 2019 & 2032
- Table 83: Global US Energy-Based Aesthetic Devices Market Revenue Million Forecast, by Country 2019 & 2032
- Table 84: Global US Energy-Based Aesthetic Devices Market Volume K Unit Forecast, by Country 2019 & 2032
- Table 85: Turkey US Energy-Based Aesthetic Devices Market Revenue (Million) Forecast, by Application 2019 & 2032
- Table 86: Turkey US Energy-Based Aesthetic Devices Market Volume (K Unit) Forecast, by Application 2019 & 2032
- Table 87: Israel US Energy-Based Aesthetic Devices Market Revenue (Million) Forecast, by Application 2019 & 2032
- Table 88: Israel US Energy-Based Aesthetic Devices Market Volume (K Unit) Forecast, by Application 2019 & 2032
- Table 89: GCC US Energy-Based Aesthetic Devices Market Revenue (Million) Forecast, by Application 2019 & 2032
- Table 90: GCC US Energy-Based Aesthetic Devices Market Volume (K Unit) Forecast, by Application 2019 & 2032
- Table 91: North Africa US Energy-Based Aesthetic Devices Market Revenue (Million) Forecast, by Application 2019 & 2032
- Table 92: North Africa US Energy-Based Aesthetic Devices Market Volume (K Unit) Forecast, by Application 2019 & 2032
- Table 93: South Africa US Energy-Based Aesthetic Devices Market Revenue (Million) Forecast, by Application 2019 & 2032
- Table 94: South Africa US Energy-Based Aesthetic Devices Market Volume (K Unit) Forecast, by Application 2019 & 2032
- Table 95: Rest of Middle East & Africa US Energy-Based Aesthetic Devices Market Revenue (Million) Forecast, by Application 2019 & 2032
- Table 96: Rest of Middle East & Africa US Energy-Based Aesthetic Devices Market Volume (K Unit) Forecast, by Application 2019 & 2032
- Table 97: Global US Energy-Based Aesthetic Devices Market Revenue Million Forecast, by Type of Device 2019 & 2032
- Table 98: Global US Energy-Based Aesthetic Devices Market Volume K Unit Forecast, by Type of Device 2019 & 2032
- Table 99: Global US Energy-Based Aesthetic Devices Market Revenue Million Forecast, by Application 2019 & 2032
- Table 100: Global US Energy-Based Aesthetic Devices Market Volume K Unit Forecast, by Application 2019 & 2032
- Table 101: Global US Energy-Based Aesthetic Devices Market Revenue Million Forecast, by End User 2019 & 2032
- Table 102: Global US Energy-Based Aesthetic Devices Market Volume K Unit Forecast, by End User 2019 & 2032
- Table 103: Global US Energy-Based Aesthetic Devices Market Revenue Million Forecast, by Country 2019 & 2032
- Table 104: Global US Energy-Based Aesthetic Devices Market Volume K Unit Forecast, by Country 2019 & 2032
- Table 105: China US Energy-Based Aesthetic Devices Market Revenue (Million) Forecast, by Application 2019 & 2032
- Table 106: China US Energy-Based Aesthetic Devices Market Volume (K Unit) Forecast, by Application 2019 & 2032
- Table 107: India US Energy-Based Aesthetic Devices Market Revenue (Million) Forecast, by Application 2019 & 2032
- Table 108: India US Energy-Based Aesthetic Devices Market Volume (K Unit) Forecast, by Application 2019 & 2032
- Table 109: Japan US Energy-Based Aesthetic Devices Market Revenue (Million) Forecast, by Application 2019 & 2032
- Table 110: Japan US Energy-Based Aesthetic Devices Market Volume (K Unit) Forecast, by Application 2019 & 2032
- Table 111: South Korea US Energy-Based Aesthetic Devices Market Revenue (Million) Forecast, by Application 2019 & 2032
- Table 112: South Korea US Energy-Based Aesthetic Devices Market Volume (K Unit) Forecast, by Application 2019 & 2032
- Table 113: ASEAN US Energy-Based Aesthetic Devices Market Revenue (Million) Forecast, by Application 2019 & 2032
- Table 114: ASEAN US Energy-Based Aesthetic Devices Market Volume (K Unit) Forecast, by Application 2019 & 2032
- Table 115: Oceania US Energy-Based Aesthetic Devices Market Revenue (Million) Forecast, by Application 2019 & 2032
- Table 116: Oceania US Energy-Based Aesthetic Devices Market Volume (K Unit) Forecast, by Application 2019 & 2032
- Table 117: Rest of Asia Pacific US Energy-Based Aesthetic Devices Market Revenue (Million) Forecast, by Application 2019 & 2032
- Table 118: Rest of Asia Pacific US Energy-Based Aesthetic Devices Market Volume (K Unit) Forecast, by Application 2019 & 2032
Frequently Asked Questions
1. What is the projected Compound Annual Growth Rate (CAGR) of the US Energy-Based Aesthetic Devices Market?
The projected CAGR is approximately 9.79%.
2. Which companies are prominent players in the US Energy-Based Aesthetic Devices Market?
Key companies in the market include Cynosure, Lumenis Inc, Bausch Health Companies Inc (Solta Medical Inc ), Abbvie, El en (Asclepion Laser Technologies), Alma Lasers, Venus Concept, Syneron Medical Ltd, Cutera Inc, Sciton Inc.
3. What are the main segments of the US Energy-Based Aesthetic Devices Market?
The market segments include Type of Device, Application, End User.
4. Can you provide details about the market size?
The market size is estimated to be USD 10.45 Million as of 2022.
5. What are some drivers contributing to market growth?
Increasing Obese Population; Increasing Awareness Regarding Aesthetic Procedures and Rising Adoption of Minimally Invasive Devices; Technological Advancement in Devices.
6. What are the notable trends driving market growth?
The Breast Implants Sub-segment is Expected to Show Rapid Grow in the Implants Segment of the Market.
7. Are there any restraints impacting market growth?
Social Stigma Concerns; Poor Reimbursement Scenario.
8. Can you provide examples of recent developments in the market?
N/A
9. What pricing options are available for accessing the report?
Pricing options include single-user, multi-user, and enterprise licenses priced at USD 3800, USD 4500, and USD 5800 respectively.
10. Is the market size provided in terms of value or volume?
The market size is provided in terms of value, measured in Million and volume, measured in K Unit.
11. Are there any specific market keywords associated with the report?
Yes, the market keyword associated with the report is "US Energy-Based Aesthetic Devices Market," which aids in identifying and referencing the specific market segment covered.
12. How do I determine which pricing option suits my needs best?
The pricing options vary based on user requirements and access needs. Individual users may opt for single-user licenses, while businesses requiring broader access may choose multi-user or enterprise licenses for cost-effective access to the report.
13. Are there any additional resources or data provided in the US Energy-Based Aesthetic Devices Market report?
While the report offers comprehensive insights, it's advisable to review the specific contents or supplementary materials provided to ascertain if additional resources or data are available.
14. How can I stay updated on further developments or reports in the US Energy-Based Aesthetic Devices Market?
To stay informed about further developments, trends, and reports in the US Energy-Based Aesthetic Devices Market, consider subscribing to industry newsletters, following relevant companies and organizations, or regularly checking reputable industry news sources and publications.
Methodology
Step 1 - Identification of Relevant Samples Size from Population Database


Step 2 - Approaches for Defining Global Market Size (Value, Volume* & Price*)

Note*: In applicable scenarios
Step 3 - Data Sources
Primary Research
- Web Analytics
- Survey Reports
- Research Institute
- Latest Research Reports
- Opinion Leaders
Secondary Research
- Annual Reports
- White Paper
- Latest Press Release
- Industry Association
- Paid Database
- Investor Presentations

Step 4 - Data Triangulation
Involves using different sources of information in order to increase the validity of a study
These sources are likely to be stakeholders in a program - participants, other researchers, program staff, other community members, and so on.
Then we put all data in single framework & apply various statistical tools to find out the dynamic on the market.
During the analysis stage, feedback from the stakeholder groups would be compared to determine areas of agreement as well as areas of divergence


