
Key Insights
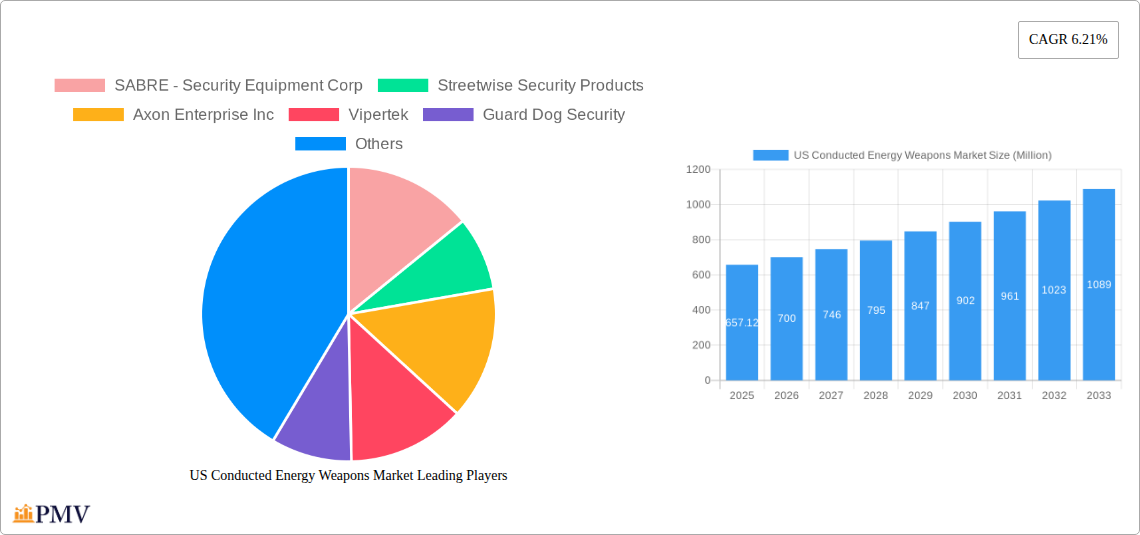
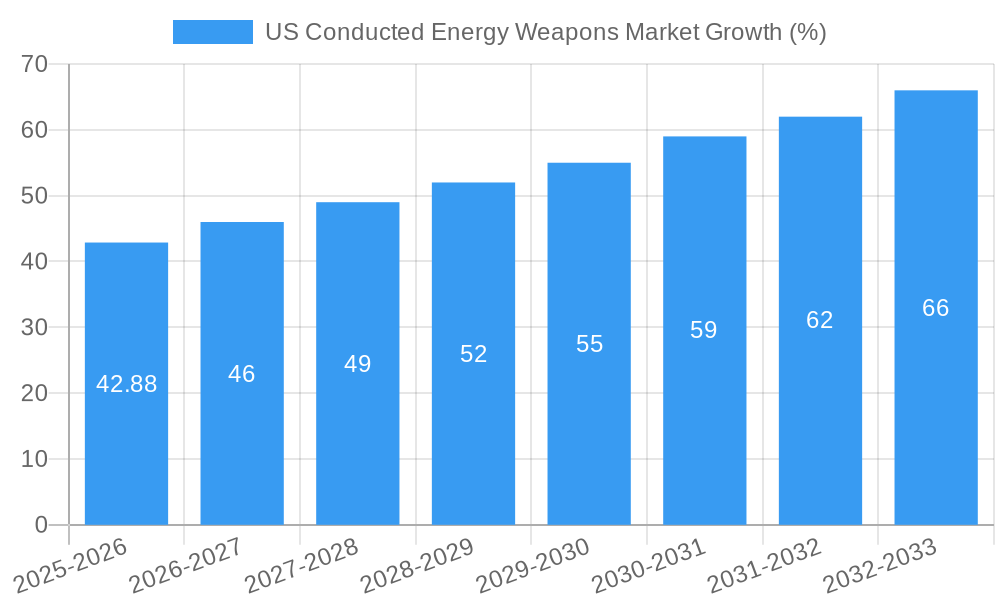
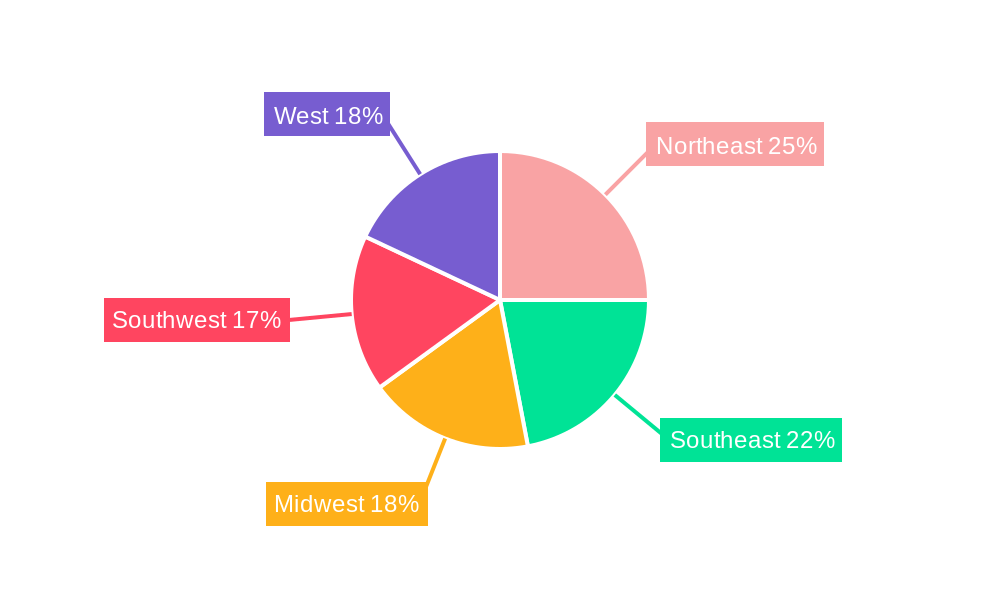
The US Conducted Energy Weapons (CEW) market, valued at $657.12 million in 2025, is projected to experience robust growth, driven by increasing demand from law enforcement agencies and a rising awareness of personal safety among civilians. The market's Compound Annual Growth Rate (CAGR) of 6.21% from 2025 to 2033 indicates a significant expansion over the forecast period. Key drivers include the perceived non-lethal nature of CEWs compared to firearms, their effectiveness in subduing suspects, and advancements in technology leading to improved safety features and reduced collateral damage. Growing concerns about escalating crime rates and the need for effective crowd control solutions further contribute to market growth. While the market faces restraints such as stringent regulations governing the sale and use of CEWs and occasional controversies surrounding their deployment, the overall positive perception and continuous technological advancements are expected to outweigh these challenges. The market segmentation reveals a strong presence of various CEW types, including stun guns, tasers, and stun batons, catering to both law enforcement and personal use. Major players like Axon Enterprise, SABRE, and Vipertek are constantly innovating, introducing products with enhanced functionalities and aiming at various segments of the market. The regional distribution likely sees the highest concentration in densely populated areas and states with higher crime rates, with the Northeast, Southeast, and West regions potentially leading the market share within the United States.
The increasing adoption of CEWs by law enforcement agencies, particularly those focusing on minimizing lethal force incidents, is a significant growth factor. The personal safety market segment is also experiencing rapid expansion as consumers seek self-defense solutions. Technological innovations like improved battery life, enhanced range and accuracy, and the incorporation of video recording capabilities contribute to higher prices and create lucrative opportunities for established and emerging players. Further market expansion is expected from the development of more sophisticated and user-friendly CEWs targeting specific demographics and needs. The market's expansion will likely be driven by a combination of factors: increasing awareness, technological improvements, and favorable regulatory environments in certain regions. This projected growth underscores the importance of CEWs as an increasingly vital tool in both law enforcement and personal safety applications across the United States.
US Conducted Energy Weapons Market: A Comprehensive Market Analysis (2019-2033)
This in-depth report provides a comprehensive analysis of the US Conducted Energy Weapons (CEW) market, offering invaluable insights into market dynamics, competitive landscapes, and future growth potential. The study covers the period from 2019 to 2033, with 2025 serving as the base and estimated year. The report meticulously examines various segments, including different CEW types, equipment types, and end-users, providing a granular understanding of the market's structure and growth drivers. Key market players such as SABRE - Security Equipment Corp, Streetwise Security Products, Axon Enterprise Inc, Vipertek, Guard Dog Security, PhaZZer LL, and Foxfend are profiled, analyzing their market share and strategic initiatives. The report is a crucial resource for industry stakeholders, investors, and researchers seeking to understand and capitalize on the opportunities within this dynamic market.
US Conducted Energy Weapons Market Structure & Competitive Dynamics
The US Conducted Energy Weapons market exhibits a moderately concentrated structure, with a few dominant players holding significant market share. Axon Enterprise Inc., with its Taser brand, holds a considerable portion of the market, while other players like SABRE - Security Equipment Corp and Vipertek compete fiercely in specific segments. The market is characterized by ongoing innovation, particularly in areas such as improved safety features, extended battery life, and advanced targeting systems. Regulatory frameworks, including restrictions on civilian ownership and usage in certain jurisdictions, significantly influence market dynamics. Product substitutes, such as pepper spray and other non-lethal weaponry, also pose competitive challenges. End-user trends, particularly within law enforcement, are shaping the demand for CEWs with advanced features and improved training programs. The historical period (2019-2024) witnessed several M&A activities, with deal values reaching an estimated XX Million in total. These activities aimed to consolidate market share and expand product portfolios. Future M&A activity is expected to continue, further shaping the competitive landscape.
- Market Concentration: Moderately concentrated, with a few dominant players.
- Innovation Ecosystem: Active, focusing on improved safety, battery life, and targeting systems.
- Regulatory Frameworks: Significant influence on market access and adoption.
- Product Substitutes: Pepper spray and other non-lethal options pose competition.
- End-User Trends: Law enforcement demands drive innovation and adoption.
- M&A Activity (2019-2024): Estimated XX Million in total deal value.
US Conducted Energy Weapons Market Industry Trends & Insights
The US Conducted Energy Weapons market is experiencing robust growth, driven by increasing demand from law enforcement agencies and a rising awareness of personal safety among civilians. The market’s Compound Annual Growth Rate (CAGR) during the forecast period (2025-2033) is projected to be XX%, fueled by technological advancements, such as the development of more effective and safer CEWs. Market penetration remains relatively high within law enforcement but shows potential for significant growth in the personal safety segment. Consumer preferences are shifting towards smaller, more discreet devices with improved ergonomics and ease of use. Competitive dynamics are intense, with companies focusing on innovation, product differentiation, and strategic partnerships to gain market share. The integration of CEWs with body cameras and other law enforcement technologies is a significant trend impacting market growth. The historical period demonstrated a steady increase in market size, reaching an estimated XX Million in 2024, and projections indicate continued expansion.
Dominant Markets & Segments in US Conducted Energy Weapons Market
The Law Enforcement Agencies segment dominates the US Conducted Energy Weapons market, accounting for approximately xx% of the total market value in 2025. This segment's dominance is driven by the increasing adoption of CEWs as a less-lethal force option by law enforcement agencies across the country. The Taser segment holds the largest market share among CEW types, owing to its widespread acceptance and reliability. Geographically, the market is widely distributed across the US, with no single region exhibiting overwhelming dominance. However, states with larger law enforcement budgets and higher crime rates generally show higher demand.
- Key Drivers for Law Enforcement Segment:
- Increased emphasis on less-lethal force options.
- Growing budgets allocated to public safety.
- Improved training programs for CEW usage.
- Key Drivers for Taser Segment:
- Proven effectiveness and reliability.
- Continuous technological improvements.
- Widespread acceptance among law enforcement.
- Key Drivers for Personal Use Segment:
- Rising awareness of personal safety.
- Increased availability of CEWs for civilian use (where permitted).
- Growing online sales and retail presence.
The Cartridges segment is crucial, as it represents a recurring revenue stream for manufacturers and is directly tied to weapon usage. The market is expected to grow in line with the overall CEW market, reflecting the consistent need for replacement cartridges.
US Conducted Energy Weapons Market Product Innovations
Recent product innovations in the US Conducted Energy Weapons market focus on enhanced safety features, improved ergonomics, and extended battery life. Manufacturers are incorporating advanced targeting systems and non-lethal incapacitation technologies to minimize the risk of injury. These advancements cater to the growing demand for safer and more effective CEWs within both law enforcement and civilian applications. The integration of smart technology, such as data logging and remote disabling capabilities, is gaining traction, further enhancing the overall market appeal and competitive advantage of various CEWs. The development of smaller and more discreet models is meeting the growing demand for personal self-defense tools.
Report Segmentation & Scope
This report segments the US Conducted Energy Weapons market across various parameters:
By Type: Stun Guns, Tasers, and Stun Batons. Each type holds a distinct market share, with Tasers currently dominating. Growth projections for each segment vary based on technological advancements, regulatory changes, and end-user preferences. Competitive dynamics are influenced by factors such as product differentiation, pricing strategies, and brand recognition.
By Equipment Type: Weapons and Cartridges. The weapons segment is typically characterized by higher initial purchase prices, while the cartridges segment represents a continuous revenue stream for manufacturers. Growth in the cartridge segment is directly linked to the usage rate of CEWs.
By End-User: Law Enforcement Agencies and Personal Use. The law enforcement segment is currently the larger market due to extensive adoption; however, the personal use segment is showing promising growth potential. Competitive dynamics in each segment differ, reflecting the distinct needs and purchasing behaviors of each end-user group.
Key Drivers of US Conducted Energy Weapons Market Growth
The growth of the US Conducted Energy Weapons market is primarily driven by the increasing demand for less-lethal force options within law enforcement agencies, a rising focus on personal safety among civilians, and continuous technological advancements that enhance the effectiveness and safety of these devices. Government regulations regarding the use of CEWs and their accessibility to civilians also play a key role. Furthermore, economic factors, such as increasing disposable income among consumers, contribute to the growth of the personal use segment.
Challenges in the US Conducted Energy Weapons Market Sector
The US Conducted Energy Weapons market faces several challenges, including stringent regulatory hurdles surrounding the manufacture, sale, and use of CEWs. Supply chain disruptions and fluctuations in raw material costs can significantly affect production and pricing. Intense competition from established players and the emergence of new entrants create pressure on profit margins. Concerns regarding potential misuse and the ethical implications of CEW use are also significant barriers to wider market adoption. These challenges affect overall market growth, requiring constant adaptation and innovation from market players.
Leading Players in the US Conducted Energy Weapons Market Market
- SABRE - Security Equipment Corp
- Streetwise Security Products
- Axon Enterprise Inc
- Vipertek
- Guard Dog Security
- PhaZZer LL
- Foxfend
Key Developments in US Conducted Energy Weapons Market Sector
- Jan 2023: Axon Enterprise Inc. launched a new Taser model with improved safety features.
- May 2022: SABRE - Security Equipment Corp. expanded its distribution network, increasing market reach.
- Oct 2021: A new regulation regarding CEW usage by law enforcement was implemented in California.
Strategic US Conducted Energy Weapons Market Market Outlook
The US Conducted Energy Weapons market is poised for continued growth, driven by technological innovation, increasing demand from law enforcement, and the expansion of the civilian market. Strategic opportunities exist for companies focused on developing advanced CEW technologies, expanding into new geographic markets, and catering to specialized niche applications. Focusing on product differentiation, strengthening distribution networks, and addressing ethical concerns will be crucial for success in this competitive and evolving market. The market is expected to reach an estimated XX Million by 2033, representing substantial growth potential for industry players.
US Conducted Energy Weapons Market Segmentation
- 1. Production Analysis
- 2. Consumption Analysis
- 3. Import Market Analysis (Value & Volume)
- 4. Export Market Analysis (Value & Volume)
- 5. Price Trend Analysis
US Conducted Energy Weapons Market Segmentation By Geography
-
1. North America
- 1.1. United States
- 1.2. Canada
- 1.3. Mexico
-
2. South America
- 2.1. Brazil
- 2.2. Argentina
- 2.3. Rest of South America
-
3. Europe
- 3.1. United Kingdom
- 3.2. Germany
- 3.3. France
- 3.4. Italy
- 3.5. Spain
- 3.6. Russia
- 3.7. Benelux
- 3.8. Nordics
- 3.9. Rest of Europe
-
4. Middle East & Africa
- 4.1. Turkey
- 4.2. Israel
- 4.3. GCC
- 4.4. North Africa
- 4.5. South Africa
- 4.6. Rest of Middle East & Africa
-
5. Asia Pacific
- 5.1. China
- 5.2. India
- 5.3. Japan
- 5.4. South Korea
- 5.5. ASEAN
- 5.6. Oceania
- 5.7. Rest of Asia Pacific
US Conducted Energy Weapons Market REPORT HIGHLIGHTS
| Aspects | Details |
|---|---|
| Study Period | 2019-2033 |
| Base Year | 2024 |
| Estimated Year | 2025 |
| Forecast Period | 2025-2033 |
| Historical Period | 2019-2024 |
| Growth Rate | CAGR of 6.21% from 2019-2033 |
| Segmentation |
|
Table of Contents
- 1. Introduction
- 1.1. Research Scope
- 1.2. Market Segmentation
- 1.3. Research Methodology
- 1.4. Definitions and Assumptions
- 2. Executive Summary
- 2.1. Introduction
- 3. Market Dynamics
- 3.1. Introduction
- 3.2. Market Drivers
- 3.2.1. ; Increased Seaborne Threats And Ambiguous Maritime Security Policies; Increasing Adoption Of Security Technologies In Bric Countries
- 3.3. Market Restrains
- 3.3.1. ; High Risk Rate In Ungoverned Zones; Unstructured Security Standards And Technologies
- 3.4. Market Trends
- 3.4.1. Increasing Incidents of Civil Unrest Driving Procurement
- 4. Market Factor Analysis
- 4.1. Porters Five Forces
- 4.2. Supply/Value Chain
- 4.3. PESTEL analysis
- 4.4. Market Entropy
- 4.5. Patent/Trademark Analysis
- 5. Global US Conducted Energy Weapons Market Analysis, Insights and Forecast, 2019-2031
- 5.1. Market Analysis, Insights and Forecast - by Production Analysis
- 5.2. Market Analysis, Insights and Forecast - by Consumption Analysis
- 5.3. Market Analysis, Insights and Forecast - by Import Market Analysis (Value & Volume)
- 5.4. Market Analysis, Insights and Forecast - by Export Market Analysis (Value & Volume)
- 5.5. Market Analysis, Insights and Forecast - by Price Trend Analysis
- 5.6. Market Analysis, Insights and Forecast - by Region
- 5.6.1. North America
- 5.6.2. South America
- 5.6.3. Europe
- 5.6.4. Middle East & Africa
- 5.6.5. Asia Pacific
- 5.1. Market Analysis, Insights and Forecast - by Production Analysis
- 6. North America US Conducted Energy Weapons Market Analysis, Insights and Forecast, 2019-2031
- 6.1. Market Analysis, Insights and Forecast - by Production Analysis
- 6.2. Market Analysis, Insights and Forecast - by Consumption Analysis
- 6.3. Market Analysis, Insights and Forecast - by Import Market Analysis (Value & Volume)
- 6.4. Market Analysis, Insights and Forecast - by Export Market Analysis (Value & Volume)
- 6.5. Market Analysis, Insights and Forecast - by Price Trend Analysis
- 6.1. Market Analysis, Insights and Forecast - by Production Analysis
- 7. South America US Conducted Energy Weapons Market Analysis, Insights and Forecast, 2019-2031
- 7.1. Market Analysis, Insights and Forecast - by Production Analysis
- 7.2. Market Analysis, Insights and Forecast - by Consumption Analysis
- 7.3. Market Analysis, Insights and Forecast - by Import Market Analysis (Value & Volume)
- 7.4. Market Analysis, Insights and Forecast - by Export Market Analysis (Value & Volume)
- 7.5. Market Analysis, Insights and Forecast - by Price Trend Analysis
- 7.1. Market Analysis, Insights and Forecast - by Production Analysis
- 8. Europe US Conducted Energy Weapons Market Analysis, Insights and Forecast, 2019-2031
- 8.1. Market Analysis, Insights and Forecast - by Production Analysis
- 8.2. Market Analysis, Insights and Forecast - by Consumption Analysis
- 8.3. Market Analysis, Insights and Forecast - by Import Market Analysis (Value & Volume)
- 8.4. Market Analysis, Insights and Forecast - by Export Market Analysis (Value & Volume)
- 8.5. Market Analysis, Insights and Forecast - by Price Trend Analysis
- 8.1. Market Analysis, Insights and Forecast - by Production Analysis
- 9. Middle East & Africa US Conducted Energy Weapons Market Analysis, Insights and Forecast, 2019-2031
- 9.1. Market Analysis, Insights and Forecast - by Production Analysis
- 9.2. Market Analysis, Insights and Forecast - by Consumption Analysis
- 9.3. Market Analysis, Insights and Forecast - by Import Market Analysis (Value & Volume)
- 9.4. Market Analysis, Insights and Forecast - by Export Market Analysis (Value & Volume)
- 9.5. Market Analysis, Insights and Forecast - by Price Trend Analysis
- 9.1. Market Analysis, Insights and Forecast - by Production Analysis
- 10. Asia Pacific US Conducted Energy Weapons Market Analysis, Insights and Forecast, 2019-2031
- 10.1. Market Analysis, Insights and Forecast - by Production Analysis
- 10.2. Market Analysis, Insights and Forecast - by Consumption Analysis
- 10.3. Market Analysis, Insights and Forecast - by Import Market Analysis (Value & Volume)
- 10.4. Market Analysis, Insights and Forecast - by Export Market Analysis (Value & Volume)
- 10.5. Market Analysis, Insights and Forecast - by Price Trend Analysis
- 10.1. Market Analysis, Insights and Forecast - by Production Analysis
- 11. Northeast US Conducted Energy Weapons Market Analysis, Insights and Forecast, 2019-2031
- 12. Southeast US Conducted Energy Weapons Market Analysis, Insights and Forecast, 2019-2031
- 13. Midwest US Conducted Energy Weapons Market Analysis, Insights and Forecast, 2019-2031
- 14. Southwest US Conducted Energy Weapons Market Analysis, Insights and Forecast, 2019-2031
- 15. West US Conducted Energy Weapons Market Analysis, Insights and Forecast, 2019-2031
- 16. Competitive Analysis
- 16.1. Global Market Share Analysis 2024
- 16.2. Company Profiles
- 16.2.1 SABRE - Security Equipment Corp
- 16.2.1.1. Overview
- 16.2.1.2. Products
- 16.2.1.3. SWOT Analysis
- 16.2.1.4. Recent Developments
- 16.2.1.5. Financials (Based on Availability)
- 16.2.2 Streetwise Security Products
- 16.2.2.1. Overview
- 16.2.2.2. Products
- 16.2.2.3. SWOT Analysis
- 16.2.2.4. Recent Developments
- 16.2.2.5. Financials (Based on Availability)
- 16.2.3 Axon Enterprise Inc
- 16.2.3.1. Overview
- 16.2.3.2. Products
- 16.2.3.3. SWOT Analysis
- 16.2.3.4. Recent Developments
- 16.2.3.5. Financials (Based on Availability)
- 16.2.4 Vipertek
- 16.2.4.1. Overview
- 16.2.4.2. Products
- 16.2.4.3. SWOT Analysis
- 16.2.4.4. Recent Developments
- 16.2.4.5. Financials (Based on Availability)
- 16.2.5 Guard Dog Security
- 16.2.5.1. Overview
- 16.2.5.2. Products
- 16.2.5.3. SWOT Analysis
- 16.2.5.4. Recent Developments
- 16.2.5.5. Financials (Based on Availability)
- 16.2.6 PhaZZer LL
- 16.2.6.1. Overview
- 16.2.6.2. Products
- 16.2.6.3. SWOT Analysis
- 16.2.6.4. Recent Developments
- 16.2.6.5. Financials (Based on Availability)
- 16.2.7 Foxfend
- 16.2.7.1. Overview
- 16.2.7.2. Products
- 16.2.7.3. SWOT Analysis
- 16.2.7.4. Recent Developments
- 16.2.7.5. Financials (Based on Availability)
- 16.2.1 SABRE - Security Equipment Corp
List of Figures
- Figure 1: Global US Conducted Energy Weapons Market Revenue Breakdown (Million, %) by Region 2024 & 2032
- Figure 2: United states US Conducted Energy Weapons Market Revenue (Million), by Country 2024 & 2032
- Figure 3: United states US Conducted Energy Weapons Market Revenue Share (%), by Country 2024 & 2032
- Figure 4: North America US Conducted Energy Weapons Market Revenue (Million), by Production Analysis 2024 & 2032
- Figure 5: North America US Conducted Energy Weapons Market Revenue Share (%), by Production Analysis 2024 & 2032
- Figure 6: North America US Conducted Energy Weapons Market Revenue (Million), by Consumption Analysis 2024 & 2032
- Figure 7: North America US Conducted Energy Weapons Market Revenue Share (%), by Consumption Analysis 2024 & 2032
- Figure 8: North America US Conducted Energy Weapons Market Revenue (Million), by Import Market Analysis (Value & Volume) 2024 & 2032
- Figure 9: North America US Conducted Energy Weapons Market Revenue Share (%), by Import Market Analysis (Value & Volume) 2024 & 2032
- Figure 10: North America US Conducted Energy Weapons Market Revenue (Million), by Export Market Analysis (Value & Volume) 2024 & 2032
- Figure 11: North America US Conducted Energy Weapons Market Revenue Share (%), by Export Market Analysis (Value & Volume) 2024 & 2032
- Figure 12: North America US Conducted Energy Weapons Market Revenue (Million), by Price Trend Analysis 2024 & 2032
- Figure 13: North America US Conducted Energy Weapons Market Revenue Share (%), by Price Trend Analysis 2024 & 2032
- Figure 14: North America US Conducted Energy Weapons Market Revenue (Million), by Country 2024 & 2032
- Figure 15: North America US Conducted Energy Weapons Market Revenue Share (%), by Country 2024 & 2032
- Figure 16: South America US Conducted Energy Weapons Market Revenue (Million), by Production Analysis 2024 & 2032
- Figure 17: South America US Conducted Energy Weapons Market Revenue Share (%), by Production Analysis 2024 & 2032
- Figure 18: South America US Conducted Energy Weapons Market Revenue (Million), by Consumption Analysis 2024 & 2032
- Figure 19: South America US Conducted Energy Weapons Market Revenue Share (%), by Consumption Analysis 2024 & 2032
- Figure 20: South America US Conducted Energy Weapons Market Revenue (Million), by Import Market Analysis (Value & Volume) 2024 & 2032
- Figure 21: South America US Conducted Energy Weapons Market Revenue Share (%), by Import Market Analysis (Value & Volume) 2024 & 2032
- Figure 22: South America US Conducted Energy Weapons Market Revenue (Million), by Export Market Analysis (Value & Volume) 2024 & 2032
- Figure 23: South America US Conducted Energy Weapons Market Revenue Share (%), by Export Market Analysis (Value & Volume) 2024 & 2032
- Figure 24: South America US Conducted Energy Weapons Market Revenue (Million), by Price Trend Analysis 2024 & 2032
- Figure 25: South America US Conducted Energy Weapons Market Revenue Share (%), by Price Trend Analysis 2024 & 2032
- Figure 26: South America US Conducted Energy Weapons Market Revenue (Million), by Country 2024 & 2032
- Figure 27: South America US Conducted Energy Weapons Market Revenue Share (%), by Country 2024 & 2032
- Figure 28: Europe US Conducted Energy Weapons Market Revenue (Million), by Production Analysis 2024 & 2032
- Figure 29: Europe US Conducted Energy Weapons Market Revenue Share (%), by Production Analysis 2024 & 2032
- Figure 30: Europe US Conducted Energy Weapons Market Revenue (Million), by Consumption Analysis 2024 & 2032
- Figure 31: Europe US Conducted Energy Weapons Market Revenue Share (%), by Consumption Analysis 2024 & 2032
- Figure 32: Europe US Conducted Energy Weapons Market Revenue (Million), by Import Market Analysis (Value & Volume) 2024 & 2032
- Figure 33: Europe US Conducted Energy Weapons Market Revenue Share (%), by Import Market Analysis (Value & Volume) 2024 & 2032
- Figure 34: Europe US Conducted Energy Weapons Market Revenue (Million), by Export Market Analysis (Value & Volume) 2024 & 2032
- Figure 35: Europe US Conducted Energy Weapons Market Revenue Share (%), by Export Market Analysis (Value & Volume) 2024 & 2032
- Figure 36: Europe US Conducted Energy Weapons Market Revenue (Million), by Price Trend Analysis 2024 & 2032
- Figure 37: Europe US Conducted Energy Weapons Market Revenue Share (%), by Price Trend Analysis 2024 & 2032
- Figure 38: Europe US Conducted Energy Weapons Market Revenue (Million), by Country 2024 & 2032
- Figure 39: Europe US Conducted Energy Weapons Market Revenue Share (%), by Country 2024 & 2032
- Figure 40: Middle East & Africa US Conducted Energy Weapons Market Revenue (Million), by Production Analysis 2024 & 2032
- Figure 41: Middle East & Africa US Conducted Energy Weapons Market Revenue Share (%), by Production Analysis 2024 & 2032
- Figure 42: Middle East & Africa US Conducted Energy Weapons Market Revenue (Million), by Consumption Analysis 2024 & 2032
- Figure 43: Middle East & Africa US Conducted Energy Weapons Market Revenue Share (%), by Consumption Analysis 2024 & 2032
- Figure 44: Middle East & Africa US Conducted Energy Weapons Market Revenue (Million), by Import Market Analysis (Value & Volume) 2024 & 2032
- Figure 45: Middle East & Africa US Conducted Energy Weapons Market Revenue Share (%), by Import Market Analysis (Value & Volume) 2024 & 2032
- Figure 46: Middle East & Africa US Conducted Energy Weapons Market Revenue (Million), by Export Market Analysis (Value & Volume) 2024 & 2032
- Figure 47: Middle East & Africa US Conducted Energy Weapons Market Revenue Share (%), by Export Market Analysis (Value & Volume) 2024 & 2032
- Figure 48: Middle East & Africa US Conducted Energy Weapons Market Revenue (Million), by Price Trend Analysis 2024 & 2032
- Figure 49: Middle East & Africa US Conducted Energy Weapons Market Revenue Share (%), by Price Trend Analysis 2024 & 2032
- Figure 50: Middle East & Africa US Conducted Energy Weapons Market Revenue (Million), by Country 2024 & 2032
- Figure 51: Middle East & Africa US Conducted Energy Weapons Market Revenue Share (%), by Country 2024 & 2032
- Figure 52: Asia Pacific US Conducted Energy Weapons Market Revenue (Million), by Production Analysis 2024 & 2032
- Figure 53: Asia Pacific US Conducted Energy Weapons Market Revenue Share (%), by Production Analysis 2024 & 2032
- Figure 54: Asia Pacific US Conducted Energy Weapons Market Revenue (Million), by Consumption Analysis 2024 & 2032
- Figure 55: Asia Pacific US Conducted Energy Weapons Market Revenue Share (%), by Consumption Analysis 2024 & 2032
- Figure 56: Asia Pacific US Conducted Energy Weapons Market Revenue (Million), by Import Market Analysis (Value & Volume) 2024 & 2032
- Figure 57: Asia Pacific US Conducted Energy Weapons Market Revenue Share (%), by Import Market Analysis (Value & Volume) 2024 & 2032
- Figure 58: Asia Pacific US Conducted Energy Weapons Market Revenue (Million), by Export Market Analysis (Value & Volume) 2024 & 2032
- Figure 59: Asia Pacific US Conducted Energy Weapons Market Revenue Share (%), by Export Market Analysis (Value & Volume) 2024 & 2032
- Figure 60: Asia Pacific US Conducted Energy Weapons Market Revenue (Million), by Price Trend Analysis 2024 & 2032
- Figure 61: Asia Pacific US Conducted Energy Weapons Market Revenue Share (%), by Price Trend Analysis 2024 & 2032
- Figure 62: Asia Pacific US Conducted Energy Weapons Market Revenue (Million), by Country 2024 & 2032
- Figure 63: Asia Pacific US Conducted Energy Weapons Market Revenue Share (%), by Country 2024 & 2032
List of Tables
- Table 1: Global US Conducted Energy Weapons Market Revenue Million Forecast, by Region 2019 & 2032
- Table 2: Global US Conducted Energy Weapons Market Revenue Million Forecast, by Production Analysis 2019 & 2032
- Table 3: Global US Conducted Energy Weapons Market Revenue Million Forecast, by Consumption Analysis 2019 & 2032
- Table 4: Global US Conducted Energy Weapons Market Revenue Million Forecast, by Import Market Analysis (Value & Volume) 2019 & 2032
- Table 5: Global US Conducted Energy Weapons Market Revenue Million Forecast, by Export Market Analysis (Value & Volume) 2019 & 2032
- Table 6: Global US Conducted Energy Weapons Market Revenue Million Forecast, by Price Trend Analysis 2019 & 2032
- Table 7: Global US Conducted Energy Weapons Market Revenue Million Forecast, by Region 2019 & 2032
- Table 8: Global US Conducted Energy Weapons Market Revenue Million Forecast, by Country 2019 & 2032
- Table 9: Northeast US Conducted Energy Weapons Market Revenue (Million) Forecast, by Application 2019 & 2032
- Table 10: Southeast US Conducted Energy Weapons Market Revenue (Million) Forecast, by Application 2019 & 2032
- Table 11: Midwest US Conducted Energy Weapons Market Revenue (Million) Forecast, by Application 2019 & 2032
- Table 12: Southwest US Conducted Energy Weapons Market Revenue (Million) Forecast, by Application 2019 & 2032
- Table 13: West US Conducted Energy Weapons Market Revenue (Million) Forecast, by Application 2019 & 2032
- Table 14: Global US Conducted Energy Weapons Market Revenue Million Forecast, by Production Analysis 2019 & 2032
- Table 15: Global US Conducted Energy Weapons Market Revenue Million Forecast, by Consumption Analysis 2019 & 2032
- Table 16: Global US Conducted Energy Weapons Market Revenue Million Forecast, by Import Market Analysis (Value & Volume) 2019 & 2032
- Table 17: Global US Conducted Energy Weapons Market Revenue Million Forecast, by Export Market Analysis (Value & Volume) 2019 & 2032
- Table 18: Global US Conducted Energy Weapons Market Revenue Million Forecast, by Price Trend Analysis 2019 & 2032
- Table 19: Global US Conducted Energy Weapons Market Revenue Million Forecast, by Country 2019 & 2032
- Table 20: United States US Conducted Energy Weapons Market Revenue (Million) Forecast, by Application 2019 & 2032
- Table 21: Canada US Conducted Energy Weapons Market Revenue (Million) Forecast, by Application 2019 & 2032
- Table 22: Mexico US Conducted Energy Weapons Market Revenue (Million) Forecast, by Application 2019 & 2032
- Table 23: Global US Conducted Energy Weapons Market Revenue Million Forecast, by Production Analysis 2019 & 2032
- Table 24: Global US Conducted Energy Weapons Market Revenue Million Forecast, by Consumption Analysis 2019 & 2032
- Table 25: Global US Conducted Energy Weapons Market Revenue Million Forecast, by Import Market Analysis (Value & Volume) 2019 & 2032
- Table 26: Global US Conducted Energy Weapons Market Revenue Million Forecast, by Export Market Analysis (Value & Volume) 2019 & 2032
- Table 27: Global US Conducted Energy Weapons Market Revenue Million Forecast, by Price Trend Analysis 2019 & 2032
- Table 28: Global US Conducted Energy Weapons Market Revenue Million Forecast, by Country 2019 & 2032
- Table 29: Brazil US Conducted Energy Weapons Market Revenue (Million) Forecast, by Application 2019 & 2032
- Table 30: Argentina US Conducted Energy Weapons Market Revenue (Million) Forecast, by Application 2019 & 2032
- Table 31: Rest of South America US Conducted Energy Weapons Market Revenue (Million) Forecast, by Application 2019 & 2032
- Table 32: Global US Conducted Energy Weapons Market Revenue Million Forecast, by Production Analysis 2019 & 2032
- Table 33: Global US Conducted Energy Weapons Market Revenue Million Forecast, by Consumption Analysis 2019 & 2032
- Table 34: Global US Conducted Energy Weapons Market Revenue Million Forecast, by Import Market Analysis (Value & Volume) 2019 & 2032
- Table 35: Global US Conducted Energy Weapons Market Revenue Million Forecast, by Export Market Analysis (Value & Volume) 2019 & 2032
- Table 36: Global US Conducted Energy Weapons Market Revenue Million Forecast, by Price Trend Analysis 2019 & 2032
- Table 37: Global US Conducted Energy Weapons Market Revenue Million Forecast, by Country 2019 & 2032
- Table 38: United Kingdom US Conducted Energy Weapons Market Revenue (Million) Forecast, by Application 2019 & 2032
- Table 39: Germany US Conducted Energy Weapons Market Revenue (Million) Forecast, by Application 2019 & 2032
- Table 40: France US Conducted Energy Weapons Market Revenue (Million) Forecast, by Application 2019 & 2032
- Table 41: Italy US Conducted Energy Weapons Market Revenue (Million) Forecast, by Application 2019 & 2032
- Table 42: Spain US Conducted Energy Weapons Market Revenue (Million) Forecast, by Application 2019 & 2032
- Table 43: Russia US Conducted Energy Weapons Market Revenue (Million) Forecast, by Application 2019 & 2032
- Table 44: Benelux US Conducted Energy Weapons Market Revenue (Million) Forecast, by Application 2019 & 2032
- Table 45: Nordics US Conducted Energy Weapons Market Revenue (Million) Forecast, by Application 2019 & 2032
- Table 46: Rest of Europe US Conducted Energy Weapons Market Revenue (Million) Forecast, by Application 2019 & 2032
- Table 47: Global US Conducted Energy Weapons Market Revenue Million Forecast, by Production Analysis 2019 & 2032
- Table 48: Global US Conducted Energy Weapons Market Revenue Million Forecast, by Consumption Analysis 2019 & 2032
- Table 49: Global US Conducted Energy Weapons Market Revenue Million Forecast, by Import Market Analysis (Value & Volume) 2019 & 2032
- Table 50: Global US Conducted Energy Weapons Market Revenue Million Forecast, by Export Market Analysis (Value & Volume) 2019 & 2032
- Table 51: Global US Conducted Energy Weapons Market Revenue Million Forecast, by Price Trend Analysis 2019 & 2032
- Table 52: Global US Conducted Energy Weapons Market Revenue Million Forecast, by Country 2019 & 2032
- Table 53: Turkey US Conducted Energy Weapons Market Revenue (Million) Forecast, by Application 2019 & 2032
- Table 54: Israel US Conducted Energy Weapons Market Revenue (Million) Forecast, by Application 2019 & 2032
- Table 55: GCC US Conducted Energy Weapons Market Revenue (Million) Forecast, by Application 2019 & 2032
- Table 56: North Africa US Conducted Energy Weapons Market Revenue (Million) Forecast, by Application 2019 & 2032
- Table 57: South Africa US Conducted Energy Weapons Market Revenue (Million) Forecast, by Application 2019 & 2032
- Table 58: Rest of Middle East & Africa US Conducted Energy Weapons Market Revenue (Million) Forecast, by Application 2019 & 2032
- Table 59: Global US Conducted Energy Weapons Market Revenue Million Forecast, by Production Analysis 2019 & 2032
- Table 60: Global US Conducted Energy Weapons Market Revenue Million Forecast, by Consumption Analysis 2019 & 2032
- Table 61: Global US Conducted Energy Weapons Market Revenue Million Forecast, by Import Market Analysis (Value & Volume) 2019 & 2032
- Table 62: Global US Conducted Energy Weapons Market Revenue Million Forecast, by Export Market Analysis (Value & Volume) 2019 & 2032
- Table 63: Global US Conducted Energy Weapons Market Revenue Million Forecast, by Price Trend Analysis 2019 & 2032
- Table 64: Global US Conducted Energy Weapons Market Revenue Million Forecast, by Country 2019 & 2032
- Table 65: China US Conducted Energy Weapons Market Revenue (Million) Forecast, by Application 2019 & 2032
- Table 66: India US Conducted Energy Weapons Market Revenue (Million) Forecast, by Application 2019 & 2032
- Table 67: Japan US Conducted Energy Weapons Market Revenue (Million) Forecast, by Application 2019 & 2032
- Table 68: South Korea US Conducted Energy Weapons Market Revenue (Million) Forecast, by Application 2019 & 2032
- Table 69: ASEAN US Conducted Energy Weapons Market Revenue (Million) Forecast, by Application 2019 & 2032
- Table 70: Oceania US Conducted Energy Weapons Market Revenue (Million) Forecast, by Application 2019 & 2032
- Table 71: Rest of Asia Pacific US Conducted Energy Weapons Market Revenue (Million) Forecast, by Application 2019 & 2032
Frequently Asked Questions
1. What is the projected Compound Annual Growth Rate (CAGR) of the US Conducted Energy Weapons Market?
The projected CAGR is approximately 6.21%.
2. Which companies are prominent players in the US Conducted Energy Weapons Market?
Key companies in the market include SABRE - Security Equipment Corp, Streetwise Security Products, Axon Enterprise Inc, Vipertek, Guard Dog Security, PhaZZer LL, Foxfend.
3. What are the main segments of the US Conducted Energy Weapons Market?
The market segments include Production Analysis, Consumption Analysis, Import Market Analysis (Value & Volume), Export Market Analysis (Value & Volume), Price Trend Analysis.
4. Can you provide details about the market size?
The market size is estimated to be USD 657.12 Million as of 2022.
5. What are some drivers contributing to market growth?
; Increased Seaborne Threats And Ambiguous Maritime Security Policies; Increasing Adoption Of Security Technologies In Bric Countries.
6. What are the notable trends driving market growth?
Increasing Incidents of Civil Unrest Driving Procurement.
7. Are there any restraints impacting market growth?
; High Risk Rate In Ungoverned Zones; Unstructured Security Standards And Technologies.
8. Can you provide examples of recent developments in the market?
N/A
9. What pricing options are available for accessing the report?
Pricing options include single-user, multi-user, and enterprise licenses priced at USD 3800, USD 4500, and USD 5800 respectively.
10. Is the market size provided in terms of value or volume?
The market size is provided in terms of value, measured in Million.
11. Are there any specific market keywords associated with the report?
Yes, the market keyword associated with the report is "US Conducted Energy Weapons Market," which aids in identifying and referencing the specific market segment covered.
12. How do I determine which pricing option suits my needs best?
The pricing options vary based on user requirements and access needs. Individual users may opt for single-user licenses, while businesses requiring broader access may choose multi-user or enterprise licenses for cost-effective access to the report.
13. Are there any additional resources or data provided in the US Conducted Energy Weapons Market report?
While the report offers comprehensive insights, it's advisable to review the specific contents or supplementary materials provided to ascertain if additional resources or data are available.
14. How can I stay updated on further developments or reports in the US Conducted Energy Weapons Market?
To stay informed about further developments, trends, and reports in the US Conducted Energy Weapons Market, consider subscribing to industry newsletters, following relevant companies and organizations, or regularly checking reputable industry news sources and publications.
Methodology
Step 1 - Identification of Relevant Samples Size from Population Database


Step 2 - Approaches for Defining Global Market Size (Value, Volume* & Price*)

Note*: In applicable scenarios
Step 3 - Data Sources
Primary Research
- Web Analytics
- Survey Reports
- Research Institute
- Latest Research Reports
- Opinion Leaders
Secondary Research
- Annual Reports
- White Paper
- Latest Press Release
- Industry Association
- Paid Database
- Investor Presentations

Step 4 - Data Triangulation
Involves using different sources of information in order to increase the validity of a study
These sources are likely to be stakeholders in a program - participants, other researchers, program staff, other community members, and so on.
Then we put all data in single framework & apply various statistical tools to find out the dynamic on the market.
During the analysis stage, feedback from the stakeholder groups would be compared to determine areas of agreement as well as areas of divergence


