


Key Insights
The United States and European fiber optic cable market, valued at $3.10 billion in 2025, is experiencing robust growth, projected to expand at a CAGR of 9.66% from 2025 to 2033. This expansion is driven by several key factors. The increasing demand for high-speed internet and data transmission, particularly fueled by the proliferation of 5G networks and cloud computing, is a primary catalyst. Furthermore, significant investments in infrastructure modernization within the telecommunications sector and the expanding deployment of smart city initiatives across both regions are significantly boosting market growth. Government initiatives aimed at improving digital infrastructure and promoting technological advancements further contribute to this positive trajectory. The strong presence of major players like Corning Inc., Prysmian Group, and Fujikura Ltd., coupled with ongoing R&D efforts focusing on advanced fiber optic technologies, ensures a continuous supply of innovative products and solutions. While challenges such as the fluctuating price of raw materials and potential supply chain disruptions exist, the overall market outlook remains optimistic.
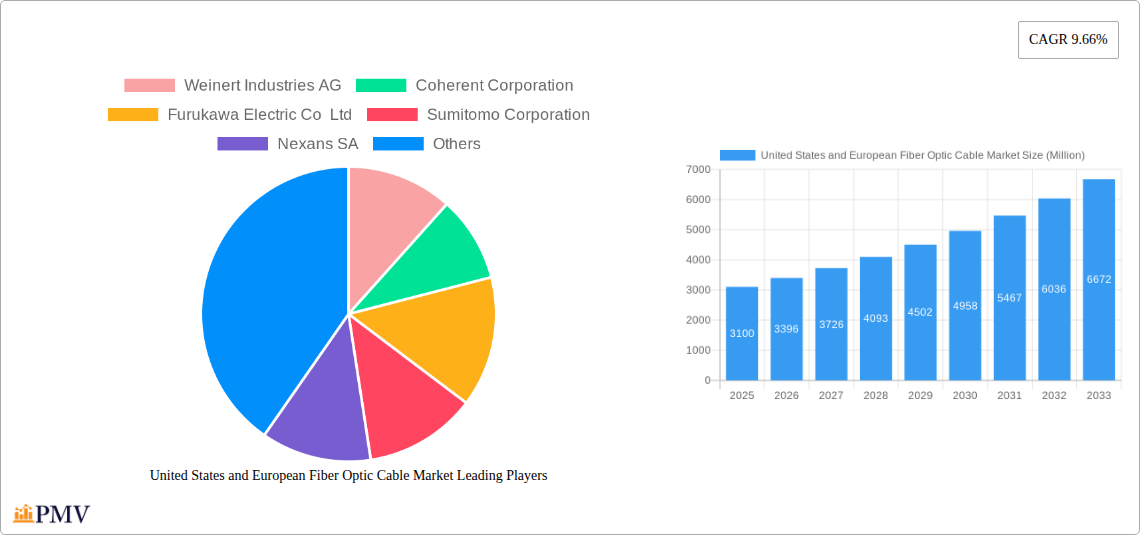
United States and European Fiber Optic Cable Market Market Size (In Billion)

Within this thriving market, the United States and key European nations such as Germany demonstrate strong individual market growth. The US benefits from substantial private investment in technological infrastructure and a large consumer base driving the demand for high-bandwidth connectivity. Germany, a leading European economy, enjoys a highly developed telecommunications infrastructure, enabling further expansion within existing networks and facilitating the adoption of new technologies. Other European countries like the UK, France, and Italy contribute significantly to the regional market, each with its own specific growth drivers. The relatively robust economies of Austria and Switzerland also contribute to the overall European market size, though their individual market shares may be smaller compared to larger nations within the region. The diverse end-user industries, including telecommunications, power utilities, defense, and medical, offer substantial growth opportunities for fiber optic cable manufacturers across both regions.

United States and European Fiber Optic Cable Market Company Market Share
United States and European Fiber Optic Cable Market: A Comprehensive Report (2019-2033)
This in-depth report provides a comprehensive analysis of the United States and European fiber optic cable market, covering the period from 2019 to 2033. With a focus on key market segments, competitive dynamics, and future growth prospects, this report is an essential resource for industry professionals, investors, and strategic decision-makers. The study period encompasses the historical period (2019-2024), the base year (2025), and the forecast period (2025-2033). Market values are expressed in Millions.
United States and European Fiber Optic Cable Market Market Structure & Competitive Dynamics
The United States and European fiber optic cable market exhibits a moderately concentrated structure, with several major players holding significant market share. The market is characterized by intense competition, driven by technological innovation and increasing demand. Regulatory frameworks, particularly those related to infrastructure development and data privacy, significantly impact market dynamics. Product substitutes, such as wireless communication technologies, present a competitive challenge, though fiber optic cables continue to maintain a dominant position due to their superior bandwidth and security.
End-user trends indicate a strong preference for high-bandwidth, low-latency solutions, particularly within the telecommunications sector. Mergers and acquisitions (M&A) activity has been relatively robust in recent years, with several major players consolidating their positions through strategic acquisitions. For example, while precise M&A deal values are not publicly available for every transaction, estimates suggest a total M&A value of approximately xx Million across the studied period. Market share distribution shows a relatively even spread amongst the top players, with Corning Inc, Prysmian Group, and Nexans SA holding the largest shares, estimated at xx%, xx%, and xx%, respectively. Smaller players actively participate through innovation and niche specialization.
- Market Concentration: Moderately concentrated
- Innovation Ecosystems: Active, driven by technological advancements
- Regulatory Frameworks: Significant impact on infrastructure projects
- Product Substitutes: Wireless technologies pose a moderate threat
- End-User Trends: Strong preference for high-bandwidth solutions
- M&A Activity: Significant consolidation within the sector
United States and European Fiber Optic Cable Market Industry Trends & Insights
The United States and European fiber optic cable market is experiencing robust growth, driven by the increasing demand for high-speed data transmission and the expansion of 5G and fiber-to-the-home (FTTH) networks. The Compound Annual Growth Rate (CAGR) during the forecast period (2025-2033) is projected to be xx%, reflecting strong market expansion. Market penetration is also expected to increase significantly, particularly in areas with limited high-speed internet access. Technological disruptions, such as advancements in fiber optic cable manufacturing and the development of new materials, are contributing to improved performance, reduced costs, and increased market competitiveness. Consumer preferences lean towards environmentally friendly solutions and increased reliability, which influences product design and manufacturing processes. The high capital investment and complex technology involved present significant entry barriers for new market entrants and ensure stability for established players. The increasing demand for high bandwidth across all sectors has also strengthened the industry's growth, driving investment in new manufacturing facilities.
Dominant Markets & Segments in United States and European Fiber Optic Cable Market
The telecommunications sector remains the dominant end-user industry for fiber optic cables in both the United States and Europe, accounting for an estimated xx% of the total market value in 2025. The United States represents the largest national market, driven by extensive infrastructure development and the strong growth of the data center industry.
Key Drivers for Telecommunications Dominance:
- Rapid expansion of 5G networks
- Growing demand for high-speed internet access (FTTH)
- Increased data consumption
- Government initiatives promoting digital infrastructure development
Regional Dominance Analysis:
- United States: Strong economic growth, extensive infrastructure projects, and high demand for data centers drive the market.
- Germany: Significant investments in digital infrastructure and a robust industrial sector fuel demand.
- Austria and Switzerland: Smaller market size but with high per capita internet usage, creating strong demand.
- Rest of Europe: A diverse market with varying levels of development and infrastructure investment.
The power utilities sector is also experiencing significant growth, driven by the increasing adoption of smart grids and the need for reliable communication networks. Other end-user segments, including defense/military, industrial, and medical, are also witnessing increasing adoption of fiber optic cables.
United States and European Fiber Optic Cable Market Product Innovations
Recent product developments highlight a trend towards higher fiber density cables with smaller diameters, enabling easier installation and reducing infrastructure costs. For example, Prysmian Group's Sirocco HD micro duct cable, with its 864 fibers in an 11.0 mm diameter, exemplifies this trend. These innovations enhance performance and cost-effectiveness while also addressing the growing need for higher bandwidth and capacity. The market is also seeing innovations in cable materials and manufacturing processes that aim to enhance performance, durability, and environmental sustainability.
Report Segmentation & Scope
The report segments the market by end-user industry (Telecommunication, Power Utilities, Defence/military, Industrial, Medical, Other End-user Industries) and by country (United States, Germany, Austria and Switzerland, Rest of Europe). Each segment's growth projections, market size (in Millions), and competitive dynamics are analyzed separately. The Telecommunications segment is expected to maintain its dominant position, while the Power Utilities sector is projected to show significant growth throughout the forecast period. Regional variations in market growth are largely driven by infrastructure investment and regulatory policies. The US and Germany are forecast to remain the dominant regions.
Key Drivers of United States and European Fiber Optic Cable Market Growth
The market's growth is driven by several key factors:
- Technological Advancements: Continuous innovation in fiber optic technology, leading to higher bandwidth, lower latency, and increased reliability.
- 5G Network Deployment: The widespread rollout of 5G networks requires substantial investment in fiber optic infrastructure.
- Growth of Data Centers: The increasing demand for data storage and processing fuels the need for high-bandwidth connections.
- Government Initiatives: Government support and funding for infrastructure projects, such as FTTH deployments.
Challenges in the United States and European Fiber Optic Cable Market Sector
Several challenges hinder market growth:
- High Initial Investment Costs: The significant capital investment required for fiber optic infrastructure deployment.
- Supply Chain Disruptions: Global supply chain issues can impact the availability and cost of raw materials.
- Competition from Wireless Technologies: Competition from alternative technologies such as wireless communication.
- Regulatory Hurdles: Complex regulatory processes and permitting requirements can slow down project implementation. These factors can delay projects and increase costs by an estimated xx Million annually.
Leading Players in the United States and European Fiber Optic Cable Market Market
- Weinert Industries AG
- Coherent Corporation
- Furukawa Electric Co Ltd
- Sumitomo Corporation
- Nexans SA
- Molex LLC
- Prysmian Group
- Fujikura Ltd
- Sterlite Technologies
- Leoni AG
- Folan
- Corning Inc
- Finisar Corporation
- Smiths Interconnect (Smiths Group PLC)
Key Developments in United States and European Fiber Optic Cable Market Sector
- August 2022: Corning Incorporated announced expansion of optical cable manufacturing capacity in Gilbert, Arizona.
- October 2022: STL announced plans to establish a U.S. cable manufacturing plant in South Carolina.
- January 2023: Prysmian Group introduced an 864-fiber Sirocco HD micro duct cable.
Strategic United States and European Fiber Optic Cable Market Market Outlook
The future of the United States and European fiber optic cable market looks bright, driven by ongoing technological advancements, increasing demand for high-speed connectivity, and supportive government policies. Strategic opportunities exist for companies that can innovate in areas such as higher fiber density cables, sustainable materials, and efficient installation techniques. The market is expected to continue its strong growth trajectory, fueled by 5G expansion, cloud computing adoption, and the growing importance of digital infrastructure. The continued investment in fiber optic infrastructure by telecommunications companies and governments will further boost the market’s future prospects, with potential for significant market expansion in underserved regions.
United States and European Fiber Optic Cable Market Segmentation
-
1. End-user Industry
- 1.1. Telecommunication
- 1.2. Power Utilities
- 1.3. Defence/military
- 1.4. Industrial
- 1.5. Medical
- 1.6. Other End-user Industries
United States and European Fiber Optic Cable Market Segmentation By Geography
- 1. United States
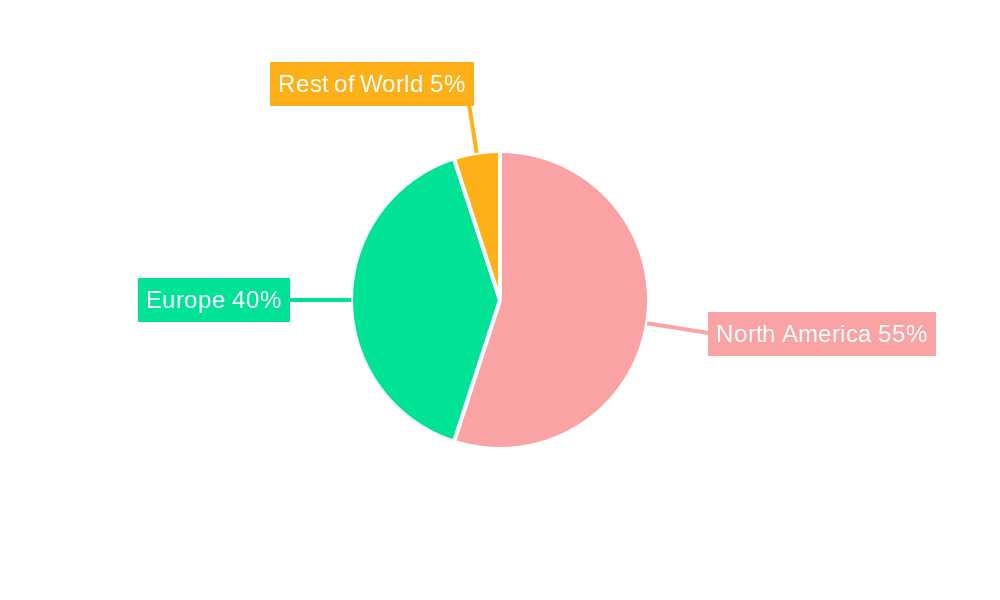
United States and European Fiber Optic Cable Market Regional Market Share
Geographic Coverage of United States and European Fiber Optic Cable Market
United States and European Fiber Optic Cable Market REPORT HIGHLIGHTS
| Aspects | Details |
|---|---|
| Study Period | 2020-2034 |
| Base Year | 2025 |
| Estimated Year | 2026 |
| Forecast Period | 2026-2034 |
| Historical Period | 2020-2025 |
| Growth Rate | CAGR of 9.66% from 2020-2034 |
| Segmentation |
|
Table of Contents
- 1. Introduction
- 1.1. Research Scope
- 1.2. Market Segmentation
- 1.3. Research Methodology
- 1.4. Definitions and Assumptions
- 2. Executive Summary
- 2.1. Introduction
- 3. Market Dynamics
- 3.1. Introduction
- 3.2. Market Drivers
- 3.2.1. The Increased Data Traffic Creates the Demand for Fiber Optic Cable Network; Rising Investment in Fiber Optic and 5G Deployment
- 3.3. Market Restrains
- 3.3.1. Negative Statistics Due to the Regulatory Risks and Technological Changes
- 3.4. Market Trends
- 3.4.1. Rising Investment in Fiber Optic and 5G Deployment Drives the Market
- 4. Market Factor Analysis
- 4.1. Porters Five Forces
- 4.2. Supply/Value Chain
- 4.3. PESTEL analysis
- 4.4. Market Entropy
- 4.5. Patent/Trademark Analysis
- 5. United States and European Fiber Optic Cable Market Analysis, Insights and Forecast, 2020-2032
- 5.1. Market Analysis, Insights and Forecast - by End-user Industry
- 5.1.1. Telecommunication
- 5.1.2. Power Utilities
- 5.1.3. Defence/military
- 5.1.4. Industrial
- 5.1.5. Medical
- 5.1.6. Other End-user Industries
- 5.2. Market Analysis, Insights and Forecast - by Region
- 5.2.1. United States
- 5.1. Market Analysis, Insights and Forecast - by End-user Industry
- 6. Competitive Analysis
- 6.1. Market Share Analysis 2025
- 6.2. Company Profiles
- 6.2.1 Weinert Industries AG
- 6.2.1.1. Overview
- 6.2.1.2. Products
- 6.2.1.3. SWOT Analysis
- 6.2.1.4. Recent Developments
- 6.2.1.5. Financials (Based on Availability)
- 6.2.2 Coherent Corporation
- 6.2.2.1. Overview
- 6.2.2.2. Products
- 6.2.2.3. SWOT Analysis
- 6.2.2.4. Recent Developments
- 6.2.2.5. Financials (Based on Availability)
- 6.2.3 Furukawa Electric Co Ltd
- 6.2.3.1. Overview
- 6.2.3.2. Products
- 6.2.3.3. SWOT Analysis
- 6.2.3.4. Recent Developments
- 6.2.3.5. Financials (Based on Availability)
- 6.2.4 Sumitomo Corporation
- 6.2.4.1. Overview
- 6.2.4.2. Products
- 6.2.4.3. SWOT Analysis
- 6.2.4.4. Recent Developments
- 6.2.4.5. Financials (Based on Availability)
- 6.2.5 Nexans SA
- 6.2.5.1. Overview
- 6.2.5.2. Products
- 6.2.5.3. SWOT Analysis
- 6.2.5.4. Recent Developments
- 6.2.5.5. Financials (Based on Availability)
- 6.2.6 Molex LLC
- 6.2.6.1. Overview
- 6.2.6.2. Products
- 6.2.6.3. SWOT Analysis
- 6.2.6.4. Recent Developments
- 6.2.6.5. Financials (Based on Availability)
- 6.2.7 Prysmian Group
- 6.2.7.1. Overview
- 6.2.7.2. Products
- 6.2.7.3. SWOT Analysis
- 6.2.7.4. Recent Developments
- 6.2.7.5. Financials (Based on Availability)
- 6.2.8 Fujikura Ltd
- 6.2.8.1. Overview
- 6.2.8.2. Products
- 6.2.8.3. SWOT Analysis
- 6.2.8.4. Recent Developments
- 6.2.8.5. Financials (Based on Availability)
- 6.2.9 Sterlite Technologies
- 6.2.9.1. Overview
- 6.2.9.2. Products
- 6.2.9.3. SWOT Analysis
- 6.2.9.4. Recent Developments
- 6.2.9.5. Financials (Based on Availability)
- 6.2.10 Leoni AG
- 6.2.10.1. Overview
- 6.2.10.2. Products
- 6.2.10.3. SWOT Analysis
- 6.2.10.4. Recent Developments
- 6.2.10.5. Financials (Based on Availability)
- 6.2.11 Folan
- 6.2.11.1. Overview
- 6.2.11.2. Products
- 6.2.11.3. SWOT Analysis
- 6.2.11.4. Recent Developments
- 6.2.11.5. Financials (Based on Availability)
- 6.2.12 Corning Inc
- 6.2.12.1. Overview
- 6.2.12.2. Products
- 6.2.12.3. SWOT Analysis
- 6.2.12.4. Recent Developments
- 6.2.12.5. Financials (Based on Availability)
- 6.2.13 Finisar Corporation
- 6.2.13.1. Overview
- 6.2.13.2. Products
- 6.2.13.3. SWOT Analysis
- 6.2.13.4. Recent Developments
- 6.2.13.5. Financials (Based on Availability)
- 6.2.14 Smiths Interconnect (Smiths Group PLC
- 6.2.14.1. Overview
- 6.2.14.2. Products
- 6.2.14.3. SWOT Analysis
- 6.2.14.4. Recent Developments
- 6.2.14.5. Financials (Based on Availability)
- 6.2.1 Weinert Industries AG
List of Figures
- Figure 1: United States and European Fiber Optic Cable Market Revenue Breakdown (Million, %) by Product 2025 & 2033
- Figure 2: United States and European Fiber Optic Cable Market Share (%) by Company 2025
List of Tables
- Table 1: United States and European Fiber Optic Cable Market Revenue Million Forecast, by End-user Industry 2020 & 2033
- Table 2: United States and European Fiber Optic Cable Market Revenue Million Forecast, by Region 2020 & 2033
- Table 3: United States and European Fiber Optic Cable Market Revenue Million Forecast, by End-user Industry 2020 & 2033
- Table 4: United States and European Fiber Optic Cable Market Revenue Million Forecast, by Country 2020 & 2033
Frequently Asked Questions
1. What is the projected Compound Annual Growth Rate (CAGR) of the United States and European Fiber Optic Cable Market?
The projected CAGR is approximately 9.66%.
2. Which companies are prominent players in the United States and European Fiber Optic Cable Market?
Key companies in the market include Weinert Industries AG, Coherent Corporation, Furukawa Electric Co Ltd, Sumitomo Corporation, Nexans SA, Molex LLC, Prysmian Group, Fujikura Ltd, Sterlite Technologies, Leoni AG, Folan, Corning Inc, Finisar Corporation, Smiths Interconnect (Smiths Group PLC.
3. What are the main segments of the United States and European Fiber Optic Cable Market?
The market segments include End-user Industry.
4. Can you provide details about the market size?
The market size is estimated to be USD 3.10 Million as of 2022.
5. What are some drivers contributing to market growth?
The Increased Data Traffic Creates the Demand for Fiber Optic Cable Network; Rising Investment in Fiber Optic and 5G Deployment.
6. What are the notable trends driving market growth?
Rising Investment in Fiber Optic and 5G Deployment Drives the Market.
7. Are there any restraints impacting market growth?
Negative Statistics Due to the Regulatory Risks and Technological Changes.
8. Can you provide examples of recent developments in the market?
January 2023 - Italy-based Prysmian Group introduced an 864-fiber version of its Sirocco HD micro duct cables. The new cable squeezes 864 fibers into a diameter of 11.0 mm, which produces a fiber density of 9.1 fibers per square millimeter. The fiber cable can be installed in a 13-mm duct.
9. What pricing options are available for accessing the report?
Pricing options include single-user, multi-user, and enterprise licenses priced at USD 4750, USD 4950, and USD 6800 respectively.
10. Is the market size provided in terms of value or volume?
The market size is provided in terms of value, measured in Million.
11. Are there any specific market keywords associated with the report?
Yes, the market keyword associated with the report is "United States and European Fiber Optic Cable Market," which aids in identifying and referencing the specific market segment covered.
12. How do I determine which pricing option suits my needs best?
The pricing options vary based on user requirements and access needs. Individual users may opt for single-user licenses, while businesses requiring broader access may choose multi-user or enterprise licenses for cost-effective access to the report.
13. Are there any additional resources or data provided in the United States and European Fiber Optic Cable Market report?
While the report offers comprehensive insights, it's advisable to review the specific contents or supplementary materials provided to ascertain if additional resources or data are available.
14. How can I stay updated on further developments or reports in the United States and European Fiber Optic Cable Market?
To stay informed about further developments, trends, and reports in the United States and European Fiber Optic Cable Market, consider subscribing to industry newsletters, following relevant companies and organizations, or regularly checking reputable industry news sources and publications.
Methodology
Step 1 - Identification of Relevant Samples Size from Population Database


Step 2 - Approaches for Defining Global Market Size (Value, Volume* & Price*)

Note*: In applicable scenarios
Step 3 - Data Sources
Primary Research
- Web Analytics
- Survey Reports
- Research Institute
- Latest Research Reports
- Opinion Leaders
Secondary Research
- Annual Reports
- White Paper
- Latest Press Release
- Industry Association
- Paid Database
- Investor Presentations

Step 4 - Data Triangulation
Involves using different sources of information in order to increase the validity of a study
These sources are likely to be stakeholders in a program - participants, other researchers, program staff, other community members, and so on.
Then we put all data in single framework & apply various statistical tools to find out the dynamic on the market.
During the analysis stage, feedback from the stakeholder groups would be compared to determine areas of agreement as well as areas of divergence