
Key Insights
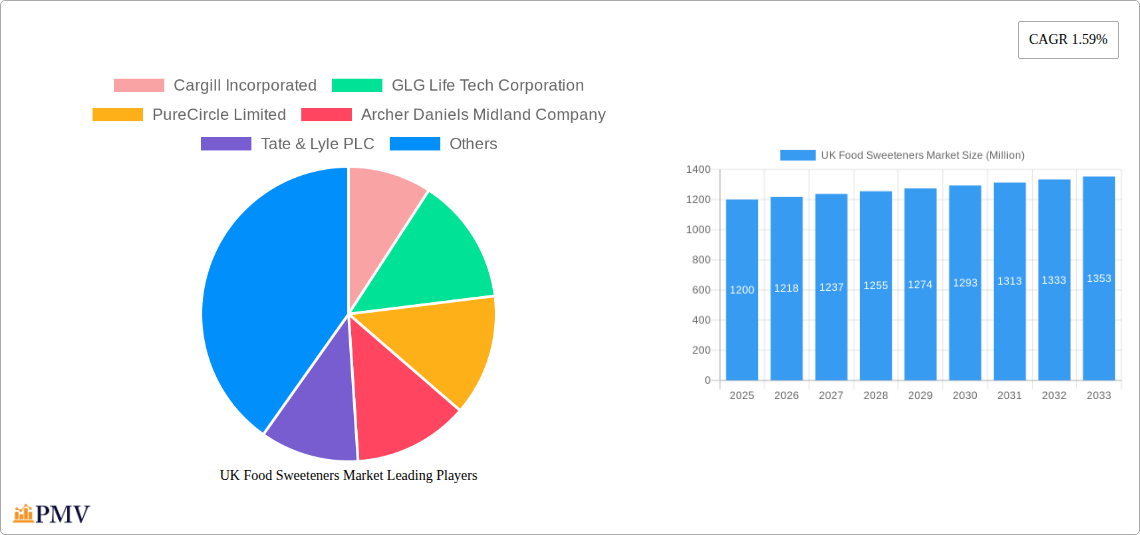
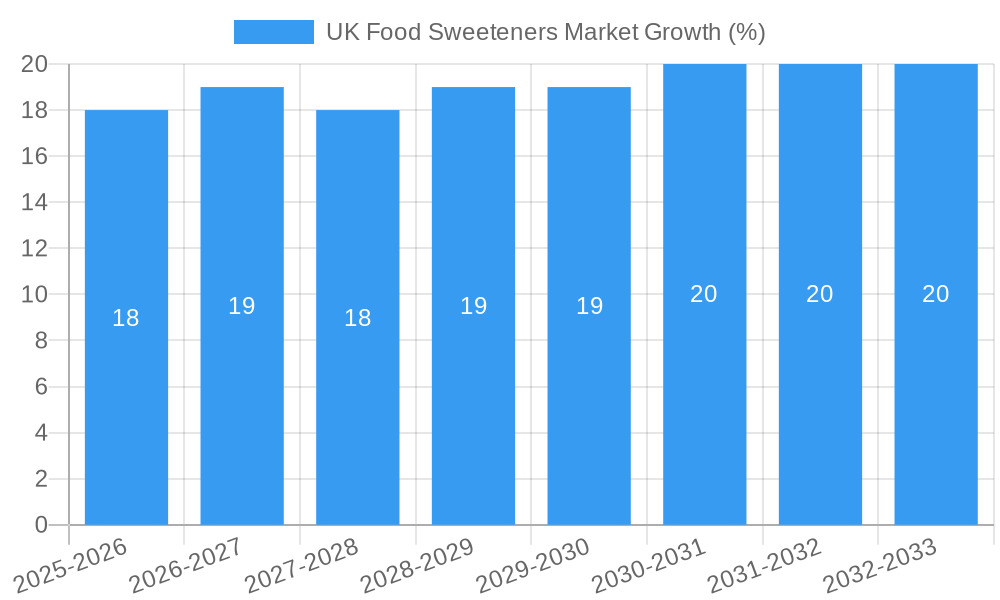
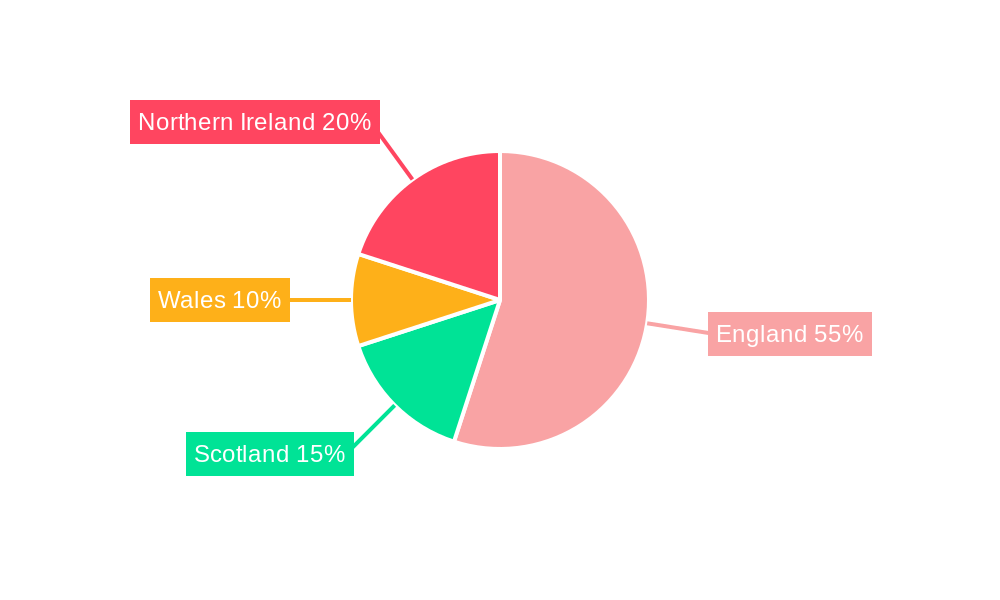
The UK food sweeteners market, valued at approximately £1.2 billion in 2025, is projected to experience steady growth, driven primarily by the increasing demand for low-calorie and sugar-free food products. This surge is fueled by rising health consciousness among consumers, particularly concerning obesity and diabetes. The market is segmented by product type, including sucrose, starch sweeteners (such as high-fructose corn syrup and glucose syrups), sugar alcohols (xylitol, sorbitol, etc.), and high-intensity sweeteners (HIS) like stevia and sucralose. Application-wise, significant demand comes from the dairy, bakery, confectionery, and beverage industries. Major players like Cargill, Tate & Lyle, and Ingredion are shaping the market through product innovation and strategic partnerships. While the market faces constraints such as fluctuating raw material prices and stringent regulatory approvals for new sweeteners, the long-term outlook remains positive, projected to reach approximately £1.4 billion by 2033, driven by product diversification and increased adoption of natural and healthier sweeteners. The increasing focus on clean-label products and the growing popularity of functional foods further contribute to this growth trajectory. Regional variations within the UK, such as consumer preferences across England, Scotland, Wales, and Northern Ireland, also influence market dynamics, necessitating tailored product offerings and marketing strategies.
The continued expansion of the food and beverage sector coupled with changing consumer preferences towards healthier options will further propel the market's growth. The rise in demand for convenience foods and ready-to-eat meals, many of which utilize sweeteners, presents a significant opportunity. The focus on reducing added sugar in processed foods is expected to drive the adoption of alternative sweeteners, particularly high-intensity sweeteners and sugar alcohols, while the market for sucrose will likely experience a slower growth rate compared to these alternatives. The competitive landscape is dynamic, with existing players continually investing in R&D to enhance product offerings and expand their market share, driving innovation in both the types of sweeteners and their applications within various food products. This competitive landscape, coupled with the ongoing consumer demand shift, creates both opportunities and challenges for players across the value chain.
UK Food Sweeteners Market: A Comprehensive Market Report (2019-2033)
This in-depth report provides a comprehensive analysis of the UK food sweeteners market, offering invaluable insights for businesses, investors, and stakeholders seeking to understand this dynamic sector. The study covers the period 2019-2033, with 2025 serving as the base and estimated year. The report leverages extensive primary and secondary research to deliver actionable intelligence, forecasting market trends and growth opportunities. The market size in 2025 is estimated at £XX Million and is projected to reach £XX Million by 2033, exhibiting a CAGR of xx% during the forecast period (2025-2033).
UK Food Sweeteners Market Market Structure & Competitive Dynamics
The UK food sweeteners market is characterized by a moderately concentrated structure, with key players like Cargill Incorporated, Cargill Incorporated, GLG Life Tech Corporation, PureCircle Limited, Archer Daniels Midland Company, Archer Daniels Midland Company, Tate & Lyle PLC, Tate & Lyle PLC, DuPont, Ingredion Incorporated, and Tereos S.A. holding significant market share. However, the presence of numerous smaller players and private labels fosters a competitive landscape. Market share analysis reveals that the top five players collectively account for approximately xx% of the total market.
Innovation within the sector is driven by the increasing demand for healthier alternatives, leading to the development of novel sweeteners with reduced calorie content and improved functional properties. Regulatory frameworks, particularly those concerning labeling and health claims, play a crucial role in shaping market dynamics. The market experiences significant influence from product substitutes, such as stevia and monk fruit extracts, which are gaining popularity due to their natural origins and perceived health benefits. End-user trends, such as the growing preference for healthier food and beverages, heavily impact market demand. M&A activities have been relatively infrequent in recent years, with total deal value estimated at £xx Million during the historical period (2019-2024), but consolidation is expected to increase with market maturation. The average deal size was approximately £xx Million.
UK Food Sweeteners Market Industry Trends & Insights
The UK food sweeteners market is experiencing robust growth, primarily fueled by the rising demand for convenient and ready-to-eat foods. Technological advancements, such as the development of high-intensity sweeteners (HIS) with improved taste profiles and functionalities, are further driving market expansion. Consumer preferences are shifting towards healthier options, with a heightened focus on reducing sugar intake. This trend is boosting the demand for low-calorie and sugar-free sweeteners, particularly in the beverage and confectionery segments. Competitive dynamics are characterized by intense rivalry among established players and the emergence of innovative smaller firms offering unique product propositions. The market has witnessed a notable increase in product diversification, with manufacturers introducing novel sweetener blends and formulations. The market penetration of HIS is steadily increasing, with a projected market share of xx% by 2033.
Dominant Markets & Segments in UK Food Sweeteners Market
The UK food sweeteners market is segmented by product type (Sucrose, Starch Sweeteners and Sugar Alcohols, High Intensity Sweeteners (HIS)) and application (Dairy, Bakery, Soups, Sauces and Dressings, Confectionery, Beverages, Other Applications).
By Product Type: High-intensity sweeteners (HIS) are witnessing the fastest growth, driven by their ability to deliver sweetness with minimal caloric impact. Sucrose remains a dominant segment due to its widespread use and cost-effectiveness. Starch sweeteners and sugar alcohols hold a significant market share, providing bulk and texture modification capabilities.
By Application: The beverages segment currently dominates the market, due to the widespread use of sweeteners in soft drinks, juices, and other beverages. The confectionery segment also holds a substantial market share, followed by the dairy and bakery sectors. Growth in the ready-to-drink beverage segment is driving demand.
Key Drivers:
- Economic factors: Consumer spending patterns, disposable incomes, and economic growth influence sweetener consumption.
- Regulatory landscape: Government regulations concerning labeling, health claims, and sugar content influence product formulations and market dynamics.
- Infrastructure: Availability of robust supply chains and distribution networks supports market expansion.
UK Food Sweeteners Market Product Innovations
Recent innovations in the UK food sweeteners market focus on developing sweeteners with improved taste profiles, functionalities, and health attributes. Technological advancements, such as the utilization of biotechnology and precision fermentation techniques, are enhancing the production of novel sweeteners. These innovations aim to cater to the growing consumer demand for healthier, natural, and functional food and beverage options. The market is also witnessing the emergence of blends combining various sweetener types to achieve optimal taste and functional characteristics. This trend aims to capture market share by offering unique sweetener combinations that meet consumer needs.
Report Segmentation & Scope
This report provides a detailed segmentation of the UK food sweeteners market across various categories:
By Product Type: Sucrose, Starch Sweeteners and Sugar Alcohols (including maltodextrins, polyols), and High Intensity Sweeteners (HIS) including stevia, sucralose, aspartame, and others. Each segment's growth projections, market size, and competitive dynamics are analyzed.
By Application: Dairy, Bakery, Soups, Sauces and Dressings, Confectionery, Beverages, and Other Applications. Each segment's market size, growth drivers, and key players are thoroughly evaluated.
Key Drivers of UK Food Sweeteners Market Growth
Several key factors are driving the growth of the UK food sweeteners market:
- The rising demand for convenient and ready-to-eat foods is a major driver.
- The increasing preference for low-calorie and sugar-free products is boosting the demand for alternative sweeteners.
- Technological advancements are resulting in more sophisticated and effective sweeteners with improved taste profiles and functionalities.
Challenges in the UK Food Sweeteners Market Sector
The UK food sweeteners market faces various challenges, including:
- Stringent regulatory requirements and labelling standards impose constraints on product development and marketing.
- Fluctuations in raw material prices and supply chain disruptions can impact production costs and profitability.
- Intense competition among existing players and the entry of new participants are creating pressure on profit margins.
Leading Players in the UK Food Sweeteners Market Market
- Cargill Incorporated
- GLG Life Tech Corporation
- PureCircle Limited
- Archer Daniels Midland Company
- Tate & Lyle PLC
- DuPont
- Ingredion Incorporated
- Tereos S A
- List Not Exhaustive
Key Developments in UK Food Sweeteners Market Sector
- 2022 Q3: Launch of a new stevia-based sweetener by a major player, emphasizing natural and clean-label attributes.
- 2023 Q1: Acquisition of a smaller sweetener producer by a larger multinational corporation, aiming to expand product portfolio and market share.
- 2024 Q2: Introduction of a novel sweetener blend combining multiple natural ingredients, highlighting improved taste and functionality.
(Further developments to be added based on available data.)
Strategic UK Food Sweeteners Market Market Outlook
The UK food sweeteners market presents substantial growth potential, driven by continuous innovation, evolving consumer preferences, and the increasing demand for healthier food and beverage options. Strategic opportunities exist for companies focusing on developing innovative, natural, and functional sweeteners. Companies are expected to leverage technological advancements to improve product quality and efficiency, and enhance their supply chain resilience. Strategic alliances and partnerships are likely to play a vital role in driving future market growth and expansion.
UK Food Sweeteners Market Segmentation
-
1. Product Type
- 1.1. Sucrose
-
1.2. Starch Sweeteners and Sugar Alcohols
- 1.2.1. Dextrose
- 1.2.2. High Fructose Corn Syrup (HFCS)
- 1.2.3. Maltodextrin
- 1.2.4. Sorbitol
- 1.2.5. Xylitol
- 1.2.6. Other Starch Sweeteners and Sugar Alcohols
-
1.3. High Intensity Sweeteners (HIS)
- 1.3.1. Sucralose
- 1.3.2. Aspartame
- 1.3.3. Saccharin
- 1.3.4. Cyclamate
- 1.3.5. Ace-K
- 1.3.6. Neotame
- 1.3.7. Stevia
- 1.3.8. Other High Intensity Sweeteners
-
2. Application
- 2.1. Dairy
- 2.2. Bakery
- 2.3. Soups, Sauces and Dressings
- 2.4. Confectionery
- 2.5. Beverages
- 2.6. Other Applications
UK Food Sweeteners Market Segmentation By Geography
-
1. North America
- 1.1. United States
- 1.2. Canada
- 1.3. Mexico
-
2. South America
- 2.1. Brazil
- 2.2. Argentina
- 2.3. Rest of South America
-
3. Europe
- 3.1. United Kingdom
- 3.2. Germany
- 3.3. France
- 3.4. Italy
- 3.5. Spain
- 3.6. Russia
- 3.7. Benelux
- 3.8. Nordics
- 3.9. Rest of Europe
-
4. Middle East & Africa
- 4.1. Turkey
- 4.2. Israel
- 4.3. GCC
- 4.4. North Africa
- 4.5. South Africa
- 4.6. Rest of Middle East & Africa
-
5. Asia Pacific
- 5.1. China
- 5.2. India
- 5.3. Japan
- 5.4. South Korea
- 5.5. ASEAN
- 5.6. Oceania
- 5.7. Rest of Asia Pacific
UK Food Sweeteners Market REPORT HIGHLIGHTS
| Aspects | Details |
|---|---|
| Study Period | 2019-2033 |
| Base Year | 2024 |
| Estimated Year | 2025 |
| Forecast Period | 2025-2033 |
| Historical Period | 2019-2024 |
| Growth Rate | CAGR of 1.59% from 2019-2033 |
| Segmentation |
|
Table of Contents
- 1. Introduction
- 1.1. Research Scope
- 1.2. Market Segmentation
- 1.3. Research Methodology
- 1.4. Definitions and Assumptions
- 2. Executive Summary
- 2.1. Introduction
- 3. Market Dynamics
- 3.1. Introduction
- 3.2. Market Drivers
- 3.2.1. Rising Application in Dietary Supplements
- 3.3. Market Restrains
- 3.3.1. Increasing prevalence of hydroglycemia
- 3.4. Market Trends
- 3.4.1. Xylitol Accounts For The Largest Share
- 4. Market Factor Analysis
- 4.1. Porters Five Forces
- 4.2. Supply/Value Chain
- 4.3. PESTEL analysis
- 4.4. Market Entropy
- 4.5. Patent/Trademark Analysis
- 5. Global UK Food Sweeteners Market Analysis, Insights and Forecast, 2019-2031
- 5.1. Market Analysis, Insights and Forecast - by Product Type
- 5.1.1. Sucrose
- 5.1.2. Starch Sweeteners and Sugar Alcohols
- 5.1.2.1. Dextrose
- 5.1.2.2. High Fructose Corn Syrup (HFCS)
- 5.1.2.3. Maltodextrin
- 5.1.2.4. Sorbitol
- 5.1.2.5. Xylitol
- 5.1.2.6. Other Starch Sweeteners and Sugar Alcohols
- 5.1.3. High Intensity Sweeteners (HIS)
- 5.1.3.1. Sucralose
- 5.1.3.2. Aspartame
- 5.1.3.3. Saccharin
- 5.1.3.4. Cyclamate
- 5.1.3.5. Ace-K
- 5.1.3.6. Neotame
- 5.1.3.7. Stevia
- 5.1.3.8. Other High Intensity Sweeteners
- 5.2. Market Analysis, Insights and Forecast - by Application
- 5.2.1. Dairy
- 5.2.2. Bakery
- 5.2.3. Soups, Sauces and Dressings
- 5.2.4. Confectionery
- 5.2.5. Beverages
- 5.2.6. Other Applications
- 5.3. Market Analysis, Insights and Forecast - by Region
- 5.3.1. North America
- 5.3.2. South America
- 5.3.3. Europe
- 5.3.4. Middle East & Africa
- 5.3.5. Asia Pacific
- 5.1. Market Analysis, Insights and Forecast - by Product Type
- 6. North America UK Food Sweeteners Market Analysis, Insights and Forecast, 2019-2031
- 6.1. Market Analysis, Insights and Forecast - by Product Type
- 6.1.1. Sucrose
- 6.1.2. Starch Sweeteners and Sugar Alcohols
- 6.1.2.1. Dextrose
- 6.1.2.2. High Fructose Corn Syrup (HFCS)
- 6.1.2.3. Maltodextrin
- 6.1.2.4. Sorbitol
- 6.1.2.5. Xylitol
- 6.1.2.6. Other Starch Sweeteners and Sugar Alcohols
- 6.1.3. High Intensity Sweeteners (HIS)
- 6.1.3.1. Sucralose
- 6.1.3.2. Aspartame
- 6.1.3.3. Saccharin
- 6.1.3.4. Cyclamate
- 6.1.3.5. Ace-K
- 6.1.3.6. Neotame
- 6.1.3.7. Stevia
- 6.1.3.8. Other High Intensity Sweeteners
- 6.2. Market Analysis, Insights and Forecast - by Application
- 6.2.1. Dairy
- 6.2.2. Bakery
- 6.2.3. Soups, Sauces and Dressings
- 6.2.4. Confectionery
- 6.2.5. Beverages
- 6.2.6. Other Applications
- 6.1. Market Analysis, Insights and Forecast - by Product Type
- 7. South America UK Food Sweeteners Market Analysis, Insights and Forecast, 2019-2031
- 7.1. Market Analysis, Insights and Forecast - by Product Type
- 7.1.1. Sucrose
- 7.1.2. Starch Sweeteners and Sugar Alcohols
- 7.1.2.1. Dextrose
- 7.1.2.2. High Fructose Corn Syrup (HFCS)
- 7.1.2.3. Maltodextrin
- 7.1.2.4. Sorbitol
- 7.1.2.5. Xylitol
- 7.1.2.6. Other Starch Sweeteners and Sugar Alcohols
- 7.1.3. High Intensity Sweeteners (HIS)
- 7.1.3.1. Sucralose
- 7.1.3.2. Aspartame
- 7.1.3.3. Saccharin
- 7.1.3.4. Cyclamate
- 7.1.3.5. Ace-K
- 7.1.3.6. Neotame
- 7.1.3.7. Stevia
- 7.1.3.8. Other High Intensity Sweeteners
- 7.2. Market Analysis, Insights and Forecast - by Application
- 7.2.1. Dairy
- 7.2.2. Bakery
- 7.2.3. Soups, Sauces and Dressings
- 7.2.4. Confectionery
- 7.2.5. Beverages
- 7.2.6. Other Applications
- 7.1. Market Analysis, Insights and Forecast - by Product Type
- 8. Europe UK Food Sweeteners Market Analysis, Insights and Forecast, 2019-2031
- 8.1. Market Analysis, Insights and Forecast - by Product Type
- 8.1.1. Sucrose
- 8.1.2. Starch Sweeteners and Sugar Alcohols
- 8.1.2.1. Dextrose
- 8.1.2.2. High Fructose Corn Syrup (HFCS)
- 8.1.2.3. Maltodextrin
- 8.1.2.4. Sorbitol
- 8.1.2.5. Xylitol
- 8.1.2.6. Other Starch Sweeteners and Sugar Alcohols
- 8.1.3. High Intensity Sweeteners (HIS)
- 8.1.3.1. Sucralose
- 8.1.3.2. Aspartame
- 8.1.3.3. Saccharin
- 8.1.3.4. Cyclamate
- 8.1.3.5. Ace-K
- 8.1.3.6. Neotame
- 8.1.3.7. Stevia
- 8.1.3.8. Other High Intensity Sweeteners
- 8.2. Market Analysis, Insights and Forecast - by Application
- 8.2.1. Dairy
- 8.2.2. Bakery
- 8.2.3. Soups, Sauces and Dressings
- 8.2.4. Confectionery
- 8.2.5. Beverages
- 8.2.6. Other Applications
- 8.1. Market Analysis, Insights and Forecast - by Product Type
- 9. Middle East & Africa UK Food Sweeteners Market Analysis, Insights and Forecast, 2019-2031
- 9.1. Market Analysis, Insights and Forecast - by Product Type
- 9.1.1. Sucrose
- 9.1.2. Starch Sweeteners and Sugar Alcohols
- 9.1.2.1. Dextrose
- 9.1.2.2. High Fructose Corn Syrup (HFCS)
- 9.1.2.3. Maltodextrin
- 9.1.2.4. Sorbitol
- 9.1.2.5. Xylitol
- 9.1.2.6. Other Starch Sweeteners and Sugar Alcohols
- 9.1.3. High Intensity Sweeteners (HIS)
- 9.1.3.1. Sucralose
- 9.1.3.2. Aspartame
- 9.1.3.3. Saccharin
- 9.1.3.4. Cyclamate
- 9.1.3.5. Ace-K
- 9.1.3.6. Neotame
- 9.1.3.7. Stevia
- 9.1.3.8. Other High Intensity Sweeteners
- 9.2. Market Analysis, Insights and Forecast - by Application
- 9.2.1. Dairy
- 9.2.2. Bakery
- 9.2.3. Soups, Sauces and Dressings
- 9.2.4. Confectionery
- 9.2.5. Beverages
- 9.2.6. Other Applications
- 9.1. Market Analysis, Insights and Forecast - by Product Type
- 10. Asia Pacific UK Food Sweeteners Market Analysis, Insights and Forecast, 2019-2031
- 10.1. Market Analysis, Insights and Forecast - by Product Type
- 10.1.1. Sucrose
- 10.1.2. Starch Sweeteners and Sugar Alcohols
- 10.1.2.1. Dextrose
- 10.1.2.2. High Fructose Corn Syrup (HFCS)
- 10.1.2.3. Maltodextrin
- 10.1.2.4. Sorbitol
- 10.1.2.5. Xylitol
- 10.1.2.6. Other Starch Sweeteners and Sugar Alcohols
- 10.1.3. High Intensity Sweeteners (HIS)
- 10.1.3.1. Sucralose
- 10.1.3.2. Aspartame
- 10.1.3.3. Saccharin
- 10.1.3.4. Cyclamate
- 10.1.3.5. Ace-K
- 10.1.3.6. Neotame
- 10.1.3.7. Stevia
- 10.1.3.8. Other High Intensity Sweeteners
- 10.2. Market Analysis, Insights and Forecast - by Application
- 10.2.1. Dairy
- 10.2.2. Bakery
- 10.2.3. Soups, Sauces and Dressings
- 10.2.4. Confectionery
- 10.2.5. Beverages
- 10.2.6. Other Applications
- 10.1. Market Analysis, Insights and Forecast - by Product Type
- 11. England UK Food Sweeteners Market Analysis, Insights and Forecast, 2019-2031
- 12. Wales UK Food Sweeteners Market Analysis, Insights and Forecast, 2019-2031
- 13. Scotland UK Food Sweeteners Market Analysis, Insights and Forecast, 2019-2031
- 14. Northern UK Food Sweeteners Market Analysis, Insights and Forecast, 2019-2031
- 15. Ireland UK Food Sweeteners Market Analysis, Insights and Forecast, 2019-2031
- 16. Competitive Analysis
- 16.1. Global Market Share Analysis 2024
- 16.2. Company Profiles
- 16.2.1 Cargill Incorporated
- 16.2.1.1. Overview
- 16.2.1.2. Products
- 16.2.1.3. SWOT Analysis
- 16.2.1.4. Recent Developments
- 16.2.1.5. Financials (Based on Availability)
- 16.2.2 GLG Life Tech Corporation
- 16.2.2.1. Overview
- 16.2.2.2. Products
- 16.2.2.3. SWOT Analysis
- 16.2.2.4. Recent Developments
- 16.2.2.5. Financials (Based on Availability)
- 16.2.3 PureCircle Limited
- 16.2.3.1. Overview
- 16.2.3.2. Products
- 16.2.3.3. SWOT Analysis
- 16.2.3.4. Recent Developments
- 16.2.3.5. Financials (Based on Availability)
- 16.2.4 Archer Daniels Midland Company
- 16.2.4.1. Overview
- 16.2.4.2. Products
- 16.2.4.3. SWOT Analysis
- 16.2.4.4. Recent Developments
- 16.2.4.5. Financials (Based on Availability)
- 16.2.5 Tate & Lyle PLC
- 16.2.5.1. Overview
- 16.2.5.2. Products
- 16.2.5.3. SWOT Analysis
- 16.2.5.4. Recent Developments
- 16.2.5.5. Financials (Based on Availability)
- 16.2.6 DuPont
- 16.2.6.1. Overview
- 16.2.6.2. Products
- 16.2.6.3. SWOT Analysis
- 16.2.6.4. Recent Developments
- 16.2.6.5. Financials (Based on Availability)
- 16.2.7 Ingredion Incorporated
- 16.2.7.1. Overview
- 16.2.7.2. Products
- 16.2.7.3. SWOT Analysis
- 16.2.7.4. Recent Developments
- 16.2.7.5. Financials (Based on Availability)
- 16.2.8 Tereos S A *List Not Exhaustive
- 16.2.8.1. Overview
- 16.2.8.2. Products
- 16.2.8.3. SWOT Analysis
- 16.2.8.4. Recent Developments
- 16.2.8.5. Financials (Based on Availability)
- 16.2.1 Cargill Incorporated
List of Figures
- Figure 1: Global UK Food Sweeteners Market Revenue Breakdown (Million, %) by Region 2024 & 2032
- Figure 2: Global UK Food Sweeteners Market Volume Breakdown (K Tons, %) by Region 2024 & 2032
- Figure 3: United kingdom Region UK Food Sweeteners Market Revenue (Million), by Country 2024 & 2032
- Figure 4: United kingdom Region UK Food Sweeteners Market Volume (K Tons), by Country 2024 & 2032
- Figure 5: United kingdom Region UK Food Sweeteners Market Revenue Share (%), by Country 2024 & 2032
- Figure 6: United kingdom Region UK Food Sweeteners Market Volume Share (%), by Country 2024 & 2032
- Figure 7: North America UK Food Sweeteners Market Revenue (Million), by Product Type 2024 & 2032
- Figure 8: North America UK Food Sweeteners Market Volume (K Tons), by Product Type 2024 & 2032
- Figure 9: North America UK Food Sweeteners Market Revenue Share (%), by Product Type 2024 & 2032
- Figure 10: North America UK Food Sweeteners Market Volume Share (%), by Product Type 2024 & 2032
- Figure 11: North America UK Food Sweeteners Market Revenue (Million), by Application 2024 & 2032
- Figure 12: North America UK Food Sweeteners Market Volume (K Tons), by Application 2024 & 2032
- Figure 13: North America UK Food Sweeteners Market Revenue Share (%), by Application 2024 & 2032
- Figure 14: North America UK Food Sweeteners Market Volume Share (%), by Application 2024 & 2032
- Figure 15: North America UK Food Sweeteners Market Revenue (Million), by Country 2024 & 2032
- Figure 16: North America UK Food Sweeteners Market Volume (K Tons), by Country 2024 & 2032
- Figure 17: North America UK Food Sweeteners Market Revenue Share (%), by Country 2024 & 2032
- Figure 18: North America UK Food Sweeteners Market Volume Share (%), by Country 2024 & 2032
- Figure 19: South America UK Food Sweeteners Market Revenue (Million), by Product Type 2024 & 2032
- Figure 20: South America UK Food Sweeteners Market Volume (K Tons), by Product Type 2024 & 2032
- Figure 21: South America UK Food Sweeteners Market Revenue Share (%), by Product Type 2024 & 2032
- Figure 22: South America UK Food Sweeteners Market Volume Share (%), by Product Type 2024 & 2032
- Figure 23: South America UK Food Sweeteners Market Revenue (Million), by Application 2024 & 2032
- Figure 24: South America UK Food Sweeteners Market Volume (K Tons), by Application 2024 & 2032
- Figure 25: South America UK Food Sweeteners Market Revenue Share (%), by Application 2024 & 2032
- Figure 26: South America UK Food Sweeteners Market Volume Share (%), by Application 2024 & 2032
- Figure 27: South America UK Food Sweeteners Market Revenue (Million), by Country 2024 & 2032
- Figure 28: South America UK Food Sweeteners Market Volume (K Tons), by Country 2024 & 2032
- Figure 29: South America UK Food Sweeteners Market Revenue Share (%), by Country 2024 & 2032
- Figure 30: South America UK Food Sweeteners Market Volume Share (%), by Country 2024 & 2032
- Figure 31: Europe UK Food Sweeteners Market Revenue (Million), by Product Type 2024 & 2032
- Figure 32: Europe UK Food Sweeteners Market Volume (K Tons), by Product Type 2024 & 2032
- Figure 33: Europe UK Food Sweeteners Market Revenue Share (%), by Product Type 2024 & 2032
- Figure 34: Europe UK Food Sweeteners Market Volume Share (%), by Product Type 2024 & 2032
- Figure 35: Europe UK Food Sweeteners Market Revenue (Million), by Application 2024 & 2032
- Figure 36: Europe UK Food Sweeteners Market Volume (K Tons), by Application 2024 & 2032
- Figure 37: Europe UK Food Sweeteners Market Revenue Share (%), by Application 2024 & 2032
- Figure 38: Europe UK Food Sweeteners Market Volume Share (%), by Application 2024 & 2032
- Figure 39: Europe UK Food Sweeteners Market Revenue (Million), by Country 2024 & 2032
- Figure 40: Europe UK Food Sweeteners Market Volume (K Tons), by Country 2024 & 2032
- Figure 41: Europe UK Food Sweeteners Market Revenue Share (%), by Country 2024 & 2032
- Figure 42: Europe UK Food Sweeteners Market Volume Share (%), by Country 2024 & 2032
- Figure 43: Middle East & Africa UK Food Sweeteners Market Revenue (Million), by Product Type 2024 & 2032
- Figure 44: Middle East & Africa UK Food Sweeteners Market Volume (K Tons), by Product Type 2024 & 2032
- Figure 45: Middle East & Africa UK Food Sweeteners Market Revenue Share (%), by Product Type 2024 & 2032
- Figure 46: Middle East & Africa UK Food Sweeteners Market Volume Share (%), by Product Type 2024 & 2032
- Figure 47: Middle East & Africa UK Food Sweeteners Market Revenue (Million), by Application 2024 & 2032
- Figure 48: Middle East & Africa UK Food Sweeteners Market Volume (K Tons), by Application 2024 & 2032
- Figure 49: Middle East & Africa UK Food Sweeteners Market Revenue Share (%), by Application 2024 & 2032
- Figure 50: Middle East & Africa UK Food Sweeteners Market Volume Share (%), by Application 2024 & 2032
- Figure 51: Middle East & Africa UK Food Sweeteners Market Revenue (Million), by Country 2024 & 2032
- Figure 52: Middle East & Africa UK Food Sweeteners Market Volume (K Tons), by Country 2024 & 2032
- Figure 53: Middle East & Africa UK Food Sweeteners Market Revenue Share (%), by Country 2024 & 2032
- Figure 54: Middle East & Africa UK Food Sweeteners Market Volume Share (%), by Country 2024 & 2032
- Figure 55: Asia Pacific UK Food Sweeteners Market Revenue (Million), by Product Type 2024 & 2032
- Figure 56: Asia Pacific UK Food Sweeteners Market Volume (K Tons), by Product Type 2024 & 2032
- Figure 57: Asia Pacific UK Food Sweeteners Market Revenue Share (%), by Product Type 2024 & 2032
- Figure 58: Asia Pacific UK Food Sweeteners Market Volume Share (%), by Product Type 2024 & 2032
- Figure 59: Asia Pacific UK Food Sweeteners Market Revenue (Million), by Application 2024 & 2032
- Figure 60: Asia Pacific UK Food Sweeteners Market Volume (K Tons), by Application 2024 & 2032
- Figure 61: Asia Pacific UK Food Sweeteners Market Revenue Share (%), by Application 2024 & 2032
- Figure 62: Asia Pacific UK Food Sweeteners Market Volume Share (%), by Application 2024 & 2032
- Figure 63: Asia Pacific UK Food Sweeteners Market Revenue (Million), by Country 2024 & 2032
- Figure 64: Asia Pacific UK Food Sweeteners Market Volume (K Tons), by Country 2024 & 2032
- Figure 65: Asia Pacific UK Food Sweeteners Market Revenue Share (%), by Country 2024 & 2032
- Figure 66: Asia Pacific UK Food Sweeteners Market Volume Share (%), by Country 2024 & 2032
List of Tables
- Table 1: Global UK Food Sweeteners Market Revenue Million Forecast, by Region 2019 & 2032
- Table 2: Global UK Food Sweeteners Market Volume K Tons Forecast, by Region 2019 & 2032
- Table 3: Global UK Food Sweeteners Market Revenue Million Forecast, by Product Type 2019 & 2032
- Table 4: Global UK Food Sweeteners Market Volume K Tons Forecast, by Product Type 2019 & 2032
- Table 5: Global UK Food Sweeteners Market Revenue Million Forecast, by Application 2019 & 2032
- Table 6: Global UK Food Sweeteners Market Volume K Tons Forecast, by Application 2019 & 2032
- Table 7: Global UK Food Sweeteners Market Revenue Million Forecast, by Region 2019 & 2032
- Table 8: Global UK Food Sweeteners Market Volume K Tons Forecast, by Region 2019 & 2032
- Table 9: Global UK Food Sweeteners Market Revenue Million Forecast, by Country 2019 & 2032
- Table 10: Global UK Food Sweeteners Market Volume K Tons Forecast, by Country 2019 & 2032
- Table 11: England UK Food Sweeteners Market Revenue (Million) Forecast, by Application 2019 & 2032
- Table 12: England UK Food Sweeteners Market Volume (K Tons) Forecast, by Application 2019 & 2032
- Table 13: Wales UK Food Sweeteners Market Revenue (Million) Forecast, by Application 2019 & 2032
- Table 14: Wales UK Food Sweeteners Market Volume (K Tons) Forecast, by Application 2019 & 2032
- Table 15: Scotland UK Food Sweeteners Market Revenue (Million) Forecast, by Application 2019 & 2032
- Table 16: Scotland UK Food Sweeteners Market Volume (K Tons) Forecast, by Application 2019 & 2032
- Table 17: Northern UK Food Sweeteners Market Revenue (Million) Forecast, by Application 2019 & 2032
- Table 18: Northern UK Food Sweeteners Market Volume (K Tons) Forecast, by Application 2019 & 2032
- Table 19: Ireland UK Food Sweeteners Market Revenue (Million) Forecast, by Application 2019 & 2032
- Table 20: Ireland UK Food Sweeteners Market Volume (K Tons) Forecast, by Application 2019 & 2032
- Table 21: Global UK Food Sweeteners Market Revenue Million Forecast, by Product Type 2019 & 2032
- Table 22: Global UK Food Sweeteners Market Volume K Tons Forecast, by Product Type 2019 & 2032
- Table 23: Global UK Food Sweeteners Market Revenue Million Forecast, by Application 2019 & 2032
- Table 24: Global UK Food Sweeteners Market Volume K Tons Forecast, by Application 2019 & 2032
- Table 25: Global UK Food Sweeteners Market Revenue Million Forecast, by Country 2019 & 2032
- Table 26: Global UK Food Sweeteners Market Volume K Tons Forecast, by Country 2019 & 2032
- Table 27: United States UK Food Sweeteners Market Revenue (Million) Forecast, by Application 2019 & 2032
- Table 28: United States UK Food Sweeteners Market Volume (K Tons) Forecast, by Application 2019 & 2032
- Table 29: Canada UK Food Sweeteners Market Revenue (Million) Forecast, by Application 2019 & 2032
- Table 30: Canada UK Food Sweeteners Market Volume (K Tons) Forecast, by Application 2019 & 2032
- Table 31: Mexico UK Food Sweeteners Market Revenue (Million) Forecast, by Application 2019 & 2032
- Table 32: Mexico UK Food Sweeteners Market Volume (K Tons) Forecast, by Application 2019 & 2032
- Table 33: Global UK Food Sweeteners Market Revenue Million Forecast, by Product Type 2019 & 2032
- Table 34: Global UK Food Sweeteners Market Volume K Tons Forecast, by Product Type 2019 & 2032
- Table 35: Global UK Food Sweeteners Market Revenue Million Forecast, by Application 2019 & 2032
- Table 36: Global UK Food Sweeteners Market Volume K Tons Forecast, by Application 2019 & 2032
- Table 37: Global UK Food Sweeteners Market Revenue Million Forecast, by Country 2019 & 2032
- Table 38: Global UK Food Sweeteners Market Volume K Tons Forecast, by Country 2019 & 2032
- Table 39: Brazil UK Food Sweeteners Market Revenue (Million) Forecast, by Application 2019 & 2032
- Table 40: Brazil UK Food Sweeteners Market Volume (K Tons) Forecast, by Application 2019 & 2032
- Table 41: Argentina UK Food Sweeteners Market Revenue (Million) Forecast, by Application 2019 & 2032
- Table 42: Argentina UK Food Sweeteners Market Volume (K Tons) Forecast, by Application 2019 & 2032
- Table 43: Rest of South America UK Food Sweeteners Market Revenue (Million) Forecast, by Application 2019 & 2032
- Table 44: Rest of South America UK Food Sweeteners Market Volume (K Tons) Forecast, by Application 2019 & 2032
- Table 45: Global UK Food Sweeteners Market Revenue Million Forecast, by Product Type 2019 & 2032
- Table 46: Global UK Food Sweeteners Market Volume K Tons Forecast, by Product Type 2019 & 2032
- Table 47: Global UK Food Sweeteners Market Revenue Million Forecast, by Application 2019 & 2032
- Table 48: Global UK Food Sweeteners Market Volume K Tons Forecast, by Application 2019 & 2032
- Table 49: Global UK Food Sweeteners Market Revenue Million Forecast, by Country 2019 & 2032
- Table 50: Global UK Food Sweeteners Market Volume K Tons Forecast, by Country 2019 & 2032
- Table 51: United Kingdom UK Food Sweeteners Market Revenue (Million) Forecast, by Application 2019 & 2032
- Table 52: United Kingdom UK Food Sweeteners Market Volume (K Tons) Forecast, by Application 2019 & 2032
- Table 53: Germany UK Food Sweeteners Market Revenue (Million) Forecast, by Application 2019 & 2032
- Table 54: Germany UK Food Sweeteners Market Volume (K Tons) Forecast, by Application 2019 & 2032
- Table 55: France UK Food Sweeteners Market Revenue (Million) Forecast, by Application 2019 & 2032
- Table 56: France UK Food Sweeteners Market Volume (K Tons) Forecast, by Application 2019 & 2032
- Table 57: Italy UK Food Sweeteners Market Revenue (Million) Forecast, by Application 2019 & 2032
- Table 58: Italy UK Food Sweeteners Market Volume (K Tons) Forecast, by Application 2019 & 2032
- Table 59: Spain UK Food Sweeteners Market Revenue (Million) Forecast, by Application 2019 & 2032
- Table 60: Spain UK Food Sweeteners Market Volume (K Tons) Forecast, by Application 2019 & 2032
- Table 61: Russia UK Food Sweeteners Market Revenue (Million) Forecast, by Application 2019 & 2032
- Table 62: Russia UK Food Sweeteners Market Volume (K Tons) Forecast, by Application 2019 & 2032
- Table 63: Benelux UK Food Sweeteners Market Revenue (Million) Forecast, by Application 2019 & 2032
- Table 64: Benelux UK Food Sweeteners Market Volume (K Tons) Forecast, by Application 2019 & 2032
- Table 65: Nordics UK Food Sweeteners Market Revenue (Million) Forecast, by Application 2019 & 2032
- Table 66: Nordics UK Food Sweeteners Market Volume (K Tons) Forecast, by Application 2019 & 2032
- Table 67: Rest of Europe UK Food Sweeteners Market Revenue (Million) Forecast, by Application 2019 & 2032
- Table 68: Rest of Europe UK Food Sweeteners Market Volume (K Tons) Forecast, by Application 2019 & 2032
- Table 69: Global UK Food Sweeteners Market Revenue Million Forecast, by Product Type 2019 & 2032
- Table 70: Global UK Food Sweeteners Market Volume K Tons Forecast, by Product Type 2019 & 2032
- Table 71: Global UK Food Sweeteners Market Revenue Million Forecast, by Application 2019 & 2032
- Table 72: Global UK Food Sweeteners Market Volume K Tons Forecast, by Application 2019 & 2032
- Table 73: Global UK Food Sweeteners Market Revenue Million Forecast, by Country 2019 & 2032
- Table 74: Global UK Food Sweeteners Market Volume K Tons Forecast, by Country 2019 & 2032
- Table 75: Turkey UK Food Sweeteners Market Revenue (Million) Forecast, by Application 2019 & 2032
- Table 76: Turkey UK Food Sweeteners Market Volume (K Tons) Forecast, by Application 2019 & 2032
- Table 77: Israel UK Food Sweeteners Market Revenue (Million) Forecast, by Application 2019 & 2032
- Table 78: Israel UK Food Sweeteners Market Volume (K Tons) Forecast, by Application 2019 & 2032
- Table 79: GCC UK Food Sweeteners Market Revenue (Million) Forecast, by Application 2019 & 2032
- Table 80: GCC UK Food Sweeteners Market Volume (K Tons) Forecast, by Application 2019 & 2032
- Table 81: North Africa UK Food Sweeteners Market Revenue (Million) Forecast, by Application 2019 & 2032
- Table 82: North Africa UK Food Sweeteners Market Volume (K Tons) Forecast, by Application 2019 & 2032
- Table 83: South Africa UK Food Sweeteners Market Revenue (Million) Forecast, by Application 2019 & 2032
- Table 84: South Africa UK Food Sweeteners Market Volume (K Tons) Forecast, by Application 2019 & 2032
- Table 85: Rest of Middle East & Africa UK Food Sweeteners Market Revenue (Million) Forecast, by Application 2019 & 2032
- Table 86: Rest of Middle East & Africa UK Food Sweeteners Market Volume (K Tons) Forecast, by Application 2019 & 2032
- Table 87: Global UK Food Sweeteners Market Revenue Million Forecast, by Product Type 2019 & 2032
- Table 88: Global UK Food Sweeteners Market Volume K Tons Forecast, by Product Type 2019 & 2032
- Table 89: Global UK Food Sweeteners Market Revenue Million Forecast, by Application 2019 & 2032
- Table 90: Global UK Food Sweeteners Market Volume K Tons Forecast, by Application 2019 & 2032
- Table 91: Global UK Food Sweeteners Market Revenue Million Forecast, by Country 2019 & 2032
- Table 92: Global UK Food Sweeteners Market Volume K Tons Forecast, by Country 2019 & 2032
- Table 93: China UK Food Sweeteners Market Revenue (Million) Forecast, by Application 2019 & 2032
- Table 94: China UK Food Sweeteners Market Volume (K Tons) Forecast, by Application 2019 & 2032
- Table 95: India UK Food Sweeteners Market Revenue (Million) Forecast, by Application 2019 & 2032
- Table 96: India UK Food Sweeteners Market Volume (K Tons) Forecast, by Application 2019 & 2032
- Table 97: Japan UK Food Sweeteners Market Revenue (Million) Forecast, by Application 2019 & 2032
- Table 98: Japan UK Food Sweeteners Market Volume (K Tons) Forecast, by Application 2019 & 2032
- Table 99: South Korea UK Food Sweeteners Market Revenue (Million) Forecast, by Application 2019 & 2032
- Table 100: South Korea UK Food Sweeteners Market Volume (K Tons) Forecast, by Application 2019 & 2032
- Table 101: ASEAN UK Food Sweeteners Market Revenue (Million) Forecast, by Application 2019 & 2032
- Table 102: ASEAN UK Food Sweeteners Market Volume (K Tons) Forecast, by Application 2019 & 2032
- Table 103: Oceania UK Food Sweeteners Market Revenue (Million) Forecast, by Application 2019 & 2032
- Table 104: Oceania UK Food Sweeteners Market Volume (K Tons) Forecast, by Application 2019 & 2032
- Table 105: Rest of Asia Pacific UK Food Sweeteners Market Revenue (Million) Forecast, by Application 2019 & 2032
- Table 106: Rest of Asia Pacific UK Food Sweeteners Market Volume (K Tons) Forecast, by Application 2019 & 2032
Frequently Asked Questions
1. What is the projected Compound Annual Growth Rate (CAGR) of the UK Food Sweeteners Market?
The projected CAGR is approximately 1.59%.
2. Which companies are prominent players in the UK Food Sweeteners Market?
Key companies in the market include Cargill Incorporated, GLG Life Tech Corporation, PureCircle Limited, Archer Daniels Midland Company, Tate & Lyle PLC, DuPont, Ingredion Incorporated, Tereos S A *List Not Exhaustive.
3. What are the main segments of the UK Food Sweeteners Market?
The market segments include Product Type, Application.
4. Can you provide details about the market size?
The market size is estimated to be USD XX Million as of 2022.
5. What are some drivers contributing to market growth?
Rising Application in Dietary Supplements.
6. What are the notable trends driving market growth?
Xylitol Accounts For The Largest Share.
7. Are there any restraints impacting market growth?
Increasing prevalence of hydroglycemia.
8. Can you provide examples of recent developments in the market?
N/A
9. What pricing options are available for accessing the report?
Pricing options include single-user, multi-user, and enterprise licenses priced at USD 3800, USD 4500, and USD 5800 respectively.
10. Is the market size provided in terms of value or volume?
The market size is provided in terms of value, measured in Million and volume, measured in K Tons.
11. Are there any specific market keywords associated with the report?
Yes, the market keyword associated with the report is "UK Food Sweeteners Market," which aids in identifying and referencing the specific market segment covered.
12. How do I determine which pricing option suits my needs best?
The pricing options vary based on user requirements and access needs. Individual users may opt for single-user licenses, while businesses requiring broader access may choose multi-user or enterprise licenses for cost-effective access to the report.
13. Are there any additional resources or data provided in the UK Food Sweeteners Market report?
While the report offers comprehensive insights, it's advisable to review the specific contents or supplementary materials provided to ascertain if additional resources or data are available.
14. How can I stay updated on further developments or reports in the UK Food Sweeteners Market?
To stay informed about further developments, trends, and reports in the UK Food Sweeteners Market, consider subscribing to industry newsletters, following relevant companies and organizations, or regularly checking reputable industry news sources and publications.
Methodology
Step 1 - Identification of Relevant Samples Size from Population Database


Step 2 - Approaches for Defining Global Market Size (Value, Volume* & Price*)

Note*: In applicable scenarios
Step 3 - Data Sources
Primary Research
- Web Analytics
- Survey Reports
- Research Institute
- Latest Research Reports
- Opinion Leaders
Secondary Research
- Annual Reports
- White Paper
- Latest Press Release
- Industry Association
- Paid Database
- Investor Presentations

Step 4 - Data Triangulation
Involves using different sources of information in order to increase the validity of a study
These sources are likely to be stakeholders in a program - participants, other researchers, program staff, other community members, and so on.
Then we put all data in single framework & apply various statistical tools to find out the dynamic on the market.
During the analysis stage, feedback from the stakeholder groups would be compared to determine areas of agreement as well as areas of divergence


