
Key Insights
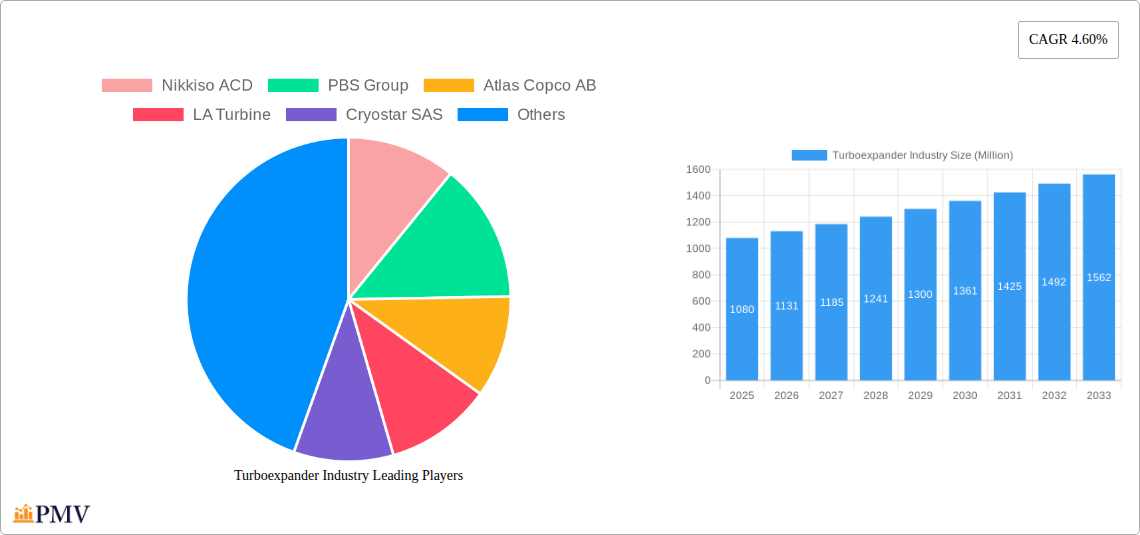
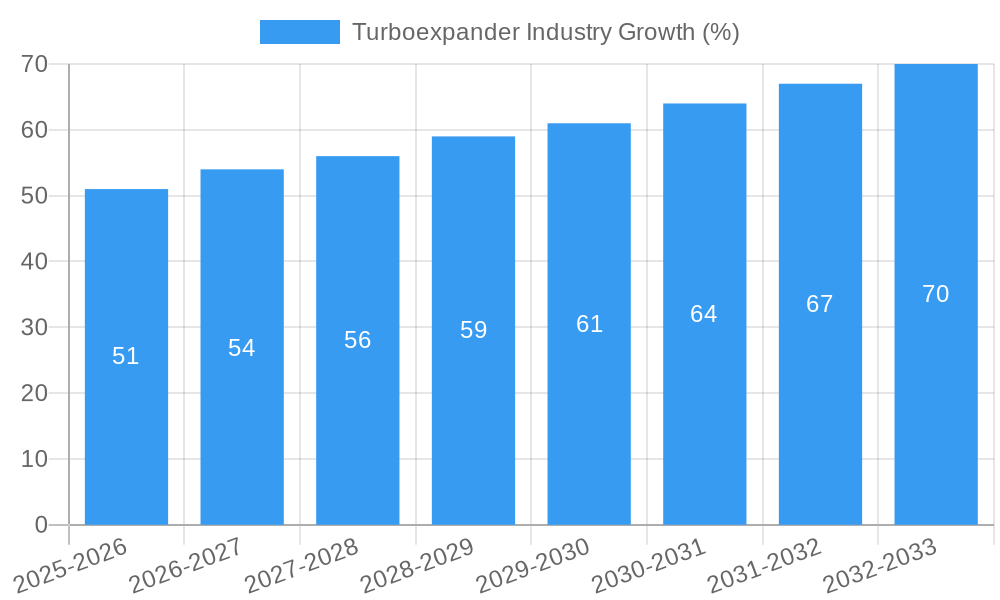
The global turboexpander market, valued at $1.08 billion in 2025, is projected to experience robust growth, driven by increasing demand across key end-user industries. A compound annual growth rate (CAGR) of 4.60% from 2025 to 2033 signifies a considerable expansion, primarily fueled by the growing need for energy efficiency and recovery in sectors like oil and gas, power generation, and energy recovery. The rising adoption of turboexpanders in these industries stems from their ability to convert waste energy into usable power, leading to significant cost savings and reduced environmental impact. Technological advancements, such as improved designs and materials, are also contributing to the market's expansion. Key players like Nikkiso ACD, Atlas Copco AB, and Elliott Group are driving innovation, resulting in higher efficiency and reliability of turboexpanders. However, the market faces some challenges including high initial investment costs and the need for specialized expertise in installation and maintenance. Nevertheless, the long-term benefits of energy efficiency and cost reduction are expected to outweigh these limitations, contributing to continued market expansion throughout the forecast period.
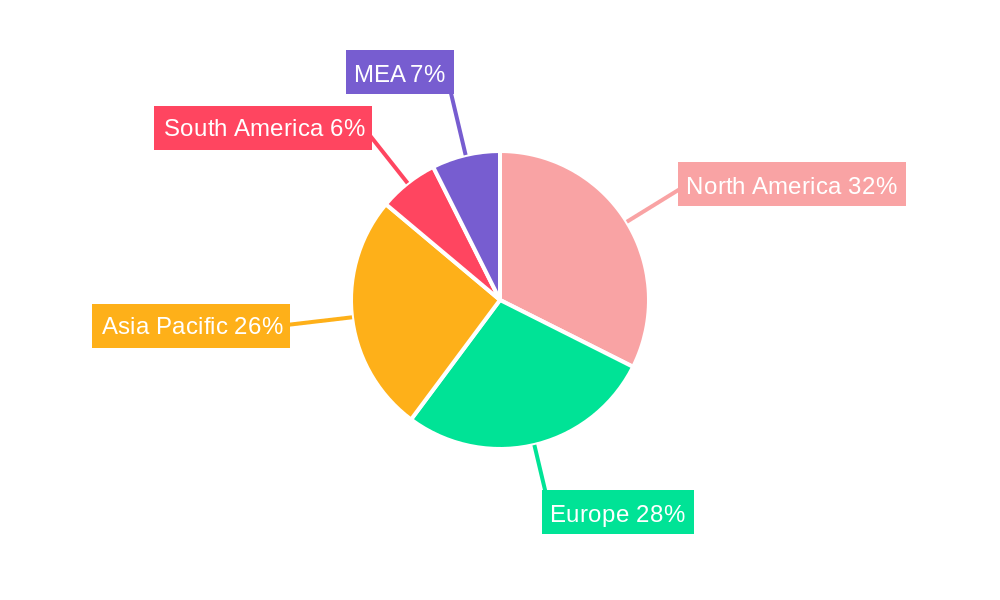
The market segmentation reveals significant opportunities. Loading devices, including compressors, generators, and hydraulic brakes, represent key components driving demand. Geographically, North America and Europe currently hold significant market shares, but the Asia-Pacific region is poised for substantial growth due to rapid industrialization and increasing energy consumption. The competitive landscape is marked by established players and emerging companies striving to offer innovative solutions and cater to diverse industry requirements. Future growth will likely depend on collaborations within the supply chain, ongoing technological innovations, and supportive government policies promoting energy efficiency. Specific regional growth will be influenced by factors such as economic development, energy policies, and industrial investment in each geographical area.
Turboexpander Industry Market Report: 2019-2033
This comprehensive report provides a detailed analysis of the global turboexpander industry, offering invaluable insights for businesses, investors, and researchers. The study period covers 2019-2033, with a base year of 2025 and a forecast period of 2025-2033. The report projects a market size exceeding $XX Million by 2033, presenting a compelling CAGR of XX% during the forecast period.
Turboexpander Industry Market Structure & Competitive Dynamics
The turboexpander industry exhibits a moderately concentrated market structure, with several key players holding significant market share. Competition is intense, driven by technological innovation and a focus on energy efficiency improvements. Key players like Nikkiso ACD, PBS Group, Atlas Copco AB, LA Turbine, Cryostar SAS, Air Products and Chemicals Inc, Elliott Group, Baker Hughes Company, and Blair Engineering compete fiercely, employing various strategies such as product diversification, strategic partnerships, and M&A activities. Market share estimations suggest that the top five players collectively account for approximately XX% of the global market in 2025.
The industry's innovation ecosystem is vibrant, with continuous research and development efforts focused on improving turboexpander efficiency, reliability, and applications. Stringent environmental regulations worldwide are shaping the industry landscape, pushing manufacturers towards more sustainable and energy-efficient solutions. Product substitutes, such as alternative energy recovery technologies, pose a moderate competitive threat, but the high efficiency and reliability of turboexpanders continue to secure their market position. Recent M&A activities have involved deals worth approximately $XX Million in the past five years, signaling a trend of consolidation within the industry. The ongoing evolution of end-user preferences towards cleaner energy sources further drives innovation and market growth.
Turboexpander Industry Trends & Insights
The global turboexpander market is witnessing robust growth, primarily driven by increasing demand from the oil and gas, power generation, and energy recovery sectors. The rising need for efficient energy recovery solutions, particularly in LNG processing and industrial gas applications, is a major growth catalyst. Technological advancements, such as the development of more efficient and compact turboexpanders, are enhancing market penetration. Consumer preferences are shifting towards eco-friendly and energy-efficient technologies, creating lucrative opportunities for turboexpander manufacturers.
The market exhibits considerable regional variations, with North America and Europe holding significant market shares. Asia-Pacific is projected to witness the highest growth rate during the forecast period, propelled by large-scale investments in infrastructure development and industrial expansion. Competitive dynamics within the industry are shaped by factors such as technological advancements, product innovation, and strategic partnerships. The estimated CAGR for the global turboexpander market during the forecast period (2025-2033) is approximately XX%, reflecting a robust growth trajectory. Market penetration is particularly strong in established markets such as North America and Europe, while emerging economies show significant growth potential.
Dominant Markets & Segments in Turboexpander Industry
The Oil and Gas segment dominates the end-user industry landscape, accounting for approximately XX% of the total market revenue in 2025. This dominance is fueled by the extensive application of turboexpanders in LNG processing, natural gas liquefaction, and other related processes. The Power Generation segment also holds a significant market share, driven by the increasing adoption of turboexpanders in combined cycle power plants and energy recovery systems.
- Key Drivers for Oil & Gas Dominance: High energy demand, ongoing exploration and production activities, and stringent environmental regulations promoting efficient energy recovery.
- Key Drivers for Power Generation Segment: Growing demand for electricity, increased focus on energy efficiency, and rising adoption of combined cycle power plants.
- Geographic Dominance: North America is currently the leading region, followed by Europe and Asia-Pacific. However, Asia-Pacific is expected to witness the fastest growth rate due to rapid industrialization and significant investments in energy infrastructure. The Compressor segment holds the largest share within the Loading Devices category.
Within the Loading Devices segment, compressors are the most widely used type, due to their versatility and suitability for various applications.
Turboexpander Industry Product Innovations
Recent innovations in the turboexpander industry focus on enhancing efficiency, reducing emissions, and expanding applications. Developments include improved aerodynamic designs, advanced materials, and integrated control systems. These improvements result in better energy recovery, reduced operational costs, and enhanced reliability. This market fit is particularly relevant for sectors prioritizing sustainability and cost optimization, such as the oil and gas and renewable energy industries. The development of smaller, more compact turboexpanders is also gaining traction, enabling deployment in diverse and space-constrained environments.
Report Segmentation & Scope
This report segments the turboexpander market based on Loading Devices (Compressor, Generator, Hydraulic Brake) and End-user Industries (Oil and Gas, Power Generation, Energy Recovery, Other End-user Industries). Each segment is analyzed based on market size, growth rate, and competitive dynamics. For instance, the Oil & Gas segment is projected to experience significant growth due to rising energy demand and stricter environmental regulations. The Compressor segment within Loading Devices is anticipated to dominate owing to its widespread applicability. Detailed analysis of each sub-segment is provided, including growth projections and market size estimations for the forecast period. Competitive landscapes are assessed for each segment to understand the relative strength of various players.
Key Drivers of Turboexpander Industry Growth
The turboexpander industry's growth is fueled by several factors. Increasing demand for energy efficiency improvements in various industrial processes is a major driver. Stringent environmental regulations globally are pushing industries to adopt technologies that minimize waste energy and greenhouse gas emissions, making turboexpanders attractive solutions. Furthermore, technological advancements, leading to improved efficiency and reliability of turboexpanders, are contributing to higher adoption rates across various sectors. Government incentives and support for clean energy initiatives further stimulate market growth.
Challenges in the Turboexpander Industry Sector
The turboexpander industry faces certain challenges. High initial investment costs for turboexpander systems can pose a barrier to entry for some businesses. Fluctuations in raw material prices and supply chain disruptions can impact production costs and profitability. Furthermore, intense competition from alternative energy recovery technologies necessitates continuous innovation and efficiency improvements to maintain market share. Regulatory complexities and compliance requirements also present hurdles for manufacturers.
Leading Players in the Turboexpander Industry Market
- Nikkiso ACD
- PBS Group
- Atlas Copco AB
- LA Turbine
- Cryostar SAS
- Air Products and Chemicals Inc
- Elliott Group
- Baker Hughes Company
- Blair Engineering
Key Developments in Turboexpander Industry Sector
- August 2023: Sapphire Technologies and TB Global Technologies Ltd. announced the development of a turboexpander generator that harnesses waste energy in city gas transportation routes. This development significantly expands the potential applications of turboexpanders, driving market growth in the energy recovery sector.
- October 2022: Sapphire Technologies signed an agreement with Tallgrass Energy to install 72 turbo expander systems over three years. This large-scale project highlights the growing adoption of turboexpanders in clean energy initiatives, signifying a positive shift in market dynamics and influencing future growth potential.
Strategic Turboexpander Industry Market Outlook
The turboexpander market exhibits significant growth potential driven by increasing demand for energy efficiency and sustainability. The industry's future hinges on continuous innovation and technological advancements to enhance efficiency, reduce costs, and expand application areas. Strategic partnerships and collaborations are likely to play a vital role in market expansion. Focus on emerging markets, particularly in Asia-Pacific, presents lucrative growth opportunities. The market's long-term outlook is optimistic, fueled by global efforts towards decarbonization and sustainable energy solutions.
Turboexpander Industry Segmentation
-
1. Loading Devices
- 1.1. Compressor
- 1.2. Generator
- 1.3. Hydraulic Brake
-
2. End-user Industry
- 2.1. Oil and Gas
- 2.2. Power Generation
- 2.3. Energy Recovery
- 2.4. Other End-user Industries
Turboexpander Industry Segmentation By Geography
-
1. North America
- 1.1. United States
- 1.2. Canada
- 1.3. Rest of North America
-
2. Europe
- 2.1. Germany
- 2.2. France
- 2.3. United Kingdom
- 2.4. Italy
- 2.5. Rest of Europe
-
3. Asia Pacific
- 3.1. China
- 3.2. India
- 3.3. Japan
- 3.4. Australia
- 3.5. Rest of Asia Pacific
-
4. South America
- 4.1. Brazil
- 4.2. Argentina
- 4.3. Chile
- 4.4. Rest of South America
-
5. Middle East and Africa
- 5.1. Saudi Arabia
- 5.2. United Arab Emirates
- 5.3. South Africa
- 5.4. Qatar
- 5.5. Rest of Middle East and Africa
Turboexpander Industry REPORT HIGHLIGHTS
| Aspects | Details |
|---|---|
| Study Period | 2019-2033 |
| Base Year | 2024 |
| Estimated Year | 2025 |
| Forecast Period | 2025-2033 |
| Historical Period | 2019-2024 |
| Growth Rate | CAGR of 4.60% from 2019-2033 |
| Segmentation |
|
Table of Contents
- 1. Introduction
- 1.1. Research Scope
- 1.2. Market Segmentation
- 1.3. Research Methodology
- 1.4. Definitions and Assumptions
- 2. Executive Summary
- 2.1. Introduction
- 3. Market Dynamics
- 3.1. Introduction
- 3.2. Market Drivers
- 3.2.1. 4.; Increasing Investment in the Adaption of Natural Gas for Power Generation and Fuel for Various Industries
- 3.3. Market Restrains
- 3.3.1. 4.; Increasing Share of Renewable Energy Sources
- 3.4. Market Trends
- 3.4.1. Power Generation Segment to Have a Significant Share
- 4. Market Factor Analysis
- 4.1. Porters Five Forces
- 4.2. Supply/Value Chain
- 4.3. PESTEL analysis
- 4.4. Market Entropy
- 4.5. Patent/Trademark Analysis
- 5. Global Turboexpander Industry Analysis, Insights and Forecast, 2019-2031
- 5.1. Market Analysis, Insights and Forecast - by Loading Devices
- 5.1.1. Compressor
- 5.1.2. Generator
- 5.1.3. Hydraulic Brake
- 5.2. Market Analysis, Insights and Forecast - by End-user Industry
- 5.2.1. Oil and Gas
- 5.2.2. Power Generation
- 5.2.3. Energy Recovery
- 5.2.4. Other End-user Industries
- 5.3. Market Analysis, Insights and Forecast - by Region
- 5.3.1. North America
- 5.3.2. Europe
- 5.3.3. Asia Pacific
- 5.3.4. South America
- 5.3.5. Middle East and Africa
- 5.1. Market Analysis, Insights and Forecast - by Loading Devices
- 6. North America Turboexpander Industry Analysis, Insights and Forecast, 2019-2031
- 6.1. Market Analysis, Insights and Forecast - by Loading Devices
- 6.1.1. Compressor
- 6.1.2. Generator
- 6.1.3. Hydraulic Brake
- 6.2. Market Analysis, Insights and Forecast - by End-user Industry
- 6.2.1. Oil and Gas
- 6.2.2. Power Generation
- 6.2.3. Energy Recovery
- 6.2.4. Other End-user Industries
- 6.1. Market Analysis, Insights and Forecast - by Loading Devices
- 7. Europe Turboexpander Industry Analysis, Insights and Forecast, 2019-2031
- 7.1. Market Analysis, Insights and Forecast - by Loading Devices
- 7.1.1. Compressor
- 7.1.2. Generator
- 7.1.3. Hydraulic Brake
- 7.2. Market Analysis, Insights and Forecast - by End-user Industry
- 7.2.1. Oil and Gas
- 7.2.2. Power Generation
- 7.2.3. Energy Recovery
- 7.2.4. Other End-user Industries
- 7.1. Market Analysis, Insights and Forecast - by Loading Devices
- 8. Asia Pacific Turboexpander Industry Analysis, Insights and Forecast, 2019-2031
- 8.1. Market Analysis, Insights and Forecast - by Loading Devices
- 8.1.1. Compressor
- 8.1.2. Generator
- 8.1.3. Hydraulic Brake
- 8.2. Market Analysis, Insights and Forecast - by End-user Industry
- 8.2.1. Oil and Gas
- 8.2.2. Power Generation
- 8.2.3. Energy Recovery
- 8.2.4. Other End-user Industries
- 8.1. Market Analysis, Insights and Forecast - by Loading Devices
- 9. South America Turboexpander Industry Analysis, Insights and Forecast, 2019-2031
- 9.1. Market Analysis, Insights and Forecast - by Loading Devices
- 9.1.1. Compressor
- 9.1.2. Generator
- 9.1.3. Hydraulic Brake
- 9.2. Market Analysis, Insights and Forecast - by End-user Industry
- 9.2.1. Oil and Gas
- 9.2.2. Power Generation
- 9.2.3. Energy Recovery
- 9.2.4. Other End-user Industries
- 9.1. Market Analysis, Insights and Forecast - by Loading Devices
- 10. Middle East and Africa Turboexpander Industry Analysis, Insights and Forecast, 2019-2031
- 10.1. Market Analysis, Insights and Forecast - by Loading Devices
- 10.1.1. Compressor
- 10.1.2. Generator
- 10.1.3. Hydraulic Brake
- 10.2. Market Analysis, Insights and Forecast - by End-user Industry
- 10.2.1. Oil and Gas
- 10.2.2. Power Generation
- 10.2.3. Energy Recovery
- 10.2.4. Other End-user Industries
- 10.1. Market Analysis, Insights and Forecast - by Loading Devices
- 11. North America Turboexpander Industry Analysis, Insights and Forecast, 2019-2031
- 11.1. Market Analysis, Insights and Forecast - By Country/Sub-region
- 11.1.1 United States
- 11.1.2 Canada
- 11.1.3 Mexico
- 12. Europe Turboexpander Industry Analysis, Insights and Forecast, 2019-2031
- 12.1. Market Analysis, Insights and Forecast - By Country/Sub-region
- 12.1.1 Germany
- 12.1.2 United Kingdom
- 12.1.3 France
- 12.1.4 Spain
- 12.1.5 Italy
- 12.1.6 Spain
- 12.1.7 Belgium
- 12.1.8 Netherland
- 12.1.9 Nordics
- 12.1.10 Rest of Europe
- 13. Asia Pacific Turboexpander Industry Analysis, Insights and Forecast, 2019-2031
- 13.1. Market Analysis, Insights and Forecast - By Country/Sub-region
- 13.1.1 China
- 13.1.2 Japan
- 13.1.3 India
- 13.1.4 South Korea
- 13.1.5 Southeast Asia
- 13.1.6 Australia
- 13.1.7 Indonesia
- 13.1.8 Phillipes
- 13.1.9 Singapore
- 13.1.10 Thailandc
- 13.1.11 Rest of Asia Pacific
- 14. South America Turboexpander Industry Analysis, Insights and Forecast, 2019-2031
- 14.1. Market Analysis, Insights and Forecast - By Country/Sub-region
- 14.1.1 Brazil
- 14.1.2 Argentina
- 14.1.3 Peru
- 14.1.4 Chile
- 14.1.5 Colombia
- 14.1.6 Ecuador
- 14.1.7 Venezuela
- 14.1.8 Rest of South America
- 15. North America Turboexpander Industry Analysis, Insights and Forecast, 2019-2031
- 15.1. Market Analysis, Insights and Forecast - By Country/Sub-region
- 15.1.1 United States
- 15.1.2 Canada
- 15.1.3 Mexico
- 16. MEA Turboexpander Industry Analysis, Insights and Forecast, 2019-2031
- 16.1. Market Analysis, Insights and Forecast - By Country/Sub-region
- 16.1.1 United Arab Emirates
- 16.1.2 Saudi Arabia
- 16.1.3 South Africa
- 16.1.4 Rest of Middle East and Africa
- 17. Competitive Analysis
- 17.1. Global Market Share Analysis 2024
- 17.2. Company Profiles
- 17.2.1 Nikkiso ACD
- 17.2.1.1. Overview
- 17.2.1.2. Products
- 17.2.1.3. SWOT Analysis
- 17.2.1.4. Recent Developments
- 17.2.1.5. Financials (Based on Availability)
- 17.2.2 PBS Group
- 17.2.2.1. Overview
- 17.2.2.2. Products
- 17.2.2.3. SWOT Analysis
- 17.2.2.4. Recent Developments
- 17.2.2.5. Financials (Based on Availability)
- 17.2.3 Atlas Copco AB
- 17.2.3.1. Overview
- 17.2.3.2. Products
- 17.2.3.3. SWOT Analysis
- 17.2.3.4. Recent Developments
- 17.2.3.5. Financials (Based on Availability)
- 17.2.4 LA Turbine
- 17.2.4.1. Overview
- 17.2.4.2. Products
- 17.2.4.3. SWOT Analysis
- 17.2.4.4. Recent Developments
- 17.2.4.5. Financials (Based on Availability)
- 17.2.5 Cryostar SAS
- 17.2.5.1. Overview
- 17.2.5.2. Products
- 17.2.5.3. SWOT Analysis
- 17.2.5.4. Recent Developments
- 17.2.5.5. Financials (Based on Availability)
- 17.2.6 Air Products and Chemicals Inc *List Not Exhaustive
- 17.2.6.1. Overview
- 17.2.6.2. Products
- 17.2.6.3. SWOT Analysis
- 17.2.6.4. Recent Developments
- 17.2.6.5. Financials (Based on Availability)
- 17.2.7 Elliott Group
- 17.2.7.1. Overview
- 17.2.7.2. Products
- 17.2.7.3. SWOT Analysis
- 17.2.7.4. Recent Developments
- 17.2.7.5. Financials (Based on Availability)
- 17.2.8 Baker Hughes Company
- 17.2.8.1. Overview
- 17.2.8.2. Products
- 17.2.8.3. SWOT Analysis
- 17.2.8.4. Recent Developments
- 17.2.8.5. Financials (Based on Availability)
- 17.2.9 Blair Engineering
- 17.2.9.1. Overview
- 17.2.9.2. Products
- 17.2.9.3. SWOT Analysis
- 17.2.9.4. Recent Developments
- 17.2.9.5. Financials (Based on Availability)
- 17.2.1 Nikkiso ACD
List of Figures
- Figure 1: Global Turboexpander Industry Revenue Breakdown (Million, %) by Region 2024 & 2032
- Figure 2: North America Turboexpander Industry Revenue (Million), by Country 2024 & 2032
- Figure 3: North America Turboexpander Industry Revenue Share (%), by Country 2024 & 2032
- Figure 4: Europe Turboexpander Industry Revenue (Million), by Country 2024 & 2032
- Figure 5: Europe Turboexpander Industry Revenue Share (%), by Country 2024 & 2032
- Figure 6: Asia Pacific Turboexpander Industry Revenue (Million), by Country 2024 & 2032
- Figure 7: Asia Pacific Turboexpander Industry Revenue Share (%), by Country 2024 & 2032
- Figure 8: South America Turboexpander Industry Revenue (Million), by Country 2024 & 2032
- Figure 9: South America Turboexpander Industry Revenue Share (%), by Country 2024 & 2032
- Figure 10: North America Turboexpander Industry Revenue (Million), by Country 2024 & 2032
- Figure 11: North America Turboexpander Industry Revenue Share (%), by Country 2024 & 2032
- Figure 12: MEA Turboexpander Industry Revenue (Million), by Country 2024 & 2032
- Figure 13: MEA Turboexpander Industry Revenue Share (%), by Country 2024 & 2032
- Figure 14: North America Turboexpander Industry Revenue (Million), by Loading Devices 2024 & 2032
- Figure 15: North America Turboexpander Industry Revenue Share (%), by Loading Devices 2024 & 2032
- Figure 16: North America Turboexpander Industry Revenue (Million), by End-user Industry 2024 & 2032
- Figure 17: North America Turboexpander Industry Revenue Share (%), by End-user Industry 2024 & 2032
- Figure 18: North America Turboexpander Industry Revenue (Million), by Country 2024 & 2032
- Figure 19: North America Turboexpander Industry Revenue Share (%), by Country 2024 & 2032
- Figure 20: Europe Turboexpander Industry Revenue (Million), by Loading Devices 2024 & 2032
- Figure 21: Europe Turboexpander Industry Revenue Share (%), by Loading Devices 2024 & 2032
- Figure 22: Europe Turboexpander Industry Revenue (Million), by End-user Industry 2024 & 2032
- Figure 23: Europe Turboexpander Industry Revenue Share (%), by End-user Industry 2024 & 2032
- Figure 24: Europe Turboexpander Industry Revenue (Million), by Country 2024 & 2032
- Figure 25: Europe Turboexpander Industry Revenue Share (%), by Country 2024 & 2032
- Figure 26: Asia Pacific Turboexpander Industry Revenue (Million), by Loading Devices 2024 & 2032
- Figure 27: Asia Pacific Turboexpander Industry Revenue Share (%), by Loading Devices 2024 & 2032
- Figure 28: Asia Pacific Turboexpander Industry Revenue (Million), by End-user Industry 2024 & 2032
- Figure 29: Asia Pacific Turboexpander Industry Revenue Share (%), by End-user Industry 2024 & 2032
- Figure 30: Asia Pacific Turboexpander Industry Revenue (Million), by Country 2024 & 2032
- Figure 31: Asia Pacific Turboexpander Industry Revenue Share (%), by Country 2024 & 2032
- Figure 32: South America Turboexpander Industry Revenue (Million), by Loading Devices 2024 & 2032
- Figure 33: South America Turboexpander Industry Revenue Share (%), by Loading Devices 2024 & 2032
- Figure 34: South America Turboexpander Industry Revenue (Million), by End-user Industry 2024 & 2032
- Figure 35: South America Turboexpander Industry Revenue Share (%), by End-user Industry 2024 & 2032
- Figure 36: South America Turboexpander Industry Revenue (Million), by Country 2024 & 2032
- Figure 37: South America Turboexpander Industry Revenue Share (%), by Country 2024 & 2032
- Figure 38: Middle East and Africa Turboexpander Industry Revenue (Million), by Loading Devices 2024 & 2032
- Figure 39: Middle East and Africa Turboexpander Industry Revenue Share (%), by Loading Devices 2024 & 2032
- Figure 40: Middle East and Africa Turboexpander Industry Revenue (Million), by End-user Industry 2024 & 2032
- Figure 41: Middle East and Africa Turboexpander Industry Revenue Share (%), by End-user Industry 2024 & 2032
- Figure 42: Middle East and Africa Turboexpander Industry Revenue (Million), by Country 2024 & 2032
- Figure 43: Middle East and Africa Turboexpander Industry Revenue Share (%), by Country 2024 & 2032
List of Tables
- Table 1: Global Turboexpander Industry Revenue Million Forecast, by Region 2019 & 2032
- Table 2: Global Turboexpander Industry Revenue Million Forecast, by Loading Devices 2019 & 2032
- Table 3: Global Turboexpander Industry Revenue Million Forecast, by End-user Industry 2019 & 2032
- Table 4: Global Turboexpander Industry Revenue Million Forecast, by Region 2019 & 2032
- Table 5: Global Turboexpander Industry Revenue Million Forecast, by Country 2019 & 2032
- Table 6: United States Turboexpander Industry Revenue (Million) Forecast, by Application 2019 & 2032
- Table 7: Canada Turboexpander Industry Revenue (Million) Forecast, by Application 2019 & 2032
- Table 8: Mexico Turboexpander Industry Revenue (Million) Forecast, by Application 2019 & 2032
- Table 9: Global Turboexpander Industry Revenue Million Forecast, by Country 2019 & 2032
- Table 10: Germany Turboexpander Industry Revenue (Million) Forecast, by Application 2019 & 2032
- Table 11: United Kingdom Turboexpander Industry Revenue (Million) Forecast, by Application 2019 & 2032
- Table 12: France Turboexpander Industry Revenue (Million) Forecast, by Application 2019 & 2032
- Table 13: Spain Turboexpander Industry Revenue (Million) Forecast, by Application 2019 & 2032
- Table 14: Italy Turboexpander Industry Revenue (Million) Forecast, by Application 2019 & 2032
- Table 15: Spain Turboexpander Industry Revenue (Million) Forecast, by Application 2019 & 2032
- Table 16: Belgium Turboexpander Industry Revenue (Million) Forecast, by Application 2019 & 2032
- Table 17: Netherland Turboexpander Industry Revenue (Million) Forecast, by Application 2019 & 2032
- Table 18: Nordics Turboexpander Industry Revenue (Million) Forecast, by Application 2019 & 2032
- Table 19: Rest of Europe Turboexpander Industry Revenue (Million) Forecast, by Application 2019 & 2032
- Table 20: Global Turboexpander Industry Revenue Million Forecast, by Country 2019 & 2032
- Table 21: China Turboexpander Industry Revenue (Million) Forecast, by Application 2019 & 2032
- Table 22: Japan Turboexpander Industry Revenue (Million) Forecast, by Application 2019 & 2032
- Table 23: India Turboexpander Industry Revenue (Million) Forecast, by Application 2019 & 2032
- Table 24: South Korea Turboexpander Industry Revenue (Million) Forecast, by Application 2019 & 2032
- Table 25: Southeast Asia Turboexpander Industry Revenue (Million) Forecast, by Application 2019 & 2032
- Table 26: Australia Turboexpander Industry Revenue (Million) Forecast, by Application 2019 & 2032
- Table 27: Indonesia Turboexpander Industry Revenue (Million) Forecast, by Application 2019 & 2032
- Table 28: Phillipes Turboexpander Industry Revenue (Million) Forecast, by Application 2019 & 2032
- Table 29: Singapore Turboexpander Industry Revenue (Million) Forecast, by Application 2019 & 2032
- Table 30: Thailandc Turboexpander Industry Revenue (Million) Forecast, by Application 2019 & 2032
- Table 31: Rest of Asia Pacific Turboexpander Industry Revenue (Million) Forecast, by Application 2019 & 2032
- Table 32: Global Turboexpander Industry Revenue Million Forecast, by Country 2019 & 2032
- Table 33: Brazil Turboexpander Industry Revenue (Million) Forecast, by Application 2019 & 2032
- Table 34: Argentina Turboexpander Industry Revenue (Million) Forecast, by Application 2019 & 2032
- Table 35: Peru Turboexpander Industry Revenue (Million) Forecast, by Application 2019 & 2032
- Table 36: Chile Turboexpander Industry Revenue (Million) Forecast, by Application 2019 & 2032
- Table 37: Colombia Turboexpander Industry Revenue (Million) Forecast, by Application 2019 & 2032
- Table 38: Ecuador Turboexpander Industry Revenue (Million) Forecast, by Application 2019 & 2032
- Table 39: Venezuela Turboexpander Industry Revenue (Million) Forecast, by Application 2019 & 2032
- Table 40: Rest of South America Turboexpander Industry Revenue (Million) Forecast, by Application 2019 & 2032
- Table 41: Global Turboexpander Industry Revenue Million Forecast, by Country 2019 & 2032
- Table 42: United States Turboexpander Industry Revenue (Million) Forecast, by Application 2019 & 2032
- Table 43: Canada Turboexpander Industry Revenue (Million) Forecast, by Application 2019 & 2032
- Table 44: Mexico Turboexpander Industry Revenue (Million) Forecast, by Application 2019 & 2032
- Table 45: Global Turboexpander Industry Revenue Million Forecast, by Country 2019 & 2032
- Table 46: United Arab Emirates Turboexpander Industry Revenue (Million) Forecast, by Application 2019 & 2032
- Table 47: Saudi Arabia Turboexpander Industry Revenue (Million) Forecast, by Application 2019 & 2032
- Table 48: South Africa Turboexpander Industry Revenue (Million) Forecast, by Application 2019 & 2032
- Table 49: Rest of Middle East and Africa Turboexpander Industry Revenue (Million) Forecast, by Application 2019 & 2032
- Table 50: Global Turboexpander Industry Revenue Million Forecast, by Loading Devices 2019 & 2032
- Table 51: Global Turboexpander Industry Revenue Million Forecast, by End-user Industry 2019 & 2032
- Table 52: Global Turboexpander Industry Revenue Million Forecast, by Country 2019 & 2032
- Table 53: United States Turboexpander Industry Revenue (Million) Forecast, by Application 2019 & 2032
- Table 54: Canada Turboexpander Industry Revenue (Million) Forecast, by Application 2019 & 2032
- Table 55: Rest of North America Turboexpander Industry Revenue (Million) Forecast, by Application 2019 & 2032
- Table 56: Global Turboexpander Industry Revenue Million Forecast, by Loading Devices 2019 & 2032
- Table 57: Global Turboexpander Industry Revenue Million Forecast, by End-user Industry 2019 & 2032
- Table 58: Global Turboexpander Industry Revenue Million Forecast, by Country 2019 & 2032
- Table 59: Germany Turboexpander Industry Revenue (Million) Forecast, by Application 2019 & 2032
- Table 60: France Turboexpander Industry Revenue (Million) Forecast, by Application 2019 & 2032
- Table 61: United Kingdom Turboexpander Industry Revenue (Million) Forecast, by Application 2019 & 2032
- Table 62: Italy Turboexpander Industry Revenue (Million) Forecast, by Application 2019 & 2032
- Table 63: Rest of Europe Turboexpander Industry Revenue (Million) Forecast, by Application 2019 & 2032
- Table 64: Global Turboexpander Industry Revenue Million Forecast, by Loading Devices 2019 & 2032
- Table 65: Global Turboexpander Industry Revenue Million Forecast, by End-user Industry 2019 & 2032
- Table 66: Global Turboexpander Industry Revenue Million Forecast, by Country 2019 & 2032
- Table 67: China Turboexpander Industry Revenue (Million) Forecast, by Application 2019 & 2032
- Table 68: India Turboexpander Industry Revenue (Million) Forecast, by Application 2019 & 2032
- Table 69: Japan Turboexpander Industry Revenue (Million) Forecast, by Application 2019 & 2032
- Table 70: Australia Turboexpander Industry Revenue (Million) Forecast, by Application 2019 & 2032
- Table 71: Rest of Asia Pacific Turboexpander Industry Revenue (Million) Forecast, by Application 2019 & 2032
- Table 72: Global Turboexpander Industry Revenue Million Forecast, by Loading Devices 2019 & 2032
- Table 73: Global Turboexpander Industry Revenue Million Forecast, by End-user Industry 2019 & 2032
- Table 74: Global Turboexpander Industry Revenue Million Forecast, by Country 2019 & 2032
- Table 75: Brazil Turboexpander Industry Revenue (Million) Forecast, by Application 2019 & 2032
- Table 76: Argentina Turboexpander Industry Revenue (Million) Forecast, by Application 2019 & 2032
- Table 77: Chile Turboexpander Industry Revenue (Million) Forecast, by Application 2019 & 2032
- Table 78: Rest of South America Turboexpander Industry Revenue (Million) Forecast, by Application 2019 & 2032
- Table 79: Global Turboexpander Industry Revenue Million Forecast, by Loading Devices 2019 & 2032
- Table 80: Global Turboexpander Industry Revenue Million Forecast, by End-user Industry 2019 & 2032
- Table 81: Global Turboexpander Industry Revenue Million Forecast, by Country 2019 & 2032
- Table 82: Saudi Arabia Turboexpander Industry Revenue (Million) Forecast, by Application 2019 & 2032
- Table 83: United Arab Emirates Turboexpander Industry Revenue (Million) Forecast, by Application 2019 & 2032
- Table 84: South Africa Turboexpander Industry Revenue (Million) Forecast, by Application 2019 & 2032
- Table 85: Qatar Turboexpander Industry Revenue (Million) Forecast, by Application 2019 & 2032
- Table 86: Rest of Middle East and Africa Turboexpander Industry Revenue (Million) Forecast, by Application 2019 & 2032
Frequently Asked Questions
1. What is the projected Compound Annual Growth Rate (CAGR) of the Turboexpander Industry?
The projected CAGR is approximately 4.60%.
2. Which companies are prominent players in the Turboexpander Industry?
Key companies in the market include Nikkiso ACD, PBS Group, Atlas Copco AB, LA Turbine, Cryostar SAS, Air Products and Chemicals Inc *List Not Exhaustive, Elliott Group, Baker Hughes Company, Blair Engineering.
3. What are the main segments of the Turboexpander Industry?
The market segments include Loading Devices, End-user Industry.
4. Can you provide details about the market size?
The market size is estimated to be USD 1.08 Million as of 2022.
5. What are some drivers contributing to market growth?
4.; Increasing Investment in the Adaption of Natural Gas for Power Generation and Fuel for Various Industries.
6. What are the notable trends driving market growth?
Power Generation Segment to Have a Significant Share.
7. Are there any restraints impacting market growth?
4.; Increasing Share of Renewable Energy Sources.
8. Can you provide examples of recent developments in the market?
August 2023: Sapphire Technologies and TB Global Technologies Ltd. announced the development of a turboexpander generator that harnesses waste energy in city gas transportation routes. Two FreeSpin In-line Turbo Expanders (FIT) were successfully commissioned at the Toho Gasin’s Yokkaichi liquefied natural gas (LNG) terminal in Japan.
9. What pricing options are available for accessing the report?
Pricing options include single-user, multi-user, and enterprise licenses priced at USD 4750, USD 5250, and USD 8750 respectively.
10. Is the market size provided in terms of value or volume?
The market size is provided in terms of value, measured in Million.
11. Are there any specific market keywords associated with the report?
Yes, the market keyword associated with the report is "Turboexpander Industry," which aids in identifying and referencing the specific market segment covered.
12. How do I determine which pricing option suits my needs best?
The pricing options vary based on user requirements and access needs. Individual users may opt for single-user licenses, while businesses requiring broader access may choose multi-user or enterprise licenses for cost-effective access to the report.
13. Are there any additional resources or data provided in the Turboexpander Industry report?
While the report offers comprehensive insights, it's advisable to review the specific contents or supplementary materials provided to ascertain if additional resources or data are available.
14. How can I stay updated on further developments or reports in the Turboexpander Industry?
To stay informed about further developments, trends, and reports in the Turboexpander Industry, consider subscribing to industry newsletters, following relevant companies and organizations, or regularly checking reputable industry news sources and publications.
Methodology
Step 1 - Identification of Relevant Samples Size from Population Database


Step 2 - Approaches for Defining Global Market Size (Value, Volume* & Price*)

Note*: In applicable scenarios
Step 3 - Data Sources
Primary Research
- Web Analytics
- Survey Reports
- Research Institute
- Latest Research Reports
- Opinion Leaders
Secondary Research
- Annual Reports
- White Paper
- Latest Press Release
- Industry Association
- Paid Database
- Investor Presentations

Step 4 - Data Triangulation
Involves using different sources of information in order to increase the validity of a study
These sources are likely to be stakeholders in a program - participants, other researchers, program staff, other community members, and so on.
Then we put all data in single framework & apply various statistical tools to find out the dynamic on the market.
During the analysis stage, feedback from the stakeholder groups would be compared to determine areas of agreement as well as areas of divergence


