
Key Insights
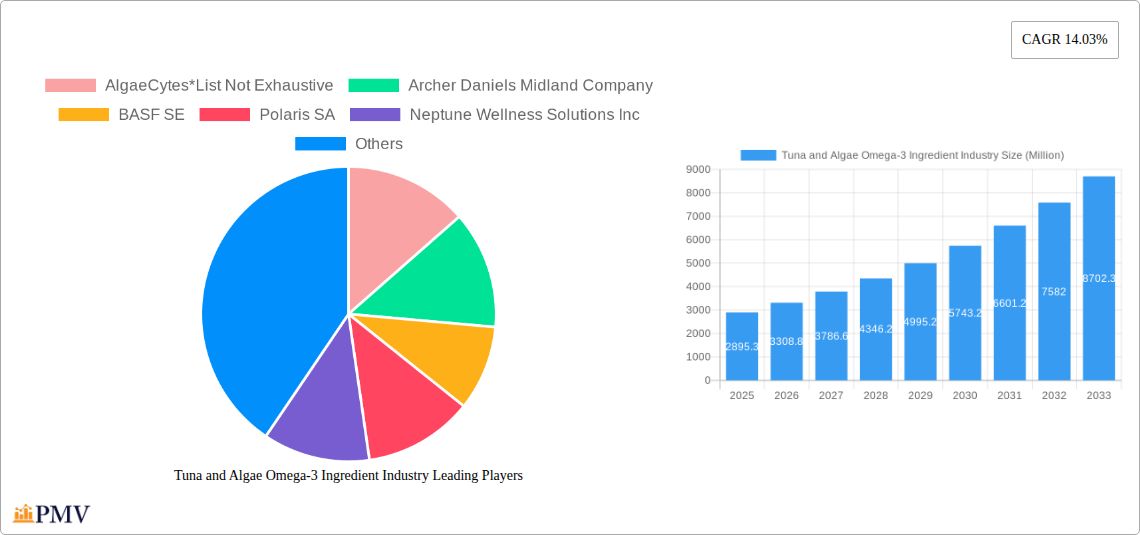
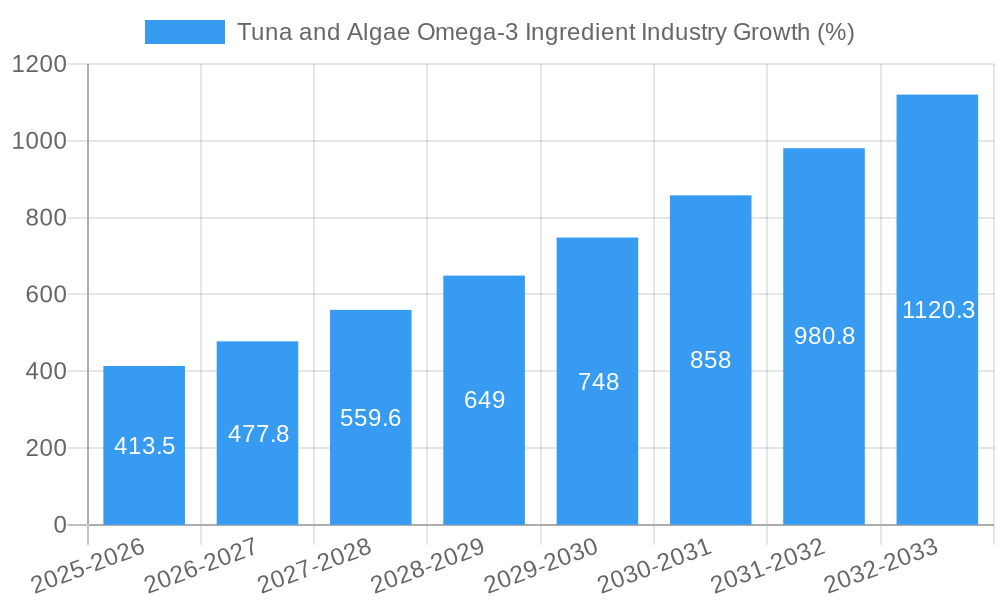
The global Tuna and Algae Omega-3 Ingredient market is experiencing robust growth, projected to reach a market size of $2,895.3 million in 2025 and maintain a Compound Annual Growth Rate (CAGR) of 14.03% from 2025 to 2033. This expansion is driven by several key factors. The increasing consumer awareness of the health benefits of Omega-3 fatty acids, particularly their role in cardiovascular health, brain function, and reducing inflammation, fuels demand for Omega-3 supplements. The growing preference for sustainable and plant-based alternatives to traditional fish oil sources further boosts the market for algae-based Omega-3s. This shift towards sustainable sourcing is also influenced by concerns regarding overfishing and the environmental impact of traditional fishing practices. Furthermore, advancements in algae cultivation technologies are leading to increased efficiency and lower production costs, making algae-derived Omega-3s a more competitive and accessible option. The diverse applications across food and beverages, dietary supplements, pharmaceuticals, animal nutrition, and clinical nutrition segments contribute to the market's expansive growth trajectory. High-concentration Omega-3 ingredients are expected to dominate the market due to their superior efficacy and convenience. Regional growth will vary, with North America and Europe anticipated to hold significant market shares initially, followed by a surge in demand from Asia-Pacific driven by rising disposable incomes and health consciousness.
The market segmentation reveals promising opportunities. The high-concentration segment is expected to command a larger share due to its superior potency and convenience for consumers and manufacturers. Within applications, the food and beverage industry and the dietary supplements sector are significant drivers, reflecting the growing integration of Omega-3s into everyday diets and health regimens. The pharmaceutical and animal nutrition sectors present additional avenues for growth, emphasizing the versatility of these ingredients. Key players like AlgaeCytes, Archer Daniels Midland Company, BASF SE, and others are actively involved in research, development, and market expansion, fostering innovation and competition within the industry. The market faces some challenges, including maintaining consistent quality and purity of algae-derived Omega-3s and managing the cost-effectiveness of production. However, ongoing technological advancements and increasing consumer demand are expected to overcome these hurdles. The overall outlook for the Tuna and Algae Omega-3 Ingredient market remains exceptionally positive, suggesting substantial growth and profitability for stakeholders in the coming years.
Tuna and Algae Omega-3 Ingredient Industry: A Comprehensive Market Report (2019-2033)
This comprehensive report provides a detailed analysis of the Tuna and Algae Omega-3 Ingredient industry, covering market size, segmentation, competitive landscape, and future growth prospects from 2019 to 2033. The study period spans 2019-2033, with 2025 serving as both the base and estimated year, and the forecast period extending from 2025-2033. The historical period analyzed is 2019-2024. This report is invaluable for industry stakeholders, investors, and researchers seeking actionable insights into this dynamic market.
Tuna and Algae Omega-3 Ingredient Industry Market Structure & Competitive Dynamics
The Tuna and Algae Omega-3 Ingredient industry exhibits a moderately concentrated market structure, with several key players vying for market share. The competitive landscape is characterized by intense innovation, particularly in algae-based omega-3 production, driving advancements in cultivation techniques and extraction methods. Stringent regulatory frameworks, particularly concerning food safety and labeling, significantly influence market dynamics. The industry also faces pressure from substitute products, including traditional fish oil sources and other PUFA supplements. End-user trends, increasingly favoring sustainable and plant-based options, are reshaping market demand. M&A activity has been moderate, with deals primarily focused on expanding production capacity, securing raw material supply, and accessing new markets. For example, the partnership between Polaris and Golden Omega USA demonstrates a strategic move to enhance distribution reach. The total M&A deal value over the past five years is estimated at xx Million. Market share data indicates that the top five players collectively hold approximately xx% of the market share in 2024, with the remaining share distributed among numerous smaller players.
Tuna and Algae Omega-3 Ingredient Industry Industry Trends & Insights
The global Tuna and Algae Omega-3 Ingredient market is experiencing robust growth, driven primarily by the rising consumer awareness regarding the health benefits of omega-3 fatty acids. The increasing prevalence of chronic diseases and a growing preference for functional foods and dietary supplements are major contributing factors. Technological advancements in algae cultivation and omega-3 extraction have significantly improved production efficiency and reduced costs, further fueling market expansion. The market is witnessing a shift towards sustainable and plant-based omega-3 sources, with algae-based products gaining significant traction due to their environmental friendliness and ethical considerations associated with traditional fish oil extraction. This trend is accelerating the market's compound annual growth rate (CAGR), projected to be xx% during the forecast period (2025-2033). Market penetration of algae-based omega-3 ingredients is steadily increasing, especially in the dietary supplement and functional food sectors, reaching approximately xx% in 2024. Competitive dynamics are influenced by continuous innovation, product differentiation, and pricing strategies, leading to a dynamic and evolving market landscape.
Dominant Markets & Segments in Tuna and Algae Omega-3 Ingredient Industry
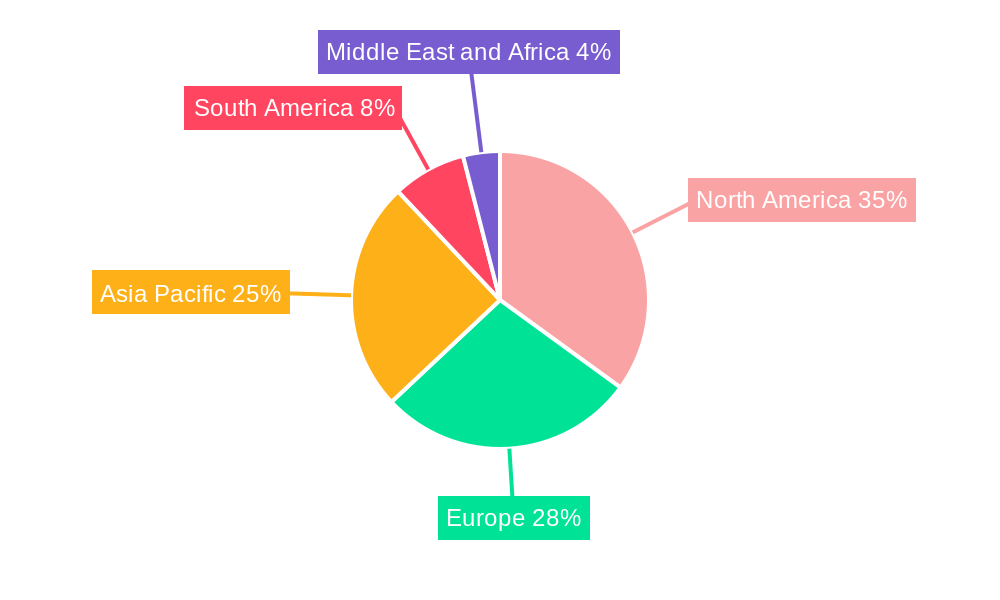
Leading Region/Country: North America currently holds a dominant position in the Tuna and Algae Omega-3 Ingredient market, driven by high consumer demand for health and wellness products and robust regulatory frameworks supporting the industry. Europe follows closely, demonstrating significant growth potential due to increasing consumer awareness and government initiatives promoting sustainable food solutions.
Dominant Segments:
- Algae Type: Microalgae, particularly Schizochytrium sp., are currently dominating the market due to their high DHA yield and ease of cultivation.
- Concentration Type: High-concentration omega-3 ingredients are witnessing higher demand due to their enhanced efficacy and reduced dosage requirements.
- Tuna Type: Sustainable and responsibly sourced tuna remains a significant segment within the industry, though facing challenges regarding overfishing concerns.
- Application: The dietary supplements segment currently holds the largest market share, followed by the food and beverage industry, which is witnessing substantial growth. The pharmaceutical and animal nutrition sectors are emerging segments presenting significant growth opportunities.
Key Drivers:
- North America: Strong consumer preference for health and wellness products, high disposable income, well-established regulatory frameworks.
- Europe: Increasing consumer awareness of health benefits of omega-3s, rising demand for sustainable food sources, supportive government initiatives.
Tuna and Algae Omega-3 Ingredient Industry Product Innovations
Recent years have witnessed significant advancements in algae-based omega-3 production, focusing on enhanced cultivation techniques, improved extraction methods, and the development of novel delivery systems. The introduction of high-potency algae oils, such as Polaris' Omegavie DHA 800, demonstrates the industry's commitment to providing highly effective and convenient omega-3 supplements. This innovation underscores a growing trend toward offering superior quality, sustainable, and value-added products to meet evolving consumer demands and competitive pressures. Technological trends are focused on enhancing scalability and efficiency while minimizing environmental impacts.
Report Segmentation & Scope
This report offers a granular segmentation of the Tuna and Algae Omega-3 Ingredient market, analyzing various parameters:
- Algae Type: Market size and growth projections for each algae type, including competitive analysis and technological advancements.
- Concentration Type: Market analysis for high, medium, and low-concentration omega-3 ingredients, including growth rates and pricing dynamics.
- Tuna Type: Market segmentation based on tuna species and sourcing practices, emphasizing sustainability and responsible fishing.
- Application: Detailed analysis for each application segment, including market size, growth forecasts, and competitive dynamics within food & beverage, dietary supplements, pharmaceuticals, animal nutrition, and clinical nutrition sectors.
Key Drivers of Tuna and Algae Omega-3 Ingredient Industry Growth
The growth of the Tuna and Algae Omega-3 Ingredient industry is propelled by several factors, including increasing consumer awareness of the health benefits of omega-3s, the rising prevalence of chronic diseases, and the growing demand for functional foods and dietary supplements. Technological advancements in algae cultivation and extraction, along with supportive government regulations and initiatives promoting sustainable seafood and plant-based alternatives, further stimulate market expansion. Furthermore, the increasing focus on health and wellness, particularly in developed countries, contributes to significant market growth.
Challenges in the Tuna and Algae Omega-3 Ingredient Industry Sector
The industry faces challenges such as fluctuations in raw material prices, particularly for tuna, and the high cost of algae cultivation. Regulatory hurdles and stringent quality control requirements can pose barriers to entry for new players. Moreover, maintaining consistent product quality, ensuring supply chain stability, and managing competitive pressures from established players and emerging substitutes are key obstacles impacting industry growth. The environmental impact of tuna fishing and algae production also requires careful consideration and sustainable practices. These factors can impact market profitability and growth projections significantly.
Leading Players in the Tuna and Algae Omega-3 Ingredient Industry Market
- AlgaeCytes
- Archer Daniels Midland Company
- BASF SE
- Polaris SA
- Neptune Wellness Solutions Inc
- Koninklijke DSM NV
- Bioprocess Algae LLC
- Lonza
- Corbion NV
- Source-Omega LLC
Key Developments in Tuna and Algae Omega-3 Ingredient Industry Sector
- June 2021: Polaris launched Omegavie DHA 800, a high-potency algae oil, significantly enhancing its product portfolio and market competitiveness.
- January 2022: AlgaeCytes secured substantial funding for building a large-scale bioreactor facility, indicating a strong commitment to expanding production capacity and market share.
- February 2022: Polaris' partnership with Golden Omega USA expanded its distribution network across North America, bolstering its market reach and sales potential.
Strategic Tuna and Algae Omega-3 Ingredient Industry Market Outlook
The Tuna and Algae Omega-3 Ingredient market presents significant growth potential driven by increasing health consciousness, rising demand for sustainable products, and continuous technological innovations. Strategic opportunities exist in developing high-value, customized omega-3 products targeting specific health needs, exploring novel delivery systems, and investing in research and development to enhance production efficiency and sustainability. Focusing on product differentiation, building strong brand equity, and strategically expanding into emerging markets will be crucial for success in this competitive but dynamic industry.
Tuna and Algae Omega-3 Ingredient Industry Segmentation
-
1. Type
-
1.1. Algae Type
-
1.1.1. Concentration type
- 1.1.1.1. High Concentration
- 1.1.1.2. Medium Concentration
- 1.1.1.3. Low Concentration
-
1.1.1. Concentration type
-
1.2. Tuna Type
- 1.2.1. Crude Tuna Oil
- 1.2.2. Refined Tuna Oil
-
1.1. Algae Type
-
2. Application
-
2.1. Food and Beverage
- 2.1.1. Infant Formula
- 2.1.2. Fortified Food and Beverages
- 2.2. Dietary Supplements
- 2.3. Pharmaceutical
- 2.4. Animal Nutrition
- 2.5. Clinical Nutrition
-
2.1. Food and Beverage
Tuna and Algae Omega-3 Ingredient Industry Segmentation By Geography
-
1. North America
- 1.1. United States
- 1.2. Canada
- 1.3. Mexico
- 1.4. Rest of North America
-
2. Europe
- 2.1. Spain
- 2.2. United Kingdom
- 2.3. Germany
- 2.4. France
- 2.5. Italy
- 2.6. Russia
- 2.7. Rest of Europe
-
3. Asia Pacific
- 3.1. China
- 3.2. Japan
- 3.3. India
- 3.4. Australia
- 3.5. Rest of Asia Pacific
-
4. South America
- 4.1. Brazil
- 4.2. Argentina
- 4.3. Rest of South America
-
5. Middle East and Africa
- 5.1. South Africa
- 5.2. United Arab Emirates
- 5.3. Rest of Middle East and Africa
Tuna and Algae Omega-3 Ingredient Industry REPORT HIGHLIGHTS
| Aspects | Details |
|---|---|
| Study Period | 2019-2033 |
| Base Year | 2024 |
| Estimated Year | 2025 |
| Forecast Period | 2025-2033 |
| Historical Period | 2019-2024 |
| Growth Rate | CAGR of 14.03% from 2019-2033 |
| Segmentation |
|
Table of Contents
- 1. Introduction
- 1.1. Research Scope
- 1.2. Market Segmentation
- 1.3. Research Methodology
- 1.4. Definitions and Assumptions
- 2. Executive Summary
- 2.1. Introduction
- 3. Market Dynamics
- 3.1. Introduction
- 3.2. Market Drivers
- 3.2.1. Increasing Demand For Convenience & Processed Food
- 3.3. Market Restrains
- 3.3.1. Increased Consumer Awareness On Side-Effects Of Chemical Additives
- 3.4. Market Trends
- 3.4.1. Increasing Consumer Expenditure on Omega-3 Supplements Products
- 4. Market Factor Analysis
- 4.1. Porters Five Forces
- 4.2. Supply/Value Chain
- 4.3. PESTEL analysis
- 4.4. Market Entropy
- 4.5. Patent/Trademark Analysis
- 5. Global Tuna and Algae Omega-3 Ingredient Industry Analysis, Insights and Forecast, 2019-2031
- 5.1. Market Analysis, Insights and Forecast - by Type
- 5.1.1. Algae Type
- 5.1.1.1. Concentration type
- 5.1.1.1.1. High Concentration
- 5.1.1.1.2. Medium Concentration
- 5.1.1.1.3. Low Concentration
- 5.1.1.1. Concentration type
- 5.1.2. Tuna Type
- 5.1.2.1. Crude Tuna Oil
- 5.1.2.2. Refined Tuna Oil
- 5.1.1. Algae Type
- 5.2. Market Analysis, Insights and Forecast - by Application
- 5.2.1. Food and Beverage
- 5.2.1.1. Infant Formula
- 5.2.1.2. Fortified Food and Beverages
- 5.2.2. Dietary Supplements
- 5.2.3. Pharmaceutical
- 5.2.4. Animal Nutrition
- 5.2.5. Clinical Nutrition
- 5.2.1. Food and Beverage
- 5.3. Market Analysis, Insights and Forecast - by Region
- 5.3.1. North America
- 5.3.2. Europe
- 5.3.3. Asia Pacific
- 5.3.4. South America
- 5.3.5. Middle East and Africa
- 5.1. Market Analysis, Insights and Forecast - by Type
- 6. North America Tuna and Algae Omega-3 Ingredient Industry Analysis, Insights and Forecast, 2019-2031
- 6.1. Market Analysis, Insights and Forecast - by Type
- 6.1.1. Algae Type
- 6.1.1.1. Concentration type
- 6.1.1.1.1. High Concentration
- 6.1.1.1.2. Medium Concentration
- 6.1.1.1.3. Low Concentration
- 6.1.1.1. Concentration type
- 6.1.2. Tuna Type
- 6.1.2.1. Crude Tuna Oil
- 6.1.2.2. Refined Tuna Oil
- 6.1.1. Algae Type
- 6.2. Market Analysis, Insights and Forecast - by Application
- 6.2.1. Food and Beverage
- 6.2.1.1. Infant Formula
- 6.2.1.2. Fortified Food and Beverages
- 6.2.2. Dietary Supplements
- 6.2.3. Pharmaceutical
- 6.2.4. Animal Nutrition
- 6.2.5. Clinical Nutrition
- 6.2.1. Food and Beverage
- 6.1. Market Analysis, Insights and Forecast - by Type
- 7. Europe Tuna and Algae Omega-3 Ingredient Industry Analysis, Insights and Forecast, 2019-2031
- 7.1. Market Analysis, Insights and Forecast - by Type
- 7.1.1. Algae Type
- 7.1.1.1. Concentration type
- 7.1.1.1.1. High Concentration
- 7.1.1.1.2. Medium Concentration
- 7.1.1.1.3. Low Concentration
- 7.1.1.1. Concentration type
- 7.1.2. Tuna Type
- 7.1.2.1. Crude Tuna Oil
- 7.1.2.2. Refined Tuna Oil
- 7.1.1. Algae Type
- 7.2. Market Analysis, Insights and Forecast - by Application
- 7.2.1. Food and Beverage
- 7.2.1.1. Infant Formula
- 7.2.1.2. Fortified Food and Beverages
- 7.2.2. Dietary Supplements
- 7.2.3. Pharmaceutical
- 7.2.4. Animal Nutrition
- 7.2.5. Clinical Nutrition
- 7.2.1. Food and Beverage
- 7.1. Market Analysis, Insights and Forecast - by Type
- 8. Asia Pacific Tuna and Algae Omega-3 Ingredient Industry Analysis, Insights and Forecast, 2019-2031
- 8.1. Market Analysis, Insights and Forecast - by Type
- 8.1.1. Algae Type
- 8.1.1.1. Concentration type
- 8.1.1.1.1. High Concentration
- 8.1.1.1.2. Medium Concentration
- 8.1.1.1.3. Low Concentration
- 8.1.1.1. Concentration type
- 8.1.2. Tuna Type
- 8.1.2.1. Crude Tuna Oil
- 8.1.2.2. Refined Tuna Oil
- 8.1.1. Algae Type
- 8.2. Market Analysis, Insights and Forecast - by Application
- 8.2.1. Food and Beverage
- 8.2.1.1. Infant Formula
- 8.2.1.2. Fortified Food and Beverages
- 8.2.2. Dietary Supplements
- 8.2.3. Pharmaceutical
- 8.2.4. Animal Nutrition
- 8.2.5. Clinical Nutrition
- 8.2.1. Food and Beverage
- 8.1. Market Analysis, Insights and Forecast - by Type
- 9. South America Tuna and Algae Omega-3 Ingredient Industry Analysis, Insights and Forecast, 2019-2031
- 9.1. Market Analysis, Insights and Forecast - by Type
- 9.1.1. Algae Type
- 9.1.1.1. Concentration type
- 9.1.1.1.1. High Concentration
- 9.1.1.1.2. Medium Concentration
- 9.1.1.1.3. Low Concentration
- 9.1.1.1. Concentration type
- 9.1.2. Tuna Type
- 9.1.2.1. Crude Tuna Oil
- 9.1.2.2. Refined Tuna Oil
- 9.1.1. Algae Type
- 9.2. Market Analysis, Insights and Forecast - by Application
- 9.2.1. Food and Beverage
- 9.2.1.1. Infant Formula
- 9.2.1.2. Fortified Food and Beverages
- 9.2.2. Dietary Supplements
- 9.2.3. Pharmaceutical
- 9.2.4. Animal Nutrition
- 9.2.5. Clinical Nutrition
- 9.2.1. Food and Beverage
- 9.1. Market Analysis, Insights and Forecast - by Type
- 10. Middle East and Africa Tuna and Algae Omega-3 Ingredient Industry Analysis, Insights and Forecast, 2019-2031
- 10.1. Market Analysis, Insights and Forecast - by Type
- 10.1.1. Algae Type
- 10.1.1.1. Concentration type
- 10.1.1.1.1. High Concentration
- 10.1.1.1.2. Medium Concentration
- 10.1.1.1.3. Low Concentration
- 10.1.1.1. Concentration type
- 10.1.2. Tuna Type
- 10.1.2.1. Crude Tuna Oil
- 10.1.2.2. Refined Tuna Oil
- 10.1.1. Algae Type
- 10.2. Market Analysis, Insights and Forecast - by Application
- 10.2.1. Food and Beverage
- 10.2.1.1. Infant Formula
- 10.2.1.2. Fortified Food and Beverages
- 10.2.2. Dietary Supplements
- 10.2.3. Pharmaceutical
- 10.2.4. Animal Nutrition
- 10.2.5. Clinical Nutrition
- 10.2.1. Food and Beverage
- 10.1. Market Analysis, Insights and Forecast - by Type
- 11. North America Tuna and Algae Omega-3 Ingredient Industry Analysis, Insights and Forecast, 2019-2031
- 11.1. Market Analysis, Insights and Forecast - By Country/Sub-region
- 11.1.1 United States
- 11.1.2 Canada
- 11.1.3 Mexico
- 11.1.4 Rest of North America
- 12. Europe Tuna and Algae Omega-3 Ingredient Industry Analysis, Insights and Forecast, 2019-2031
- 12.1. Market Analysis, Insights and Forecast - By Country/Sub-region
- 12.1.1 Spain
- 12.1.2 United Kingdom
- 12.1.3 Germany
- 12.1.4 France
- 12.1.5 Italy
- 12.1.6 Russia
- 12.1.7 Rest of Europe
- 13. Asia Pacific Tuna and Algae Omega-3 Ingredient Industry Analysis, Insights and Forecast, 2019-2031
- 13.1. Market Analysis, Insights and Forecast - By Country/Sub-region
- 13.1.1 China
- 13.1.2 Japan
- 13.1.3 India
- 13.1.4 Australia
- 13.1.5 Rest of Asia Pacific
- 14. South America Tuna and Algae Omega-3 Ingredient Industry Analysis, Insights and Forecast, 2019-2031
- 14.1. Market Analysis, Insights and Forecast - By Country/Sub-region
- 14.1.1 Brazil
- 14.1.2 Argentina
- 14.1.3 Rest of South America
- 15. Middle East and Africa Tuna and Algae Omega-3 Ingredient Industry Analysis, Insights and Forecast, 2019-2031
- 15.1. Market Analysis, Insights and Forecast - By Country/Sub-region
- 15.1.1 South Africa
- 15.1.2 United Arab Emirates
- 15.1.3 Rest of Middle East and Africa
- 16. Competitive Analysis
- 16.1. Global Market Share Analysis 2024
- 16.2. Company Profiles
- 16.2.1 AlgaeCytes*List Not Exhaustive
- 16.2.1.1. Overview
- 16.2.1.2. Products
- 16.2.1.3. SWOT Analysis
- 16.2.1.4. Recent Developments
- 16.2.1.5. Financials (Based on Availability)
- 16.2.2 Archer Daniels Midland Company
- 16.2.2.1. Overview
- 16.2.2.2. Products
- 16.2.2.3. SWOT Analysis
- 16.2.2.4. Recent Developments
- 16.2.2.5. Financials (Based on Availability)
- 16.2.3 BASF SE
- 16.2.3.1. Overview
- 16.2.3.2. Products
- 16.2.3.3. SWOT Analysis
- 16.2.3.4. Recent Developments
- 16.2.3.5. Financials (Based on Availability)
- 16.2.4 Polaris SA
- 16.2.4.1. Overview
- 16.2.4.2. Products
- 16.2.4.3. SWOT Analysis
- 16.2.4.4. Recent Developments
- 16.2.4.5. Financials (Based on Availability)
- 16.2.5 Neptune Wellness Solutions Inc
- 16.2.5.1. Overview
- 16.2.5.2. Products
- 16.2.5.3. SWOT Analysis
- 16.2.5.4. Recent Developments
- 16.2.5.5. Financials (Based on Availability)
- 16.2.6 Koninklijke DSM NV
- 16.2.6.1. Overview
- 16.2.6.2. Products
- 16.2.6.3. SWOT Analysis
- 16.2.6.4. Recent Developments
- 16.2.6.5. Financials (Based on Availability)
- 16.2.7 Bioprocess Algae LLC
- 16.2.7.1. Overview
- 16.2.7.2. Products
- 16.2.7.3. SWOT Analysis
- 16.2.7.4. Recent Developments
- 16.2.7.5. Financials (Based on Availability)
- 16.2.8 Lonza
- 16.2.8.1. Overview
- 16.2.8.2. Products
- 16.2.8.3. SWOT Analysis
- 16.2.8.4. Recent Developments
- 16.2.8.5. Financials (Based on Availability)
- 16.2.9 Corbion NV
- 16.2.9.1. Overview
- 16.2.9.2. Products
- 16.2.9.3. SWOT Analysis
- 16.2.9.4. Recent Developments
- 16.2.9.5. Financials (Based on Availability)
- 16.2.10 Source-Omega LLC
- 16.2.10.1. Overview
- 16.2.10.2. Products
- 16.2.10.3. SWOT Analysis
- 16.2.10.4. Recent Developments
- 16.2.10.5. Financials (Based on Availability)
- 16.2.1 AlgaeCytes*List Not Exhaustive
List of Figures
- Figure 1: Global Tuna and Algae Omega-3 Ingredient Industry Revenue Breakdown (Million, %) by Region 2024 & 2032
- Figure 2: Global Tuna and Algae Omega-3 Ingredient Industry Volume Breakdown (K Tons, %) by Region 2024 & 2032
- Figure 3: North America Tuna and Algae Omega-3 Ingredient Industry Revenue (Million), by Country 2024 & 2032
- Figure 4: North America Tuna and Algae Omega-3 Ingredient Industry Volume (K Tons), by Country 2024 & 2032
- Figure 5: North America Tuna and Algae Omega-3 Ingredient Industry Revenue Share (%), by Country 2024 & 2032
- Figure 6: North America Tuna and Algae Omega-3 Ingredient Industry Volume Share (%), by Country 2024 & 2032
- Figure 7: Europe Tuna and Algae Omega-3 Ingredient Industry Revenue (Million), by Country 2024 & 2032
- Figure 8: Europe Tuna and Algae Omega-3 Ingredient Industry Volume (K Tons), by Country 2024 & 2032
- Figure 9: Europe Tuna and Algae Omega-3 Ingredient Industry Revenue Share (%), by Country 2024 & 2032
- Figure 10: Europe Tuna and Algae Omega-3 Ingredient Industry Volume Share (%), by Country 2024 & 2032
- Figure 11: Asia Pacific Tuna and Algae Omega-3 Ingredient Industry Revenue (Million), by Country 2024 & 2032
- Figure 12: Asia Pacific Tuna and Algae Omega-3 Ingredient Industry Volume (K Tons), by Country 2024 & 2032
- Figure 13: Asia Pacific Tuna and Algae Omega-3 Ingredient Industry Revenue Share (%), by Country 2024 & 2032
- Figure 14: Asia Pacific Tuna and Algae Omega-3 Ingredient Industry Volume Share (%), by Country 2024 & 2032
- Figure 15: South America Tuna and Algae Omega-3 Ingredient Industry Revenue (Million), by Country 2024 & 2032
- Figure 16: South America Tuna and Algae Omega-3 Ingredient Industry Volume (K Tons), by Country 2024 & 2032
- Figure 17: South America Tuna and Algae Omega-3 Ingredient Industry Revenue Share (%), by Country 2024 & 2032
- Figure 18: South America Tuna and Algae Omega-3 Ingredient Industry Volume Share (%), by Country 2024 & 2032
- Figure 19: Middle East and Africa Tuna and Algae Omega-3 Ingredient Industry Revenue (Million), by Country 2024 & 2032
- Figure 20: Middle East and Africa Tuna and Algae Omega-3 Ingredient Industry Volume (K Tons), by Country 2024 & 2032
- Figure 21: Middle East and Africa Tuna and Algae Omega-3 Ingredient Industry Revenue Share (%), by Country 2024 & 2032
- Figure 22: Middle East and Africa Tuna and Algae Omega-3 Ingredient Industry Volume Share (%), by Country 2024 & 2032
- Figure 23: North America Tuna and Algae Omega-3 Ingredient Industry Revenue (Million), by Type 2024 & 2032
- Figure 24: North America Tuna and Algae Omega-3 Ingredient Industry Volume (K Tons), by Type 2024 & 2032
- Figure 25: North America Tuna and Algae Omega-3 Ingredient Industry Revenue Share (%), by Type 2024 & 2032
- Figure 26: North America Tuna and Algae Omega-3 Ingredient Industry Volume Share (%), by Type 2024 & 2032
- Figure 27: North America Tuna and Algae Omega-3 Ingredient Industry Revenue (Million), by Application 2024 & 2032
- Figure 28: North America Tuna and Algae Omega-3 Ingredient Industry Volume (K Tons), by Application 2024 & 2032
- Figure 29: North America Tuna and Algae Omega-3 Ingredient Industry Revenue Share (%), by Application 2024 & 2032
- Figure 30: North America Tuna and Algae Omega-3 Ingredient Industry Volume Share (%), by Application 2024 & 2032
- Figure 31: North America Tuna and Algae Omega-3 Ingredient Industry Revenue (Million), by Country 2024 & 2032
- Figure 32: North America Tuna and Algae Omega-3 Ingredient Industry Volume (K Tons), by Country 2024 & 2032
- Figure 33: North America Tuna and Algae Omega-3 Ingredient Industry Revenue Share (%), by Country 2024 & 2032
- Figure 34: North America Tuna and Algae Omega-3 Ingredient Industry Volume Share (%), by Country 2024 & 2032
- Figure 35: Europe Tuna and Algae Omega-3 Ingredient Industry Revenue (Million), by Type 2024 & 2032
- Figure 36: Europe Tuna and Algae Omega-3 Ingredient Industry Volume (K Tons), by Type 2024 & 2032
- Figure 37: Europe Tuna and Algae Omega-3 Ingredient Industry Revenue Share (%), by Type 2024 & 2032
- Figure 38: Europe Tuna and Algae Omega-3 Ingredient Industry Volume Share (%), by Type 2024 & 2032
- Figure 39: Europe Tuna and Algae Omega-3 Ingredient Industry Revenue (Million), by Application 2024 & 2032
- Figure 40: Europe Tuna and Algae Omega-3 Ingredient Industry Volume (K Tons), by Application 2024 & 2032
- Figure 41: Europe Tuna and Algae Omega-3 Ingredient Industry Revenue Share (%), by Application 2024 & 2032
- Figure 42: Europe Tuna and Algae Omega-3 Ingredient Industry Volume Share (%), by Application 2024 & 2032
- Figure 43: Europe Tuna and Algae Omega-3 Ingredient Industry Revenue (Million), by Country 2024 & 2032
- Figure 44: Europe Tuna and Algae Omega-3 Ingredient Industry Volume (K Tons), by Country 2024 & 2032
- Figure 45: Europe Tuna and Algae Omega-3 Ingredient Industry Revenue Share (%), by Country 2024 & 2032
- Figure 46: Europe Tuna and Algae Omega-3 Ingredient Industry Volume Share (%), by Country 2024 & 2032
- Figure 47: Asia Pacific Tuna and Algae Omega-3 Ingredient Industry Revenue (Million), by Type 2024 & 2032
- Figure 48: Asia Pacific Tuna and Algae Omega-3 Ingredient Industry Volume (K Tons), by Type 2024 & 2032
- Figure 49: Asia Pacific Tuna and Algae Omega-3 Ingredient Industry Revenue Share (%), by Type 2024 & 2032
- Figure 50: Asia Pacific Tuna and Algae Omega-3 Ingredient Industry Volume Share (%), by Type 2024 & 2032
- Figure 51: Asia Pacific Tuna and Algae Omega-3 Ingredient Industry Revenue (Million), by Application 2024 & 2032
- Figure 52: Asia Pacific Tuna and Algae Omega-3 Ingredient Industry Volume (K Tons), by Application 2024 & 2032
- Figure 53: Asia Pacific Tuna and Algae Omega-3 Ingredient Industry Revenue Share (%), by Application 2024 & 2032
- Figure 54: Asia Pacific Tuna and Algae Omega-3 Ingredient Industry Volume Share (%), by Application 2024 & 2032
- Figure 55: Asia Pacific Tuna and Algae Omega-3 Ingredient Industry Revenue (Million), by Country 2024 & 2032
- Figure 56: Asia Pacific Tuna and Algae Omega-3 Ingredient Industry Volume (K Tons), by Country 2024 & 2032
- Figure 57: Asia Pacific Tuna and Algae Omega-3 Ingredient Industry Revenue Share (%), by Country 2024 & 2032
- Figure 58: Asia Pacific Tuna and Algae Omega-3 Ingredient Industry Volume Share (%), by Country 2024 & 2032
- Figure 59: South America Tuna and Algae Omega-3 Ingredient Industry Revenue (Million), by Type 2024 & 2032
- Figure 60: South America Tuna and Algae Omega-3 Ingredient Industry Volume (K Tons), by Type 2024 & 2032
- Figure 61: South America Tuna and Algae Omega-3 Ingredient Industry Revenue Share (%), by Type 2024 & 2032
- Figure 62: South America Tuna and Algae Omega-3 Ingredient Industry Volume Share (%), by Type 2024 & 2032
- Figure 63: South America Tuna and Algae Omega-3 Ingredient Industry Revenue (Million), by Application 2024 & 2032
- Figure 64: South America Tuna and Algae Omega-3 Ingredient Industry Volume (K Tons), by Application 2024 & 2032
- Figure 65: South America Tuna and Algae Omega-3 Ingredient Industry Revenue Share (%), by Application 2024 & 2032
- Figure 66: South America Tuna and Algae Omega-3 Ingredient Industry Volume Share (%), by Application 2024 & 2032
- Figure 67: South America Tuna and Algae Omega-3 Ingredient Industry Revenue (Million), by Country 2024 & 2032
- Figure 68: South America Tuna and Algae Omega-3 Ingredient Industry Volume (K Tons), by Country 2024 & 2032
- Figure 69: South America Tuna and Algae Omega-3 Ingredient Industry Revenue Share (%), by Country 2024 & 2032
- Figure 70: South America Tuna and Algae Omega-3 Ingredient Industry Volume Share (%), by Country 2024 & 2032
- Figure 71: Middle East and Africa Tuna and Algae Omega-3 Ingredient Industry Revenue (Million), by Type 2024 & 2032
- Figure 72: Middle East and Africa Tuna and Algae Omega-3 Ingredient Industry Volume (K Tons), by Type 2024 & 2032
- Figure 73: Middle East and Africa Tuna and Algae Omega-3 Ingredient Industry Revenue Share (%), by Type 2024 & 2032
- Figure 74: Middle East and Africa Tuna and Algae Omega-3 Ingredient Industry Volume Share (%), by Type 2024 & 2032
- Figure 75: Middle East and Africa Tuna and Algae Omega-3 Ingredient Industry Revenue (Million), by Application 2024 & 2032
- Figure 76: Middle East and Africa Tuna and Algae Omega-3 Ingredient Industry Volume (K Tons), by Application 2024 & 2032
- Figure 77: Middle East and Africa Tuna and Algae Omega-3 Ingredient Industry Revenue Share (%), by Application 2024 & 2032
- Figure 78: Middle East and Africa Tuna and Algae Omega-3 Ingredient Industry Volume Share (%), by Application 2024 & 2032
- Figure 79: Middle East and Africa Tuna and Algae Omega-3 Ingredient Industry Revenue (Million), by Country 2024 & 2032
- Figure 80: Middle East and Africa Tuna and Algae Omega-3 Ingredient Industry Volume (K Tons), by Country 2024 & 2032
- Figure 81: Middle East and Africa Tuna and Algae Omega-3 Ingredient Industry Revenue Share (%), by Country 2024 & 2032
- Figure 82: Middle East and Africa Tuna and Algae Omega-3 Ingredient Industry Volume Share (%), by Country 2024 & 2032
List of Tables
- Table 1: Global Tuna and Algae Omega-3 Ingredient Industry Revenue Million Forecast, by Region 2019 & 2032
- Table 2: Global Tuna and Algae Omega-3 Ingredient Industry Volume K Tons Forecast, by Region 2019 & 2032
- Table 3: Global Tuna and Algae Omega-3 Ingredient Industry Revenue Million Forecast, by Type 2019 & 2032
- Table 4: Global Tuna and Algae Omega-3 Ingredient Industry Volume K Tons Forecast, by Type 2019 & 2032
- Table 5: Global Tuna and Algae Omega-3 Ingredient Industry Revenue Million Forecast, by Application 2019 & 2032
- Table 6: Global Tuna and Algae Omega-3 Ingredient Industry Volume K Tons Forecast, by Application 2019 & 2032
- Table 7: Global Tuna and Algae Omega-3 Ingredient Industry Revenue Million Forecast, by Region 2019 & 2032
- Table 8: Global Tuna and Algae Omega-3 Ingredient Industry Volume K Tons Forecast, by Region 2019 & 2032
- Table 9: Global Tuna and Algae Omega-3 Ingredient Industry Revenue Million Forecast, by Country 2019 & 2032
- Table 10: Global Tuna and Algae Omega-3 Ingredient Industry Volume K Tons Forecast, by Country 2019 & 2032
- Table 11: United States Tuna and Algae Omega-3 Ingredient Industry Revenue (Million) Forecast, by Application 2019 & 2032
- Table 12: United States Tuna and Algae Omega-3 Ingredient Industry Volume (K Tons) Forecast, by Application 2019 & 2032
- Table 13: Canada Tuna and Algae Omega-3 Ingredient Industry Revenue (Million) Forecast, by Application 2019 & 2032
- Table 14: Canada Tuna and Algae Omega-3 Ingredient Industry Volume (K Tons) Forecast, by Application 2019 & 2032
- Table 15: Mexico Tuna and Algae Omega-3 Ingredient Industry Revenue (Million) Forecast, by Application 2019 & 2032
- Table 16: Mexico Tuna and Algae Omega-3 Ingredient Industry Volume (K Tons) Forecast, by Application 2019 & 2032
- Table 17: Rest of North America Tuna and Algae Omega-3 Ingredient Industry Revenue (Million) Forecast, by Application 2019 & 2032
- Table 18: Rest of North America Tuna and Algae Omega-3 Ingredient Industry Volume (K Tons) Forecast, by Application 2019 & 2032
- Table 19: Global Tuna and Algae Omega-3 Ingredient Industry Revenue Million Forecast, by Country 2019 & 2032
- Table 20: Global Tuna and Algae Omega-3 Ingredient Industry Volume K Tons Forecast, by Country 2019 & 2032
- Table 21: Spain Tuna and Algae Omega-3 Ingredient Industry Revenue (Million) Forecast, by Application 2019 & 2032
- Table 22: Spain Tuna and Algae Omega-3 Ingredient Industry Volume (K Tons) Forecast, by Application 2019 & 2032
- Table 23: United Kingdom Tuna and Algae Omega-3 Ingredient Industry Revenue (Million) Forecast, by Application 2019 & 2032
- Table 24: United Kingdom Tuna and Algae Omega-3 Ingredient Industry Volume (K Tons) Forecast, by Application 2019 & 2032
- Table 25: Germany Tuna and Algae Omega-3 Ingredient Industry Revenue (Million) Forecast, by Application 2019 & 2032
- Table 26: Germany Tuna and Algae Omega-3 Ingredient Industry Volume (K Tons) Forecast, by Application 2019 & 2032
- Table 27: France Tuna and Algae Omega-3 Ingredient Industry Revenue (Million) Forecast, by Application 2019 & 2032
- Table 28: France Tuna and Algae Omega-3 Ingredient Industry Volume (K Tons) Forecast, by Application 2019 & 2032
- Table 29: Italy Tuna and Algae Omega-3 Ingredient Industry Revenue (Million) Forecast, by Application 2019 & 2032
- Table 30: Italy Tuna and Algae Omega-3 Ingredient Industry Volume (K Tons) Forecast, by Application 2019 & 2032
- Table 31: Russia Tuna and Algae Omega-3 Ingredient Industry Revenue (Million) Forecast, by Application 2019 & 2032
- Table 32: Russia Tuna and Algae Omega-3 Ingredient Industry Volume (K Tons) Forecast, by Application 2019 & 2032
- Table 33: Rest of Europe Tuna and Algae Omega-3 Ingredient Industry Revenue (Million) Forecast, by Application 2019 & 2032
- Table 34: Rest of Europe Tuna and Algae Omega-3 Ingredient Industry Volume (K Tons) Forecast, by Application 2019 & 2032
- Table 35: Global Tuna and Algae Omega-3 Ingredient Industry Revenue Million Forecast, by Country 2019 & 2032
- Table 36: Global Tuna and Algae Omega-3 Ingredient Industry Volume K Tons Forecast, by Country 2019 & 2032
- Table 37: China Tuna and Algae Omega-3 Ingredient Industry Revenue (Million) Forecast, by Application 2019 & 2032
- Table 38: China Tuna and Algae Omega-3 Ingredient Industry Volume (K Tons) Forecast, by Application 2019 & 2032
- Table 39: Japan Tuna and Algae Omega-3 Ingredient Industry Revenue (Million) Forecast, by Application 2019 & 2032
- Table 40: Japan Tuna and Algae Omega-3 Ingredient Industry Volume (K Tons) Forecast, by Application 2019 & 2032
- Table 41: India Tuna and Algae Omega-3 Ingredient Industry Revenue (Million) Forecast, by Application 2019 & 2032
- Table 42: India Tuna and Algae Omega-3 Ingredient Industry Volume (K Tons) Forecast, by Application 2019 & 2032
- Table 43: Australia Tuna and Algae Omega-3 Ingredient Industry Revenue (Million) Forecast, by Application 2019 & 2032
- Table 44: Australia Tuna and Algae Omega-3 Ingredient Industry Volume (K Tons) Forecast, by Application 2019 & 2032
- Table 45: Rest of Asia Pacific Tuna and Algae Omega-3 Ingredient Industry Revenue (Million) Forecast, by Application 2019 & 2032
- Table 46: Rest of Asia Pacific Tuna and Algae Omega-3 Ingredient Industry Volume (K Tons) Forecast, by Application 2019 & 2032
- Table 47: Global Tuna and Algae Omega-3 Ingredient Industry Revenue Million Forecast, by Country 2019 & 2032
- Table 48: Global Tuna and Algae Omega-3 Ingredient Industry Volume K Tons Forecast, by Country 2019 & 2032
- Table 49: Brazil Tuna and Algae Omega-3 Ingredient Industry Revenue (Million) Forecast, by Application 2019 & 2032
- Table 50: Brazil Tuna and Algae Omega-3 Ingredient Industry Volume (K Tons) Forecast, by Application 2019 & 2032
- Table 51: Argentina Tuna and Algae Omega-3 Ingredient Industry Revenue (Million) Forecast, by Application 2019 & 2032
- Table 52: Argentina Tuna and Algae Omega-3 Ingredient Industry Volume (K Tons) Forecast, by Application 2019 & 2032
- Table 53: Rest of South America Tuna and Algae Omega-3 Ingredient Industry Revenue (Million) Forecast, by Application 2019 & 2032
- Table 54: Rest of South America Tuna and Algae Omega-3 Ingredient Industry Volume (K Tons) Forecast, by Application 2019 & 2032
- Table 55: Global Tuna and Algae Omega-3 Ingredient Industry Revenue Million Forecast, by Country 2019 & 2032
- Table 56: Global Tuna and Algae Omega-3 Ingredient Industry Volume K Tons Forecast, by Country 2019 & 2032
- Table 57: South Africa Tuna and Algae Omega-3 Ingredient Industry Revenue (Million) Forecast, by Application 2019 & 2032
- Table 58: South Africa Tuna and Algae Omega-3 Ingredient Industry Volume (K Tons) Forecast, by Application 2019 & 2032
- Table 59: United Arab Emirates Tuna and Algae Omega-3 Ingredient Industry Revenue (Million) Forecast, by Application 2019 & 2032
- Table 60: United Arab Emirates Tuna and Algae Omega-3 Ingredient Industry Volume (K Tons) Forecast, by Application 2019 & 2032
- Table 61: Rest of Middle East and Africa Tuna and Algae Omega-3 Ingredient Industry Revenue (Million) Forecast, by Application 2019 & 2032
- Table 62: Rest of Middle East and Africa Tuna and Algae Omega-3 Ingredient Industry Volume (K Tons) Forecast, by Application 2019 & 2032
- Table 63: Global Tuna and Algae Omega-3 Ingredient Industry Revenue Million Forecast, by Type 2019 & 2032
- Table 64: Global Tuna and Algae Omega-3 Ingredient Industry Volume K Tons Forecast, by Type 2019 & 2032
- Table 65: Global Tuna and Algae Omega-3 Ingredient Industry Revenue Million Forecast, by Application 2019 & 2032
- Table 66: Global Tuna and Algae Omega-3 Ingredient Industry Volume K Tons Forecast, by Application 2019 & 2032
- Table 67: Global Tuna and Algae Omega-3 Ingredient Industry Revenue Million Forecast, by Country 2019 & 2032
- Table 68: Global Tuna and Algae Omega-3 Ingredient Industry Volume K Tons Forecast, by Country 2019 & 2032
- Table 69: United States Tuna and Algae Omega-3 Ingredient Industry Revenue (Million) Forecast, by Application 2019 & 2032
- Table 70: United States Tuna and Algae Omega-3 Ingredient Industry Volume (K Tons) Forecast, by Application 2019 & 2032
- Table 71: Canada Tuna and Algae Omega-3 Ingredient Industry Revenue (Million) Forecast, by Application 2019 & 2032
- Table 72: Canada Tuna and Algae Omega-3 Ingredient Industry Volume (K Tons) Forecast, by Application 2019 & 2032
- Table 73: Mexico Tuna and Algae Omega-3 Ingredient Industry Revenue (Million) Forecast, by Application 2019 & 2032
- Table 74: Mexico Tuna and Algae Omega-3 Ingredient Industry Volume (K Tons) Forecast, by Application 2019 & 2032
- Table 75: Rest of North America Tuna and Algae Omega-3 Ingredient Industry Revenue (Million) Forecast, by Application 2019 & 2032
- Table 76: Rest of North America Tuna and Algae Omega-3 Ingredient Industry Volume (K Tons) Forecast, by Application 2019 & 2032
- Table 77: Global Tuna and Algae Omega-3 Ingredient Industry Revenue Million Forecast, by Type 2019 & 2032
- Table 78: Global Tuna and Algae Omega-3 Ingredient Industry Volume K Tons Forecast, by Type 2019 & 2032
- Table 79: Global Tuna and Algae Omega-3 Ingredient Industry Revenue Million Forecast, by Application 2019 & 2032
- Table 80: Global Tuna and Algae Omega-3 Ingredient Industry Volume K Tons Forecast, by Application 2019 & 2032
- Table 81: Global Tuna and Algae Omega-3 Ingredient Industry Revenue Million Forecast, by Country 2019 & 2032
- Table 82: Global Tuna and Algae Omega-3 Ingredient Industry Volume K Tons Forecast, by Country 2019 & 2032
- Table 83: Spain Tuna and Algae Omega-3 Ingredient Industry Revenue (Million) Forecast, by Application 2019 & 2032
- Table 84: Spain Tuna and Algae Omega-3 Ingredient Industry Volume (K Tons) Forecast, by Application 2019 & 2032
- Table 85: United Kingdom Tuna and Algae Omega-3 Ingredient Industry Revenue (Million) Forecast, by Application 2019 & 2032
- Table 86: United Kingdom Tuna and Algae Omega-3 Ingredient Industry Volume (K Tons) Forecast, by Application 2019 & 2032
- Table 87: Germany Tuna and Algae Omega-3 Ingredient Industry Revenue (Million) Forecast, by Application 2019 & 2032
- Table 88: Germany Tuna and Algae Omega-3 Ingredient Industry Volume (K Tons) Forecast, by Application 2019 & 2032
- Table 89: France Tuna and Algae Omega-3 Ingredient Industry Revenue (Million) Forecast, by Application 2019 & 2032
- Table 90: France Tuna and Algae Omega-3 Ingredient Industry Volume (K Tons) Forecast, by Application 2019 & 2032
- Table 91: Italy Tuna and Algae Omega-3 Ingredient Industry Revenue (Million) Forecast, by Application 2019 & 2032
- Table 92: Italy Tuna and Algae Omega-3 Ingredient Industry Volume (K Tons) Forecast, by Application 2019 & 2032
- Table 93: Russia Tuna and Algae Omega-3 Ingredient Industry Revenue (Million) Forecast, by Application 2019 & 2032
- Table 94: Russia Tuna and Algae Omega-3 Ingredient Industry Volume (K Tons) Forecast, by Application 2019 & 2032
- Table 95: Rest of Europe Tuna and Algae Omega-3 Ingredient Industry Revenue (Million) Forecast, by Application 2019 & 2032
- Table 96: Rest of Europe Tuna and Algae Omega-3 Ingredient Industry Volume (K Tons) Forecast, by Application 2019 & 2032
- Table 97: Global Tuna and Algae Omega-3 Ingredient Industry Revenue Million Forecast, by Type 2019 & 2032
- Table 98: Global Tuna and Algae Omega-3 Ingredient Industry Volume K Tons Forecast, by Type 2019 & 2032
- Table 99: Global Tuna and Algae Omega-3 Ingredient Industry Revenue Million Forecast, by Application 2019 & 2032
- Table 100: Global Tuna and Algae Omega-3 Ingredient Industry Volume K Tons Forecast, by Application 2019 & 2032
- Table 101: Global Tuna and Algae Omega-3 Ingredient Industry Revenue Million Forecast, by Country 2019 & 2032
- Table 102: Global Tuna and Algae Omega-3 Ingredient Industry Volume K Tons Forecast, by Country 2019 & 2032
- Table 103: China Tuna and Algae Omega-3 Ingredient Industry Revenue (Million) Forecast, by Application 2019 & 2032
- Table 104: China Tuna and Algae Omega-3 Ingredient Industry Volume (K Tons) Forecast, by Application 2019 & 2032
- Table 105: Japan Tuna and Algae Omega-3 Ingredient Industry Revenue (Million) Forecast, by Application 2019 & 2032
- Table 106: Japan Tuna and Algae Omega-3 Ingredient Industry Volume (K Tons) Forecast, by Application 2019 & 2032
- Table 107: India Tuna and Algae Omega-3 Ingredient Industry Revenue (Million) Forecast, by Application 2019 & 2032
- Table 108: India Tuna and Algae Omega-3 Ingredient Industry Volume (K Tons) Forecast, by Application 2019 & 2032
- Table 109: Australia Tuna and Algae Omega-3 Ingredient Industry Revenue (Million) Forecast, by Application 2019 & 2032
- Table 110: Australia Tuna and Algae Omega-3 Ingredient Industry Volume (K Tons) Forecast, by Application 2019 & 2032
- Table 111: Rest of Asia Pacific Tuna and Algae Omega-3 Ingredient Industry Revenue (Million) Forecast, by Application 2019 & 2032
- Table 112: Rest of Asia Pacific Tuna and Algae Omega-3 Ingredient Industry Volume (K Tons) Forecast, by Application 2019 & 2032
- Table 113: Global Tuna and Algae Omega-3 Ingredient Industry Revenue Million Forecast, by Type 2019 & 2032
- Table 114: Global Tuna and Algae Omega-3 Ingredient Industry Volume K Tons Forecast, by Type 2019 & 2032
- Table 115: Global Tuna and Algae Omega-3 Ingredient Industry Revenue Million Forecast, by Application 2019 & 2032
- Table 116: Global Tuna and Algae Omega-3 Ingredient Industry Volume K Tons Forecast, by Application 2019 & 2032
- Table 117: Global Tuna and Algae Omega-3 Ingredient Industry Revenue Million Forecast, by Country 2019 & 2032
- Table 118: Global Tuna and Algae Omega-3 Ingredient Industry Volume K Tons Forecast, by Country 2019 & 2032
- Table 119: Brazil Tuna and Algae Omega-3 Ingredient Industry Revenue (Million) Forecast, by Application 2019 & 2032
- Table 120: Brazil Tuna and Algae Omega-3 Ingredient Industry Volume (K Tons) Forecast, by Application 2019 & 2032
- Table 121: Argentina Tuna and Algae Omega-3 Ingredient Industry Revenue (Million) Forecast, by Application 2019 & 2032
- Table 122: Argentina Tuna and Algae Omega-3 Ingredient Industry Volume (K Tons) Forecast, by Application 2019 & 2032
- Table 123: Rest of South America Tuna and Algae Omega-3 Ingredient Industry Revenue (Million) Forecast, by Application 2019 & 2032
- Table 124: Rest of South America Tuna and Algae Omega-3 Ingredient Industry Volume (K Tons) Forecast, by Application 2019 & 2032
- Table 125: Global Tuna and Algae Omega-3 Ingredient Industry Revenue Million Forecast, by Type 2019 & 2032
- Table 126: Global Tuna and Algae Omega-3 Ingredient Industry Volume K Tons Forecast, by Type 2019 & 2032
- Table 127: Global Tuna and Algae Omega-3 Ingredient Industry Revenue Million Forecast, by Application 2019 & 2032
- Table 128: Global Tuna and Algae Omega-3 Ingredient Industry Volume K Tons Forecast, by Application 2019 & 2032
- Table 129: Global Tuna and Algae Omega-3 Ingredient Industry Revenue Million Forecast, by Country 2019 & 2032
- Table 130: Global Tuna and Algae Omega-3 Ingredient Industry Volume K Tons Forecast, by Country 2019 & 2032
- Table 131: South Africa Tuna and Algae Omega-3 Ingredient Industry Revenue (Million) Forecast, by Application 2019 & 2032
- Table 132: South Africa Tuna and Algae Omega-3 Ingredient Industry Volume (K Tons) Forecast, by Application 2019 & 2032
- Table 133: United Arab Emirates Tuna and Algae Omega-3 Ingredient Industry Revenue (Million) Forecast, by Application 2019 & 2032
- Table 134: United Arab Emirates Tuna and Algae Omega-3 Ingredient Industry Volume (K Tons) Forecast, by Application 2019 & 2032
- Table 135: Rest of Middle East and Africa Tuna and Algae Omega-3 Ingredient Industry Revenue (Million) Forecast, by Application 2019 & 2032
- Table 136: Rest of Middle East and Africa Tuna and Algae Omega-3 Ingredient Industry Volume (K Tons) Forecast, by Application 2019 & 2032
Frequently Asked Questions
1. What is the projected Compound Annual Growth Rate (CAGR) of the Tuna and Algae Omega-3 Ingredient Industry?
The projected CAGR is approximately 14.03%.
2. Which companies are prominent players in the Tuna and Algae Omega-3 Ingredient Industry?
Key companies in the market include AlgaeCytes*List Not Exhaustive, Archer Daniels Midland Company, BASF SE, Polaris SA, Neptune Wellness Solutions Inc, Koninklijke DSM NV, Bioprocess Algae LLC, Lonza, Corbion NV, Source-Omega LLC.
3. What are the main segments of the Tuna and Algae Omega-3 Ingredient Industry?
The market segments include Type, Application.
4. Can you provide details about the market size?
The market size is estimated to be USD 2,895.3 Million as of 2022.
5. What are some drivers contributing to market growth?
Increasing Demand For Convenience & Processed Food.
6. What are the notable trends driving market growth?
Increasing Consumer Expenditure on Omega-3 Supplements Products.
7. Are there any restraints impacting market growth?
Increased Consumer Awareness On Side-Effects Of Chemical Additives.
8. Can you provide examples of recent developments in the market?
February 2022: Polaris partnered with Golden Omega USA to distribute its algae oils across North America.
9. What pricing options are available for accessing the report?
Pricing options include single-user, multi-user, and enterprise licenses priced at USD 4750, USD 5250, and USD 8750 respectively.
10. Is the market size provided in terms of value or volume?
The market size is provided in terms of value, measured in Million and volume, measured in K Tons.
11. Are there any specific market keywords associated with the report?
Yes, the market keyword associated with the report is "Tuna and Algae Omega-3 Ingredient Industry," which aids in identifying and referencing the specific market segment covered.
12. How do I determine which pricing option suits my needs best?
The pricing options vary based on user requirements and access needs. Individual users may opt for single-user licenses, while businesses requiring broader access may choose multi-user or enterprise licenses for cost-effective access to the report.
13. Are there any additional resources or data provided in the Tuna and Algae Omega-3 Ingredient Industry report?
While the report offers comprehensive insights, it's advisable to review the specific contents or supplementary materials provided to ascertain if additional resources or data are available.
14. How can I stay updated on further developments or reports in the Tuna and Algae Omega-3 Ingredient Industry?
To stay informed about further developments, trends, and reports in the Tuna and Algae Omega-3 Ingredient Industry, consider subscribing to industry newsletters, following relevant companies and organizations, or regularly checking reputable industry news sources and publications.
Methodology
Step 1 - Identification of Relevant Samples Size from Population Database


Step 2 - Approaches for Defining Global Market Size (Value, Volume* & Price*)

Note*: In applicable scenarios
Step 3 - Data Sources
Primary Research
- Web Analytics
- Survey Reports
- Research Institute
- Latest Research Reports
- Opinion Leaders
Secondary Research
- Annual Reports
- White Paper
- Latest Press Release
- Industry Association
- Paid Database
- Investor Presentations

Step 4 - Data Triangulation
Involves using different sources of information in order to increase the validity of a study
These sources are likely to be stakeholders in a program - participants, other researchers, program staff, other community members, and so on.
Then we put all data in single framework & apply various statistical tools to find out the dynamic on the market.
During the analysis stage, feedback from the stakeholder groups would be compared to determine areas of agreement as well as areas of divergence


